Algorithm for Identifying Outliers in Complicated
Transactions
Dr. V. Nandakumar
Department of Computer Science and Engineering
Alagappa University, karaikudi, Tamil Nadu,India [email protected]
Abstract— Outliers are an important conception in data analysis and are being researched in diverse fields. Outliers have a value that is numerically different from the rest of the data when viewed as patterns. It is subjective exercise in various knowledge disciplines. Applications can range from data cleaning to fraud and intrusion detection. Businesses are susceptible to fraud which be detected using Data mining tools. Offenders may display random and/or occasional dishonest behaviour when there is opportunity. The key challenge in outlier detection is representing normal behaviour and then exploring an unknown domain, since different domains impose different requirements or constraints giving rise to different formulations in outlier detection. This paper proposes and attempts a Novel Outlier Detection Algorithm (N-SOD) based on select fields of chosen object characteristics that are interesting to analyze and demonstrated with examples.
Index Term
—
Fraud detection, Nearest Neighbour, ATM Transaction Fraud, Outlier Detection, Network IntrusionI. INTRODUCTION
Previous studies have used outlier detection models to mine fraud transactions [1]. Outliers are patterns that are away from normal behavior. Outliers might occur in the data due to a variety of reasons like a malicious activity [2]. Outlier detection is discovering these exceptional behaviours. Outliers can be caused due to, measurement errors, erroneous distribution assumption and undefined data structures [3]. Errors in assumption of data distribution can lead to misinterpretation of data as outliers. Outlier reasons can be due to data entry mistakes, poorly constructed subjects or different response values from the subjects. There are numerous common tests for identifying outliers in normal distributions based on hypothetical testing like Rosner, Dixon, Grubbs tests and box plot rule[3]. Rosner’s Test is always two-tailed and identifies high and low outliers. It can be used for detecting up to k outliers where the mean and standard deviation are calculated. A procedure that removes the data set y farthest from the mean and test statistic N is compared for null hypothesis. N is calculated using equation (1)
Ni+1 = |y (i)
- ỹ(i)| / s(i). (1)
When N is lesser than a critical value, it implies there are no outliers [4] and when greater than the critical value it implies presence of outliers [5]. This paper uses a distance based factor, identifying the deviation from its neighbors [6] calculating its deviation from its neighbors and is defined by equation (2)
POutlier = Np - POutlier (2)
Where P is any any outlier point defined by its distance from Np , he average distance of its neighbour. The Nearest Neighbours (NN) of p equal the average distance from p to all objects in Np. if dist(p, q) ≥ 0 is the distance between objects p and q then the nearest neighbours of object p is defined in equation(3) as:
dp (3)
II. NOVEL STRATEGIC OUTLIER DETECTION ALGORITHM (N-SOD)
Finding Outliers automatically in a database is a commonly studied problem in data mining [7], since they can be indicative of bad data or malicious behavior like erroneous values resulting from data entry mistakes. Malicious actions in a database environment may not filter intrusion mechanisms like the inside attacks which are difficult to detect and isolate, since the attacks are carried out by legitimate users with full access rights on data and system resources. Masquerade attacks from outsiders hide identities and are one of the most frequent forms of computer security attacks. The attacks present a range of difficulties limiting the effectiveness of techniques in real world datasets. Effective outlier detection requires the construction of an accurate model and many methods do not scale well, even on modest number of transactions. The construction of a model to accurately represent data in complex systems is thus required. Detecting fraudulent Transactions or network intrusions is a difficult task with normal procedures, making it significant to develop performing models in the academic and business community. Existing models are mostly statistics-driven or artificial intelligent-based having theoretical advantages, but do not impose assumptions on the input variables. The key challenge in outlier detection is exploring an unknown domain and defining a region for representing normal behavior in different domains which impose varying requirements or constraints, thus giving rise to different formulations in outlier detection.
A. N-SOD Algorithm Np is the Base point
UpperRange is defined as Np + of Np where can
be 5,10,15,20,25…….
LowerRange is defined as Np - of Np where
can be 5,10,15,20,25……. D is the Dataset of transactions For i = 1 .. N in D
MinAmt = min(D)
If (MaxAmt > UpperRange ) or If (MinAmt < LowerRange)
//Upper Range for n/w traffic is 196 bytes and ATM withdrawal is 3000
“Outlier ” End if Cond. End for (j) End for (i):
.
III.APPLICATION OF N-SOD TO NETWORK INTRUSION Though anomalous events may occur infrequently, their occurrence can have dramatic consequences in a negative sense. Increasing numbers of interconnected networks to the internet have led to an increase in cyber attacks, thus making an effective intrusion detection system, a definite need. N-SOD can be used for intrusion detection. Defining a region is challenging and the demarcation of outlier behaviour is often not precise and differs for different application domains. Availability of labelled data for training/validation is difficult to presume. Also Data might contain noise and the Normal behaviour keeps evolving. Anomaly detection depends on, Nature of input data, Availability of supervision, Type of anomaly: point, contextual, structural.
A. N-SOD N/w Intrusion Algorithm
Let Np = BaseTransBytes.= Average(Average of the
bytes received from an IP Address)
Let % be 2% for the Ranges and upper range is BaseTransBytes. + 2% of BaseTransBytes Let the LowerRange in the Range be defined as BaseTransBytes. - 2% of BaseTransBytes.
D = records of Source IP Address No of Transmitted to Destination IP and Destination IP grouped by Source IP Address, Bytes, Dest. IP Address
For i = 1 to N in D TransBytes = Bytes
If (TransBytes > UpperRange ) // UpperRange = 196+2% of 196
“ Network Intrusion ” End if Cond.
If (TransBytes < LowerRange) “Network Intrusion” End if Cond.
End for (j) End for (i)
B. Training Sets
The first objective is to build the Training examples D. D Consists of all the entries in network movement or traffic like
(1) Source IP Address (2) Start Time (3) Target IP Address (4) Target Port
(5) No of Bytes Transmitted
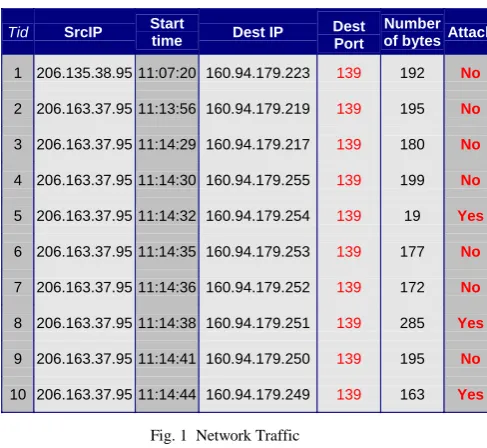
Table I lists typical network traffic details where network intrusion/outlier is detected with N-SOD. Serial numbers 5,
can be presumed as possible intrusions. Most detections fail for low values since it is not taken in to consideration and only inflated values are considered in n/w intrusion as a possible attack. The virus or intrusion code may be very less compared with other normal codes. Figure 1 the network traffic trapped at server level.
Fig. 1 Network Traffic
IV.APPLICATION OF N-SOD FOR ATMTRANSACTIONS Original ATM transactions are not for public view, due to privacy policies of bank, data is approximated for ATM transactions and the algorithm is trained using sample of generated labelled data. Anomalous transactions in an ATM card can indicate usage of a stolen card. Any customer who withdraws money from an ATM requires an authorization like the ATM pin which is a secret number. ATM cards can be stolen or misused or forged. The objective of N-SOD is to identify transactions which are anomalous or outlier to the regular pattern using nearest neighbour algorithm.
A. Training Set
The first objective is to build the Training examples D. D Consists of all the ATM transaction of a given card. An ATM transaction is composed of the following to list a few important details.
(1) ATM Location (2) ATM Number. (3) Account Number. (4) Card Number (5) Date of Withdrawal. (6) Time of Withdrawal (7) Withdrawal amount
B. N-SOD ATM Algorithm
Let Np the Average of all the amounts withdrawn be the
BaseAmt and % be 20%
BaseAmt.= Average(Amounts withdrawn from ATM for
Six months)
Let the UpperRange in the Range be defined as BaseAmt.
+ 20% of BaseAmt.
Tid SrcIP Start
time Dest IP
Dest Port
Number of bytes Attack
1 206.135.38.95 11:07:20 160.94.179.223 139 192 No
2 206.163.37.95 11:13:56 160.94.179.219 139 195 No
3 206.163.37.95 11:14:29 160.94.179.217 139 180 No
4 206.163.37.95 11:14:30 160.94.179.255 139 199 No
5 206.163.37.95 11:14:32 160.94.179.254 139 19 Yes
6 206.163.37.95 11:14:35 160.94.179.253 139 177 No
7 206.163.37.95 11:14:36 160.94.179.252 139 172 No
8 206.163.37.95 11:14:38 160.94.179.251 139 285 Yes
9 206.163.37.95 11:14:41 160.94.179.250 139 195 No
10 206.163.37.95 11:14:44 160.94.179.249 139 163 Yes
Let the LowerRange in the Range be defined as BaseAmt.
- 20% of BaseAmt.
The Record set D = Average(Amounts in Month),
Count(Trans(in month)
For i = 1 to N //Number of Records in D
MaxAmt = maximum(Amount withdrawn) in
month
MinAmt = maximum(Amount withdrawn) in
month
If (MaxAmt > UpperRange )
//Greater than the average withdrawal amount
―Outlier Transaction is in the Present Month‖
End if Cond.
If (MinAmt < LowerRange)
―Outlier Transaction is in the Present Month‖
End if Cond.
End for (j)
End for (i)
For Example, the transaction occurred for Six Months is as follows and listed as Table I
Table I ATM Amount Withdrawals
The Total Transactions is 16 - D
The Total iterations for classifying Outliers would be 29+28+27+26+…….1.
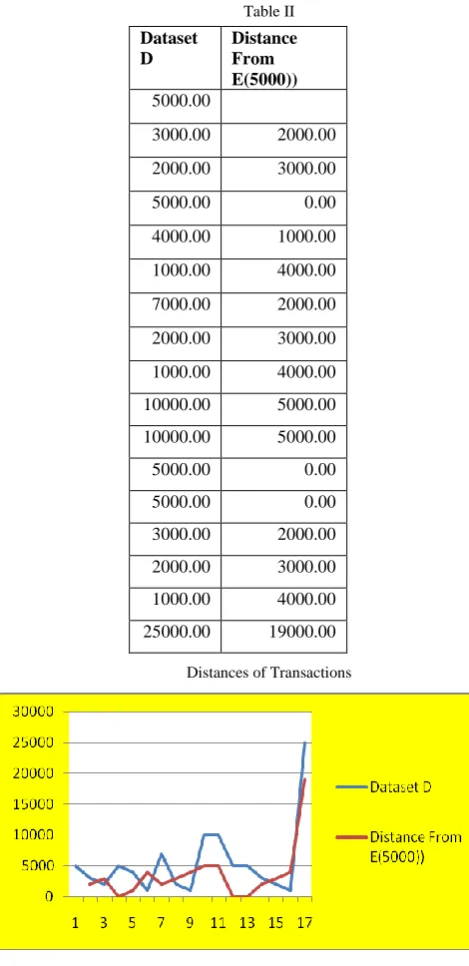
Taking the First Amount 5000 as an Example , the distances from other transactions would be as indicated in Table II and the graph for N-SOD Graph for Dataset D is depicted in Figure 2.
Table II
Distances of Transactions
Fig. 2. Graph of Distance of Data Elements
V. STRENGTH OF N-SOD
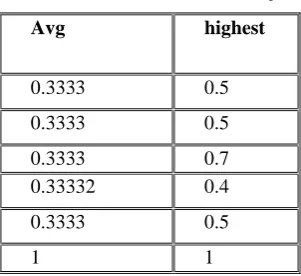
N-SOD is simple to implement and use. The technique is comprehensible and easy to explain. The prediction is robust to noisy data since it applies averaging k-nearest neighbors. In the above the examples the number of iterations is narrowed to less than 10 from huge number of iterations. Earlier transactions with Rapid Outlier Detection would be transformed as listed in Table III and Table IV and the graph for N-SOD Outliers would result in Figure 3.
Month1 Month2 Month3 Month4 Month5 Month6
5000 5000 7000 10000 5000 25000
3000 4000 2000 10000 3000
2000 1000 1000 5000 2000
Dataset D
Distance From E(5000)) 5000.00
3000.00 2000.00
2000.00 3000.00
5000.00 0.00
4000.00 1000.00
1000.00 4000.00
7000.00 2000.00
2000.00 3000.00
1000.00 4000.00
10000.00 5000.00
10000.00 5000.00
5000.00 0.00
5000.00 0.00
3000.00 2000.00
2000.00 3000.00
1000.00 4000.00
Table III
ATM Amount Withdrawals for Six Months -1
Table IV
ATM Amount Withdrawals With N-SOD NN Classifiers
Fig. 3. N-SOD Outlier Graph for ATM Trans
The Distances based on Euclidean Distance
would translate to Table V. The Values are Commonly
Divided by the Sum Amount to keep the Calculation Simpler.
Table V
Euclidean Distances Between the Samples
And the resulting graph displaying the Outliers in a more pronounced way would translate to Figure 4
Fig. 4. Graph of N-SOD Euclidean Distance
VI. CONCLUSION
Outlier detection methods in research focus over algorithms which require a special background. The notion of finding outlier also varies from domain to domain and their efficiency is highly dependent upon data distribution and type data. Financial Institutions plays a vital role in development of any country. Banks performs millions of transactions every day that require authenticity. Most of the banks use verification software to authorize data. The rapid style of life has seen the regular use of plastic cards for cash transactions, but, with increasing crimes involving ATM transactions, they cause losses to a bank and cardholder thus making identification and prevention of ATM card fraud a point to focus in any banks risk management. The proposed N-SOD is capable of identifying outliers and fraudulent transactions. Fraudulent transactions can also be identified when the time of withdrawal is analyzed. Two ATM transactions is succession but different timings like 6 pm and 3 am can indicate an outlier transaction. The location of the transaction and the distance between them is another factor for identifying outliers in ATM transactions. When two successive transactions are used for ATM withdrawal can indicate outliers, since repeated withdrawals happen due to ATM limits and not distance. N-Sod’s application to network traffic analysis can also exhibit interesting results and in general the paper has proposed a new way of looking at outliers for two domains with demonstrated results. An 5000
3000 2000 Avg=3333, Sum=10000 Highest=5000, Trans=3
5000 4000 1000
Avg=3333,Sum =10000 Highest=5000, Trans=3
7000 3000
Avg=3333,S um=10000 Highest=700 0,Trans=3 10000
10000 5000 Avg=8333,Su m=25000 Highest=10000 ,Trans=3
5000 4000 1000
Avg=3333,Sum =10000 Highest=5000, Trans=3
25000
Avg=25000, Sum=25000 Highest=250 00,Trans=1
Acco untno
Avg trns highest
0 0 0
1 2000 5 3000
2 3333 3 5000
3 5000 2 7000
4 1100 9 2000
5 2000 5 3000
6 2000 5 4000
Avg highest
0.3333 0.5
0.3333 0.5
0.3333 0.7
0.33332 0.4
0.3333 0.5
1 1
ni
i
i
y
x
Y
X
D
1
2
)
(
industry is claims fraud, since claimants and providers manipulate the claim processing system for unauthorized and illegal claims. The Insurance claim data can be handled as a monitoring problem [8]. N-SOD can be applied to this data to identify fraudulent claims.
R
EFERENCES[1] Han J W, Kamber M. Data Mining: Concepts and Techniques. Beijing: Higher Education Pr. and Morgan Kaufmann Publishers, 2007
[2] Detecting Anomalies by Online Techniques Using Spam Detection, R. Dharani , S. Subashini International Journal of Innovative Research in Computer and Communication Engineering Vol.2, Special Issue 1, March 2014
[3] http://www.webapps.cee.vt.edu/ewr/environmental/teach/smprimer/o utlier/outlier.html
[4]
http://web.squ.edu.om/med-Lib/MED_CD/E_CDs/anesthesia/site/content/v02/020670r00.HTM [5] samples.jbpub.com/9781449604752/04752_CH09_final.pd
[6] K. Zhang, M. Hutter, and H. Jin. A new local distance-based outlier detection approach for scattered real-world data. In PAKDD ’09: Proceedings of the 13th Pacific-Asia Conference on Advances in Knowledge Discovery and Data Mining, pages 813–822, 2009 [7] http://www.readbag.com/cse-ohio-state-dmrl-papers-kddws05 [8] Fawcett, T. and Provost, F. 1999. Activity monitoring: noticing
interesting changes in behavior. In Proceedings of the 5th ACM SIGKDD International Conference on Knowledge Discovery and Data Mining. ACMPress, 53 - 62