www.pharmascholars.com
1360
Original Article
CODEN: IJPNL6
BIOANALYTICAL METHOD DEVELOPMENT AND VALIDATION OF
VALSARTAN IN RABBIT PLASMA
Sandhya Pamu *
1, 2, C. V. S. Subrahmanyam
2and K. S. K. Rao Patnaik
1 1Department of Pharmacy, University College of Technology, Osmania University, Hyderabad
2
Gokaraju Rangaraju College of Pharmacy, Bachupally, Hyderabad, Telangana State
*Corresponding author e-mail: [email protected]
Received on: 02-08-2015; Revised on: 14-9-2015; Accepted on: 23-9-2015
ABSTRACT
Objective: To develop a liquid–liquid extraction based reversed-phase high performance liquid chromatography method for estimation of valsartan in rabbit plasma. Methods: Chromatographic separation was carried out using ODS Thermosil C18 (250mm×4.6mm) 5µm, with mobile phase composed of ammonium acetate buffer (20mM) and acetonitrile in 60:40 v/v ratio, pH 6.5. The analyte was monitored with UV detector at 265nm. The developed method was validated with respect to specificity, linearity, accuracy, precision, LOD, LOQ and ruggedness.
Results: The peak area ratio of valsartan to that of internal standard was used for the quantification of samples. The flow rate was 1.0 ml/min and the eluent was monitored at 265 nm. Calibration curves were linear in the concentration range of 10-200 ng/mL. The LOD and LOQ of present method were found to be 1.8 ng/mL and 5.4 ng/mL respectively. Extraction recoveries of drug from rabbit plasma were found to be >90 %. Conclusion: A simple, specific, reproducible and sensitive RP-HPLC method was developed and validated for the estimation of valsartan in rabbit plasma.
Keywords: RP-HPLC method, Valsartan, liquid–liquid extraction, rabbit plasma.
INTRODUCTION
Valsartan is an angiotensin-receptor blocker (ARB) that may be used to treat a variety of cardiac conditions including hypertension, diabetic nephropathy and heart failure. Valsartan lowers blood pressure by antagonizing the renin-angiotensin-aldosterone system (RAAS); it competes with angiotensin II for binding to the type-1 angiotensin II receptor (AT1) subtype and prevents the blood pressure increasing effects of angiotensin II. Unlike angiotensin-converting enzyme (ACE) inhibitors, ARBs do not have the adverse effect of dry cough. Valsartan may be used to treat hypertension, isolated systolic hypertension, left ventricular hypertrophy and diabetic nephropathy. It may also be used as an alternative agent for the treatment of heart failure,
systolic dysfunction, myocardial infarction and coronary artery disease [1].
Structure of Valsartan
MATERIALS AND METHODS
Reagents and Materials: Valsartan and Losartan were obtained as gift samples from Dr. Reddy’s
International Journal of Pharmacy
www.pharmascholars.com
1361
Laboratories Ltd., Hyderabad. All other reagentswere purchased from Standard Reagents Pvt. Ltd., Hyderabad. HPLC Grade water (0.45 µm membrane filtered) was produced in the laboratory.
Chromatographic instrumentation: The analysis
was carried out on a Shimadzu corporation Kyoto Japan LC-2010AT HPLC pump, SPD-20A UV detector, Rheodyne injector equipped with low pressure quaternary gradient pump along with dual wavelength UV detector, column oven, auto sampler and LC solution 1.2 SP1 software. ODS Thermosil C18 (250×4.6mm), 5µ column was used for drug separation. The analyte was monitored with UV detector at 265 nm. A glass vacuum-filtration apparatus (fitted with 0.22 µ filter) was used to filter mobile phase. Ultrasonic bath was used to remove dissolved gases and entrapped air in mobile phase. A model Genie-2 Spinix vortex mixer, a cold centrifugation (Sigma, Germany) were employed during sample processing and TurboVap LV Evaporator (Caliper Life Sciences, Hopkinton, MA, USA) for evaporation purpose after extraction [2, 3].
Chromatographic conditions: Chromatographic
separation was carried out using ODS Thermosil C18 (250×4.6mm) 5µ, with mobile phase composed of ammonium acetate buffer (20mM) and acetonitrile in 60:40 v/v ratio, pH 6.5. The analyte was monitored with UV detector at 265nm (Table 1).
Preparation of standard solutions: All standard stock solution and working standard solutions were prepared in volumetric flask. 100 mg of valsartan was dissolved in mobile phase to give standard stock solution of 100 mg/mL. Losartan potassium was used as an internal standard (IS). The working standard solutions were prepared by further serial dilution from the stock solutions with mobile phase mixture. Calibration standards of 10, 20, 50, 80,100, 120, 150 and 200 ng/mL in control rabbit plasma samples were prepared by mixing with 20 µL of working stock solutions of Valsartan[4].
Sample preparation: Frozen plasma samples were obtained from National Institute of Nutrition, Hyderabad, thawed and allowed to reach room temperature. An aliquot of 200 µL of rabbit plasma sample was mixed with 10 µL of internal standard solution. Subsequently, sample was extracted with 1.5 ml of tertiary-butyl methyl ether (TBME). The mixture was vortexed for 15 min and centrifuged at 3,000 rpm for 10 min. After centrifugation, the organic phase was transferred to glass tubes and evaporated to dryness using TurboVap LV Evaporator at 500C under stream of nitrogen for 5
min. The residue remaining after drying was reconstituted with 150 µL of mobile phase mixture and vortexed for 1 min then, a volume of 20 µL was injected into the HPLC system [5, 6].
Validation of method[7]: Validation of the developed method was carried out as per ICH guidelines for specificity, linearity, accuracy, precision, LOD, LOQ and ruggedness.
Specificity: The specificity of method was proved by processing and analyzing blanks prepared from six independent lots of control plasma along with six extracted LOQ-QC samples. The method is selective if there is no interfering peak present at the retention time of the drug or IS. If there is any interfering peak present at the retention time of drug then its response should be less than 20% of mean response of six extracted LOQ-QC samples.
Linearity: A calibration curve is the relationship
between instrument response and known
concentrations of the analyte. The linearity of developed method was evaluated with a total of three calibration curves over the concentration range of 10- 200 ng/mL by plotting the peak response (area) ratio of valsartan to Losartan potassium (y) versus concentration of valsartan in plasma (x) (Fig 4, Table 2).
Accuracy and precision: The different
concentrations including lower and upper limits of each sample (LOQ, LQC, MQC and HQC) in 12 determinations were analyzed on the same day and on three different days in order to determine the intra-day and inter-intra-day accuracy and precision. Accuracy studies of the method was determined by spiking the known amount of analyte to sample solution, with plasma and the percentage mean recovery was found to be 94.05 %, 94.42 % , 95.00 % and 98.68 % for 20 %, 50 %, 100 %, 150 % of Losartan respectively. Precision of the method and system were found to be within limits. % RSD of internal standard and standard was found to be 0.7, 0.8 respectively and the ratio of standard and internal standard is 0.73.
Limit of detection (LOD) and limit of
www.pharmascholars.com
1362
ratio of signal-to-noise more than 5 with accuracy of80-120% and precision of 20% to its nominal value. Limit of detection was found to be 1.8 ng/mL and limit of quantification was found to be 5.4 ng/mL for Valsartan.
Ruggedness: The ruggedness of the method was
studied by the determining the analyst to analyst variation by performing the Assay by two different analysts. % RSD Assay values between two analysts were not greater than 2.0 %.
CONCLUSION
A simple, specific, reproducible and sensitive RP-HPLC method was developed for the estimation of Valsartan in rabbit plasma. The method was validated over concentration range of 10-200 ng/mL with correlation coefficient of 0.998 and was found to offer good accuracy and precision. The exclusive advantage of the method is the small processing volumes used for extraction without jeopardizing the sensitivity. This method can be used to estimate the concentration of Valsartan in rabbit plasma in routine analysis.
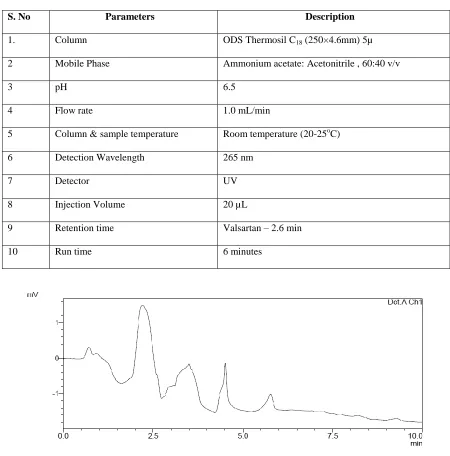
Table 1: Summary of Chromatographic conditions
S. No Parameters Description
1. Column ODS Thermosil C18 (250×4.6mm) 5µ
2 Mobile Phase Ammonium acetate: Acetonitrile , 60:40 v/v
3 pH 6.5
4 Flow rate 1.0 mL/min
5 Column & sample temperature Room temperature (20-25oC)
6 Detection Wavelength 265 nm
7 Detector UV
8 Injection Volume 20 µL
9 Retention time Valsartan – 2.6 min
10 Run time 6 minutes
www.pharmascholars.com
1363
Fig 2: Typical chromatogram of plasma
Fig 3: Typical chromatogram of Valsartan with internal standard
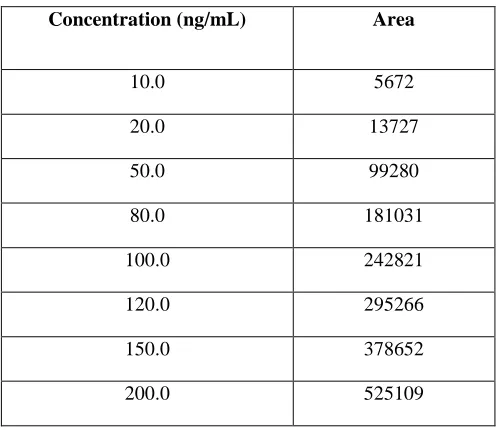
Table 2: Calibration curve of Valsartan
Concentration (ng/mL) Area
10.0 5672
20.0 13727
50.0 99280
80.0 181031
100.0 242821
120.0 295266
150.0 378652
www.pharmascholars.com
1364
Fig 4: Calibration curve of Valsartan
REFERENCES
1. Criscione L, de Gasparo M, Buhlmayer P, et al. Pharmacological profile of valsartan: A potent, orally active, nonpeptide antagonist of the angiotensin II AT1-receptor subtype. Br J Pharmacol., 1993;110:761-771.
2. Venkata Suresh. P, Rama Rao Nadendlaa and B. R. Challa, Bio- analytical method development and validation of Valsartan by precipitation method with HPLC-MS/MS: Application to a pharmacokinetic study, J of Chem and Pharm Res., 2013; 5(7):7-20.
3. Lalit Kumar, M. Sreenivasa Reddy, Renuka S. Managuli, Girish Pai K., Full factorial design for optimization, development and validation of HPLC method to determine valsartan in nanoparticles, Saudi Pharm Journal, 2015; 23:549–555.
4. Prasad S. Virkar, Satish G. Pingale and Kiran V. Mangaonkar, Development and Validation of a High Performance Liquid Chromatography Method for Determination of Telmisartan in Rabbit Plasma and its Application to a Pharmacokinetic Study, J of Anal and Bioanal Techniques, 2012; 3:3.
5.Mustafa Çelebier, Mustafa Sinan Kaynak, Sacide Altınözo, Selma Şahin, Validated HPLC Method Development: The Simultaneous Analysis of Amlodipine and Valsartan in Samples for Liver Perfusion Studies, Hacettepe University Journal of the Faculty of Pharmacy, Volume 28 / Number 1 / January 2008 ; pp. 15-30.
6. Om Prakash Ranjan , Usha Y. Nayak ,Meka Sreenivasa Reddy, Swapnil J. Dengale ,Prashant B. Musmade , Nayanabhirama Udupa, Development and validation of RP-HPLC method with ultraviolet detection for estimation of montelukast in rabbit plasma: Application to preclinical pharmacokinetics, J of Young Pharmacists,2013; 5:133-138.