An Efficient Class of Estimators of Population Mean in
Two-Phase Sampling Using Two Auxiliary Variables
Lakhkar Khan
Department of Statistics
Quaid-i-Azam University, Islamabad, Pakistan [email protected]
Javid Shabbir
Department of Statistics
Quaid-i-Azam University, Islamabad, Pakistan [email protected]
Abstract
This study is devoted to obtaining an efficient estimator for population mean in two-phase sampling using two auxiliary variables following Vishwakarma and Kumar (2014). Expression for bias and mean squared error
MSE
are obtained to the first order of approximation. The new proposed estimator is compared with some competitor estimators both theoretically and numerically using eight different data sets. It has been shown that the new proposed estimator gives more efficient results as compared to its competitor estimators.Keywords: Two-phase sampling, Auxiliary variable, Bias, Mean squared error, Efficiency.
1. Introduction
In sample surveys, it is common practice to use the auxiliary information either at selection stage or on estimation stage, or at both stages, to improve precision of the estimators of the population means. Several methods of using the auxiliary variable at the estimation stage are described, which include linear regression estimator, ratio estimator and product estimator. According to Cochran (1940), ratio method of estimation is most preferred when the study variable is positively correlated with the auxiliary variable. Robson (1957) and Murthy (1964) proposed product method of estimation in case when there is negative correlation between the study variable and the auxiliary variable.
The chain regression type estimator was first introduced by Swain (1970). Chand (1975), Sukhatme and Chand (1977) and Kiregyera (1980) suggested some chain ratio and regression type estimators based on two auxiliary variables in two-phase sampling. Prasad et al. (1996), Singh and Espejo (2007), Singh and Choudhury (2012), Vishwakarma and Gangele (2014) and several authors have proposed some improved chain ratio, product and regression type estimators in two-phase sampling based on two auxiliary variables.
Following Vishwakarma and Kumar (2014), we suggest a class of estimators for the population mean in two-phase sampling using two auxiliary variables. It is shown that the proposed class of estimators outperforms as compared to the Vishwakarma and Kumar (2014) and several other competitors. Also, some special cases of the proposed class are considered in Table 2 (see Appendix).
2. Notations and some existing estimates
To obtain the bias and MSE of the estimators, we define:
1 0
,y Y e x X
1e1
, xX
1e1
,zZ
1e2
,Such that
0
1
1
2 0,E e E e E e E e and
2 20 1 y,
E e f C
2 21 1 x,
E e f C
2
21 1 1 2 x,
E e E e e f C
2
22 2 2 2 z,
E e E e e f C E e e
0 1 f1yxC Cy x, E e e
0 1 f2yxC Cy x,
0 2
2 yz y z,E e e f C C E e e
1 2 E e e
1 2 f2yzC Cy z.Where f1 1 1 ,
n N
2
1 1 , f n N
3
1 1 , f n n 2 2 2, y y S C Y 2 2 2, x x S C X 2 2 2, z z S C Z
yx yx ,
y x
S
S S
yz yz ,
y z
S
S S
xz ,
xz x z S S S
2 2 1 1 , 1 N y i iS y Y
N
2 2 1 1 , 1 N x i iS x X
N
2 2 1 1 , 1 N z i iS z Z
N
1
1
, 1
N
yx i i
i
S y Y x X
N
1
1 1
N
yz i i
i
S y Y z Z
N
and
1
1
. 1
N
xz i i
i
S x X z Z
N
The variance of the usual sample meany is given by
2 2 1 y.The usual chain type ratio estimator of Y under two-phase sampling scheme using two auxiliary variables x andz, is given by
,
d R
x Z
y y
x z
(2)
where x and z are the sample means based on the first-phase sample of sizen. Also y and x are the sample means based on the second phase sample of sizen.
The bias and MSE of yRd , up to the first degree of approximation, are given by
2 23 2 3 2 ,
d
R x z yx y x yz y z
Bias y Y f C f C f C C f C C (3) and
2 2 2 21 3 2 2 3 2 2 .
d
R y x z yx y x yz y z
MSE y Y f C f C f C f C C f C C (4)
The chain type product estimator of Y under two-phase sampling scheme using two auxiliary variables x and z, is given by
.
d P
x z
y y
x Z
(5)
The bias and MSE of d P
y , up to the first degree of approximation, are given by
3 2 ,d
P yx y x yz y z
Bias y Y f C C f C C (6)
and
2 2 2 21 3 2 2 3 2 2 .
d
P y x z yx y x yz y z
MSE y Y f C f C f C f C C f C C (7)
Singh and Choudhury (2012) suggested exponential chain type ratio estimator of Y under two-phase sampling scheme using two auxiliary variables x andz, is given by
Re exp .
d
x
Z x
z
y y
x
Z x
z
(8)
The bias and MSE of yRed , up to the first degree of approximation, are given by
2 2
Re 3 2 3 2
3 1
,
8 2
d
x z yx y x yz y z
Bias y Y f C f C f C C f C C
(9)
and
2 2
2 2
Re 1 3 2 3 2
1
. 4
d
y x z yx y x yz y z
MSE y Y f C f C f C f C C f C C
Singh and Choudhury (2012) suggested exponential chain type product estimator of Y under two-phase sampling scheme using two auxiliary variables x and z, is given by
e exp .
d P
x
x Z
z
y y
x
x Z
z
(11)
The bias and MSE of de P
y , up to the first degree of approximation, are given by
2 2
e 3 2 3 2
1 1
,
8 2
d
P x z yx y x yz y z
Bias y Y f C f C f C C f C C
(12)
and
2 2
2 2
e 1 3 2 3 2
1
. 4
d
P y x z yx y x yz y z
MSE y Y f C f C f C f C C f C C
(13)
Singh and Espejo (2007) suggested the ratio-product type estimator of Y under two-phase sampling scheme using single auxiliary variable x as
1
,d RP
x x
y y
x x
(14)
where is a real constant.
The minimum bias and MSE of d
RP
y at optimum value of i e. .
( )
1
1 ,
2
y
opt yx
x
C C
are given by
2 2 23 min
1
2 ,
2
d
RP x yx y x yx y
Bias y Yf C C C C (15)
and
2 2 2 21 3
min .
d
RP y yx y
MSE y Y f C f C (16)
Vishwakarma and Kumar (2014) suggested exponential chain ratio- product type estimator of Y under two-phase sampling scheme using two auxiliary variables x and
z, is given by
e exp 1 exp ,
d RP
x x
Z x x Z
z z
y y
x x
Z x x Z
z z
(17)
The minimum bias and MSE of d RPe
y at optimum value of i e. .
2 2
3 2
( ) 2 2
3 2
2 2
, 2
x yx y x z yz y z opt
x z
f C C C f C C C
f C f C
are given by
2 2
2 2 2
3 2 3 2 3 2
2 2 min 3 2 2 12 , 8
x z y yx x yz z y yx x yz z
d RPe
x z
f C f C C f C f C C f C f C
Bias y Y
f C f C
(18) and
2 2
3
2
21 2 2
min
3 2
.
yx y x yz y z d
RPe y
x z
f C C f C C
MSE y Y f C
f C f C
(19)
3. Proposed class of estimators
Following Vishwakarma and Kumar (2014), we propose a class of estimators of the population mean Y under two-phase sampling scheme using two auxiliary variables x and z, is given by
1
2exp
1 2
exp ,d M
x x
Z x x Z
z z
y y x x
x x
Z x x Z
z z (20)
where 1 and 2are constants, whose values are to be determined. The proposed estimator yMd can be written in terms of e s as
2 2 2 2 2 2
2
0 1 2 1 2 1 2 1 0 1 0 2 0 1 1 1 2
2 2 2
1 2 1 1 2 1 1 1 2 1 2 1 0 1 0 2 0 1
2 2 2
1 1 1 1 1 1 1 1 2 1 2 2 1 1
1 2 8 1 1 4 2 1 2 2 d M
e e e e e e e e e e e e e e e e
y Y Y
e e e e e e e e e e e e e e e e e e
X e e e e e e e e e e e e
2
1 1 1 2 1
2e e e e e e .(21)
Taking the expectation of both sides of the above equation, we get bias of d M
y , is given by
2 2 2 2
3 2 3 2
2 2
1 3 2
4 1 2 1
8 2
2 1
2 .
2
d
M x z yx y x yz y z
x yz y z
Bias y Y f C f C f C C f C C
X f C f C C
(22)
2
2 2 2 2 2 2 2
0 1 2 1 1 1 1 2 1 2 2 0 1 0 2 0 1
2
2 2 2 2 2 2
1 1 1 1 1 1 0 1 0 1 1 1 1 1 1 2 1 2
2 1
2 2 2 2 1
2
2 1
2 2 2 .
2
d M
y Y Y e e e e e e e e e e e e e e e e
X e e e e XY e e e e e e e e e e e e
Taking the expectation of both sides of the above equation, we obtain the MSE of d M
y , as
2 2
2 2 2 2
1 3 2 2 3 2
2
2 2 2 2
1 3 1 3 3
2 1
2 1
4
2 1
2 .
2
d
M y x z yx y x yz y z
x yx y x x
MSE y Y f C f C f C f C C f C C
X f C XY f C C f C
(23)
From Eq (23), the optimum values of 1and 2 are given by
2 2
1( ) 2 2
z yx y x x yz y z opt
x z
Y C C C C C C
XC C
and 2( ) 2 .
2
yz y z opt
z
C C
C
The minimum bias and MSE ofyMd , up to the first degree of approximation, are given by
2 2
2 2
2
3 2 2
2
min 8 4 8 16 ,
d
M x z z yz y z yz y y z xz z yx x yz
z Y
Bias y f C f C C C C C f C C C C
C
(24)
and
2 2 2 21 2 3
min .
d
M y yz yx
MSE y Y C f f f (25)
4. Efficiency comparison
We have obtained the conditions under which the proposed class of estimators is more efficient than its competitor estimators.
(i). By Eq (1) and Eq (25)
min ,
d M
MSE y Var y if
2 2
2 yz 3 yx 0.
f f
(ii). By Eq (4) and Eq (25)
d min
d ,M R
MSE y MSE y if
2
22 yz y z 3 yx y x 0.
f C C f C C
(iii). By Eq (7) and Eq (25)
Md min
Pd ,
2
22 yz y z 3 yx y x 0.
f C C f C C
(iv). By Eq (10) and Eq (25)
min
Re ,d d
M
MSE y MSE y if
2
22 2 yz y z 3 2 yx y x 0.
f C C f C C
(v). By Eq (13) and Eq (25)
min
e ,d d
M P
MSE y MSE y if
2
22 2 yz y z 3 2 yx y x 0.
f C C f C C
(Vi). By Eq (16) and Eq (25)
min
R min,d d
M P
MSE y MSE y if
2 2 yz 0.
f
(vii). By Eq (19) and Eq (25)
min
R min,d d
M Pe
MSE y MSE y if
20.
yzCx yxCz
Note: All above conditions are obviously true.
5. Empirical study
We have taken eight natural populations for numerical study.
Population 1 (source: Cochran (2007))
:
y Number of placebo children, :
x Number of paralytic polio cases in the placebo group, :
z Number of paralytic polio cases in the not inoculated group.
Population 2 (source: Murthy (1967))
:
y Area under wheat in 1964, :x Area under wheat in 1963, :z Cultivated area in 1961.
34
N n15 n 10
4.92
Y X 2.59 Z 2.91
0.9801
yx
yz 0.9043 xz 0.6837
2
1.0248
y
C Cx2 1.5175
2
1.1492
z
34
N n10 n 7
199.44
Y X 208.89 Z 747.59
0.9801
yx
yz 0.9043 xz 0.9097
2
0.5673
y
C Cx2 0.5191
2
0.3527
z
C
Population 3 (source: Anderson (1958))
:
y Head length of second son, :
x Head length of first son, :
z Head breadth of first son.
25
N n10 n 7
183.84
Y X 185.72 Z 151.12
0.7168
yx
yz 0.6932 xz 0.7346
2
0.0546
y
C Cx2 0.0526 2
0.0488
z
C
Population 4 (source: Singh (1967))
:
y Number of females employed,
:
x Number of females in service, :
z Number of educated females.
61
N n20 n 10
7.46
Y X 5.31 Z 179
0.7373
yx
yz 0.2070 xz 0.0033
2
0.7103
y
C Cx2 0.7587 Cz2 0.2515
Population 5 (source: Murthy (1967))
:
y Output, :
x Number of workers, :
z Fixed capital.
80
N n25 n 10
5782.638
Y X 283.875 Z1126.00
0.9136
yx
yz 0.9413 xz 0.9859
2
0.3520
y
C Cx2 0.9430 Cz2 0.7460
Population 6 (source: Sukhatme and Chand (1977))
:
y Apple trees of bearing age in 1964, :
x Bushels of apple harvested in 1964, :
200
N n30 n 20
1031.82
Y X 2934.58 Z 3651.49
0.93
yx
yz 0.77 xz 0.84
2
2.5528
y
C Cx2 4.0250
2
2.9379
z
C
Population 7 (source: Srivastava et al. (1989))
:
y The measurement of weight of children, :
x Mid arm circumference of children, :
z Skull circumference of children.
82
N n43 n 25
5.60
Y X 11.90 Z 39.80
0.09
yx
yz 0.12 xz 0.86
2
0.0107
y
C Cx2 0.0052 2
0.0008
z
C
Population 8 (source: Srivastava et al. (1989))
:
y The measurement of weight of children, :
x Mid arm circumference of children, :
z Skull circumference of children.
55
N n30 n 18
17.08
Y X 16.92 Z 50.44
0.54
yx
yz 0.51 xz 0.08
2 0.0161
y
C Cx2 0.0049 Cz2 0.0007
We obtain the percent relative efficiency (PRE) of ratio estimator yRd ˆ1 (say), the product estimator yPd ˆ2, exponential chain type ratio estimator yRed ˆ3, exponential chain type product estimator yPed ˆ4, Singh and Espejo (2007) ratio-product type estimator yRPd ˆ5, Vishwakarma and Kumar (2014) exponential chain ratio-product type estimator yRPed ˆ6 and proposed estimator
7
ˆ
d M
y with respect to conventional estimator y ˆ0(say). We use the following expression for comparison.
00
ˆ
ˆ ˆ, 100,
ˆ
j
j
MSE PRE
MSE
j1, 2,..., 7. (26)
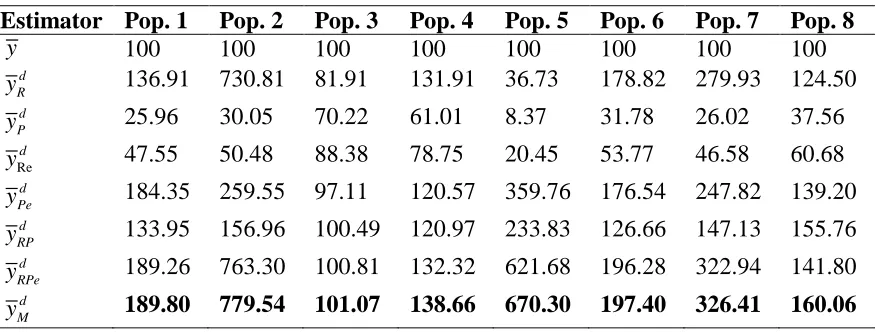
Table 1: Percentage Relative Efficiencies (PREs) of different estimators with respect toy
Estimator Pop. 1 Pop. 2 Pop. 3 Pop. 4 Pop. 5 Pop. 6 Pop. 7 Pop. 8
y 100 100 100 100 100 100 100 100
d R
y 136.91 730.81 81.91 131.91 36.73 178.82 279.93 124.50
d P
y 25.96 30.05 70.22 61.01 8.37 31.78 26.02 37.56
Re
d
y 47.55 50.48 88.38 78.75 20.45 53.77 46.58 60.68
d Pe
y 184.35 259.55 97.11 120.57 359.76 176.54 247.82 139.20
d RP
y 133.95 156.96 100.49 120.97 233.83 126.66 147.13 155.76
d RPe
y 189.26 763.30 100.81 132.32 621.68 196.28 322.94 141.80
d M
y 189.80 779.54 101.07 138.66 670.30 197.40 326.41 160.06
6. Conclusion
In this paper, we have proposed a class of estimators in two-phase sampling using two auxiliary variables. The bias and mean squared error
MSE
are obtained up to the first order of approximation. Theoretically, it has been shown that the proposed estimator is more efficient than the conventional estimator y, two-phase ratio estimator dR
y ,
two-phase product estimator d RP
y , exponential chain type ratio estimator Red
y , exponential
chain type product estimator d Pe
y , Singh and Espejo (2007) ratio-product type estimator
d RP
y , Vishwakarma and Kumar (2014) exponential chain ratio-product type estimator
d RPe
y . The numerical results clearly show that the proposed estimator yMd performs much better than Vishwakarma and Kumar (2014) and all other competitor estimators. Also,
d P
y and Red
y show the poor performances in all data sets.
Acknowledgments
The authors are thankful to the editor and the anonymous referees for their valuable suggestions which helped to improve the research paper.
References
1. Anderson, T. W. (1958). An Introduction to Multivariate Statistical Analysis. John Wiley and Sons: New York.
2. Chand, L. (1975). Some Ratio Type Estimators Based on Two or More Auxiliary
Variables. Unpublished Ph.D thesis, Iowa State University, America, Iowa (USA).
3. Cochran, W. (1940). The estimation of the yields of cereal experiments by sampling for the ratio of grain to total produce. The Journal of Agricultural Science, 30(02):262-275.
5. Hidiroglou, M. and Sarndal, C.-E. (1998). Use of auxiliary information for two-phase sampling. Survey Methodology, 24:11-20.
6. Kiregyera, B. (1980). A chain ratio-type estimator in finite population double sampling using two auxiliary variables. Metrika, 27(1):217-223.
7. Murthy, M. N. (1964). Product method of estimation. Sankhya, The Indian Journal of Statistics, Series A, 26: 69-74.
8. Murthy, M. N. (1967). Sampling Theory and Methods. Statistical Publishing Society: Calcutta, India.
9. Prasad, B., Singh, R., and Singh, H. (1996). Some chain ratio-type estimators for ratio of two population means using two auxiliary characters in two phase sampling. Metron, 54(1-2):95-113.
10. Robson, D. S. (1957). Applications of multivariate polykays to the theory of unbiased ratio-type estimation. Journal of the American Statistical Association, 52(280):511-522.
11. Sahoo, L., Mishra, G., and Nayak, S. (2010). On two different classes of estimators in two-phase sampling using multi-auxiliary variables. Model Assisted Statistics and Applications, 5(1):61-68.
12. Singh, B. and Choudhury, S. (2012). Exponential chain ratio and product type estimators for finite population mean under double sampling scheme. Global Journal of Science Frontier Research, 12(6):13-24.
13. Singh, H. P. and Espejo, M. R. (2007). Double sampling ratio-product estimator of a finite population mean in sample surveys. Journal of Applied Statistics, 34(1):71-85.
14. Singh, H. P. and Vishwakarma, G. K. (2007). Modified exponential ratio and product estimators for finite population mean in double sampling. Austrian Journal of Statistics, 36(3):217-225.
15. Singh, M. P. (1967). Ratio-cum-product method of estimation. Metrika, 12:34-42. 16. Srivnstava, R. S., Srivastava, S. and Khare, B. (1989). Chain ratio type estimator
for ratio of two population means using auxiliary characters. Communications in Statistics-Theory and Methods, 18(10):3917-3926.
17. Sukhatme, B. & Chand, L. (1977). Multivariate ratio type estimator. Proceedings, Social Statistic Section, American Statistical Association, 927-931.
18. Sukhatme, B. V. (1962). Some ratio-type estimators in two-phase sampling. Journal of the American Statistical Association, 57(299):628-632.
19. Swain, A. K. (1970). A note on the use of multiple auxiliary variables in sample surveys. Trabajos de estadistica y de investigacion operativa, 21(3):135-141. 20. Vishwakarma, G. K. and Gangele, R. K. (2014). A class of chain ratio-type
exponential estimators in double sampling using two auxiliary variates. Applied Mathematics and Computation, 227:171-175.
Appendix
Table 2: Some special cases of the proposed class of estimators
1
2 Estimator Remarks
0 exp 1 exp
d RPe
x x
Z x x Z
z z
y y
x x
Z x x Z
z z
Vishwakarma and Kumar (2014 ) estimator
0 0
exp d Pe x x Z z y y x x Z z
Singh and Choudhury (2012) product estimator
0 1
exp d Re x Z x z y y x Z x z
Singh and Choudhury (2012) ratio estimator
d 0
exp
x
x Z
z y d x x
x x Z z
Regression exponential type product estimator
d 1
exp
x Z x z y d x x
x Z x z
Regression exponential type ratio estimator
From Eq (25), we get
2 2 2 21 2 3
min
d
M y yz yx
MSE y Y C f f f
2 2 2 2 2 21 3 2
min
d
M y yx y yz
MSE y Y C f f Y C f
2 2 22
min min
d d
M RP y yz
MSE y MSE y Y C f
Since, Y C f2 y2 2yz2 is a positive quantity, therefore
d min
d minM RP
MSE y MSE y
Comparison (vi): By Eq (16) and Eq (25)
Md min
RPd min,MSE y MSE y if
2 2 2 2 2 2 2 2
1 2 3 1 3
y yz yx y yx y
Y C f f f Y f C f C
2 2 2 2 2 2 2
1 2 3 1 3 0
y yz yx y yx
Y C f f f Y C f f 2
2 yz 0
f
or f2yz2 0