A novel framework for retrieval and interactive visualization of
multimodal data
Ilias Kalamaras∗,+, Athanasios Mademlis+, Sotiris Malassiotis+and Dimitrios Tzovaras+
∗Department of Electrical and Electronic Engineering, Imperial College London, SW7 2AZ, London, UK +Information Technologies Institute, Centre for Research and Technology Hellas, Thessaloniki, Greece
Received 22th Oct 2012; accepted 4th Mar 2013
Abstract
With the abundance of multimedia in web databases and the increasing user need for content of many modalities, such as images, sounds, etc., new methods for retrieval and visualization of multimodal media are required. In this paper, novel techniques for retrieval and visualization of multimodal data, i.e. docu-ments consisting of many modalities, are proposed. A novel cross-modal retrieval framework is presented, in which the results of several unimodal retrieval systems are fused into a single multimodal list by the intro-duction of a cross-modal distance. For the presentation of the retrieved results, a multimodal visualization framework is also proposed, which extends existing unimodal similarity-based visualization methods for multimodal data. The similarity measure between two multimodal objects is defined as the weighted sum of unimodal similarities, with the weights determined via an interactive user feedback scheme. Experimental results show that the cross-modal framework outperforms unimodal and other multimodal approaches while the visualization framework enhances existing visualization methods by efficiently exploiting multimodality and user feedback.
Key Words: Multimodal Search, Multimodal Visualization, Intelligent User Interfaces, Human-Computer Interaction.
1
Introduction
The rapid increase in the amounts of multimedia (images, sounds, videos, 3D objects etc.) in Internet databases has given rise to the problem of multimedia search and retrieval. Current retrieval systems, such as text-based and content-text-based search engines, areunimodal, because they can only handle one media type (so called
modality), e.g. only text keywords or only images. Amultimodalsearch engine is a multimedia search engine in which the query and the retrieved results can be of any modality. Multimodal search engines cover a broader information need than unimodal ones, as they enable users to retrieve information of many kinds.
Apart from the task of retrieval, another significant issue in search engines is the user friendly representation of the results. The traditional presentation as an one-dimensional ranked list of results is often inadequate, especially for multimedia data, as it simultaneously fails to show many results or any relations between them,
Correspondence to:<[email protected]>
Recommended for acceptance by<Angel Sappa>
ELCVIA ISSN: 1577-5097
and as it is time-consuming to sequentially search all results for those that are indeed relevant for the user. Other kinds of presentation are more intuitive, placing semantically similar results closer on the screen.
The challenge in multimodal search engines lies in combining the available modalities in order to accomplish more intuitive retrievals and visualizations. Several attempts have already been proposed in the literature to fuse multiple modalities for these tasks. Most approaches are based on the concept of amultimodal object[1][2], which is a collection of multimedia items of various modalities sharing the same semantic concept. Fusion of the various modalities generally ranges from early fusion to late fusion. Inearly fusionmethods, fusion is performed by combining the low-level features of the multimedia and then using the fused features for further processing. On the other hand, inlate fusionmethods, individual unimodal learning methods are first used in each modality separately and their high-level results and decisions are then fused.
The problem of retrieval in multimodal databases has been mainly addressed by projecting the objects to a common multimodal space, in which distance metrics are defined and used to retrieve the nearest neighbors of a query object. In this context, adjacency graphs among the objects have been used to calculate this common space [3] [2]. The adjacency between multimodal objects is defined in terms of the adjacency of their unimodal contents and then manifold learning methods are used to project the objects to a common space (hybrid of early and late fusion). A different approach is adopted in [4], where statistical methods, including Canonical Cor-relation Analysis (CCA), Principal Component Analysis (PCA) and Independent Component Analysis (ICA), are used to find a common space for projecting items of different modalities based on correlation maximization (early fusion). However, a disadvantage of methods that project multimodal objects to a common space is that they need to be trained with the use of a training dataset. Apart from the computational cost of training, this also results in these methods having difficulty in handling queries that do not belong to the training database.
As far as visualization is concerned, the authors of [5] provide a review of some of the existing visualization methods for video retrieval systems. When multiple modalities are considered, the visualizations aim at offering multiple ranked lists of results, with respect to the multiple modalities. Methods are also reported that perform a spatial organization of the results, so that clusters of similar ones are visible; however they only consider one modality. Most spatial organization methods of the literature, such as Multidimensional Scaling [6] and Self-Organizing Maps [7], are also unimodal. However, such methods usually rely on the definition of a distance metric between data points, so attempts to define distances or similarities between whole multimodal objects have been reported. In [8] and [9], Multiple Kernel Learning is used to combine similarity information at different modalities in a single multimodal kernel matrix, thus to define a multimodal similarity metric, while in [10], a similar technique is used for dimensionality reduction. This combination usually implies that some modalities are more important than others for visualization. In [11], the most independent and less redundant modalities are found automatically. User interaction can also be employed to address the same problem. While in most retrieval systems, such as the ones in [5], user feedback is mainly employed for retrieving more precise results (relevance feedback), in [12] and [13], user interaction is used to find the most important modalities. Such user supervision has also been used in [14] and [15] for clustering and dimensionality reduction.
In this paper, a framework for multimodal retrieval and visualization is proposed. For retrieval, a novel cross-modal late fusion approach is developed, where the results of many unimodal search sessions are merged in a multimodal retrieval list, based on the definition of a cross-modal similarity measure and using objects that contain more than one modalities. This framework can use existing efficient unimodal search engines, without the need for training, and can thus outperform existing early fusion methods in realistic search sessions. For visualization, a multimodal similarity measure is defined between multimodal objects, as a weighted sum of unimodal similarities, and then used with unimodal visualization methods, in a hybrid fusion scheme. While most existing weighted-sum-based visualization methods use training data to learn the weights of the sum, hereby the weights are adjusted through user feedback. The current paper forms an extension of the work initially presented in [16], including a more thorough explanation of the cross-modal retrieval method, as well as additional experiments for retrieval, performed on an artificial dataset. The rest of this paper is organized as follows: The multimodal retrieval and visualization frameworks are covered in Sections 2 and 3 respectively. In Section 4, experimental evaluation of the two frameworks is presented and Section 5 concludes the paper.
2
Multimodal retrieval framework
The proposed multimodal retrieval framework works by merging the results of several hierarchical retrieval ses-sions into one multimodal retrieval list. After some essential preliminary definitions, the proposed framework is presented hereafter in detail.
2.1 Preliminary definitions
A multimodal databaseΩis considered, consisting ofN multimodal objectsoi∈Ω,i= 1. . . N. Each object oi is considered as a bag containing multimedia items of different modalities (it could also contain just one media item). A multimedia item of modalitymbelonging to objectoi is denoted asomi , wherem = 1. . . M andM is the total number of modalities considered. A functionDm(omi , omj ) :→R+ is associated with each modality, expressing the dissimilarity (or distance) between two media itemsom
i andomj of modalitym. For the calculation of this distance, feature vectors (so calleddescriptors) extracted from the media items are used. Next, the following definitions are considered: Ωmis the set of objects that are represented in modalitym (i.e. they contain a media item of modalitym). The setWmn is the set of objects that are expressed in both them-th andn-th modalities, i.e. Wmn = ΩmTΩn. Finally,Wm =SnWmnis the set of objects containing modalitymwhich contain more than one modalities. In order for the proposed multimodal retrieval framework to work, the modalities have to berelated, i.e. at least some objects have to contain more than one modalities. The ideal situation is when all pairs of modalities are related, i.e. Wmn 6= ∅,∀m, n, m 6= n, however the framework also works in case whereWmn=∅if∃k:Wmk6=∅and Wnk 6=∅, that is, two modalitiesmand ncan be directly unrelated, if there is another modalitykwhich is directly related to bothmandnmodalities. The probability that an object containing modalitymalso contains items of other modalities ispm = NN((ΩWmm)), whereN(A)is the cardinality of a setA, and for the framework to work, it should bepm >0.
Overall, it is assumed that a unimodal feature space exists for each modality, on which a proper distance met-ric is defined. Existing unimodal retrieval systems already fulfill this assumption. Furthermore, it is assumed that at least some of the database’s objects are represented in more than one modalities, so that high-level relations between modalities can be inferred.
2.2 Cross-modal retrieval
The proposed retrieval framework works as follows: A search session is initiated by a query submitted by the user. The query is supposed to be a media item of a specific modalitym(e.g. an image, a sound, etc.) and is denoted byqm. Then a unimodal search and retrieval process is performed for modalitym, i.e. the search is performed in the subsetΩm, by considering just the items of modalitym. The result is a list ofKobjects,ok, k= 1. . . K,ok∈Ωm, which contain at least one item of modalitym, along with the distances of these items from the query,Dm(qm, omk)(with respect to modalitym).
The assumptions about the modality relations, described in section 2.1, state that there is a high probability that some of the objects in this retrieval list are represented in more than one modalities. Letotbe the most similar object to the query that is represented in more than one modalities. That is, this object is represented in modalitymand at least in some other modalityn(withomt andont being the respective representations). Then another unimodal retrieval session is performed, this time for modalityn, with the itemont as the query. The result is another list ofK objects ok, k = 1. . . K,ok ∈ Ωn, along with the distances of theirn-th modality items from the new query,Dn(ont, onk).
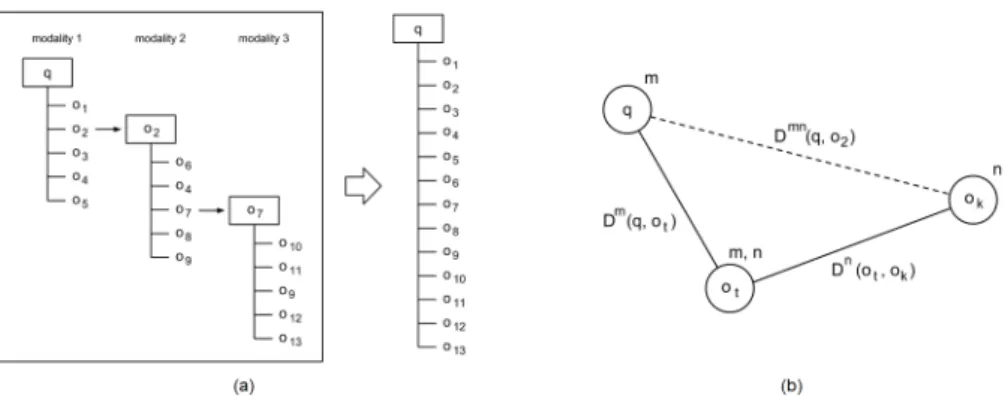
This process is repeated in a third modality etc., resulting in a hierarchical retrieval tree, as shown in Figure 1a. For efficiency reasons, only the firstL,L ≤ K, results of each unimodal retrieval list are examined for modality relations. L can be a predefined constant, or it can be specified using a threshold to the results’ distances. The probability that at least one of the firstLresults is represented in more than one modalities, i.e. p=P r{∃k, k≤L|omk ∈Wm}, isp= 1−(1−pm)L, so the higher the value ofL, the higher this probability.
Figure 1: The proposed retrieval framework. (a) A hierarchical retrieval tree is created and the results are merged in a single multimodal retrieval list. (b) Estimating the cross-modal distance using an intermediate multimodal object.
The results of this hierarchical retrieval tree are finally merged in a single ranked list under the initial query (see Figure 1a). In order for this merging to be achieved, however, a proper distance metric between the initial query and each of the results must be defined. The problem is that there is no direct measure of distance between items of different modalities. For this reason, a cross-modal distance metric is introduced, which estimates the distance between two items of different modalities, by utilizing the modality relations.
Considering the queryqm (of modalitym) and a retrieved object consisting of a media item of modalityn, onk, the goal is to define a cross-modal distance measure,Dmn(qm, onk), betweenqm andonk. An intermediate object ot is used, which contains media items of both modalities (such objects are the ones that are used as successive queries in the hierarchical retrieval tree). The distanceDm(qm, omt ), as well as the distance Dn(ont, onk), are unimodal distances between items of the same modality and thus can be calculated. This setting can be represented as the triangle in Figure 1b.
The proposed cross-modal distance estimation is based on the triangle inequality, which states the follow-ing (for less clutter,Dm(qm, omt ),Dn(ont, onk)andDmn(qm, onk) have been simplified asDm,DnandDmn, respectively):
|Dm−µDn| ≤Dmn≤Dm+µDn,
thus setting limits for the value of the cross-modal distance. Here parameterµhas been introduced to com-pensate for different kinds of distance functions, i.e. to make distances of different feature spaces compatible. In order to force the cross-modal distance to be between the aforementioned limits, the following estimation is introduced:
Dmn= 1 2(|D
m−µDn|+Dm+µDn) (1)
The estimation of Equation (1) introduces an error, whose maximum value isemax = min{Dm, µDn}
(see Appendix A). In order to minimize this error, the distance Dm(qm, omt ) must be minimized, i.e. the intermediate objectotshould be the most similar one to the query, of all the available multimodal objects.
The error can be further minimized if more than one intermediate objects,otr,r = 1. . . T, are used. Then,
the cross-modal distance estimation is as follows: Dmn(qm, onk) = 1 2 max r Dm(qm, omt r)−µD n(on tr, o n k) + min r Dm(qm, omtr) +µDn(ontr, onk) (2) Determining parameterµin Equations (1) and (2) requires knowledge of the specific feature spaces of each modality and of the distance metrics used in them, which is generally not a trivial process. In order to gain independence from the specific characteristics of each unimodal feature space, instead of using the separate distance metrics, the position (rank) of an item in a unimodal retrieval list could be used as a normalized distance. Thus, the first result is assigned a zero distance value (absolutely similar), the last one is assigned the value 1 (absolutely dissimilar), and the rest of the results are assigned values in the interval(0,1), according to
some monotonically increasing functionG. The normalized distance between a queryqm and some objectom k is then
˜
Dm(qm, omk) =G(rank(omk)) (3) In caseGis common for all modalities,µis set to 1, gaining thus independence from the characteristics of each unimodal space. This independence allows the framework to use existing and efficient unimodal retrieval systems, without having to access their internals. This also allows the framework to be implemented as a modular or decentralized system, where the unimodal subsystems can be easily modified or replaced by more efficient ones.
The above described framework can only handle unimodal queries. However, multimodal queries could be integrated in the proposed method, if e.g. their multiple modalities were used as separate unimodal queries, with the resulting retrieval lists being further merged. Such a modification is a direction for future research.
3
Multimodal visualization framework
The retrieval framework of Section 2 results in a list of multimodal objects, which will be visualized on the computer screen. Along with the actual results, their distances from the query (normalized or not) are also available. However, a distance-based visualization system needs the distances or similarities between every pair of objects in the set to be visualized. The estimation of all these similarities is however not time-consuming, since only the top retrieved results are used. The approach described here extends unimodal methods by defining a multimodal similarity between whole multimodal objects.
A setO ofN multimodal objects, oi ∈ O, i = 1. . . N, is considered, consisting of theN top retrieved results. Each objectoicontainsMmultimedia items, denoted asomi ,m= 1. . . M, whereM is the number of modalities. For ease of presentation, each object here is assumed to consist of exactlyM multimedia items, all of different modalities. However, the framework can also apply to more general settings.
For each modality m, there is an associated similarity function Sm(omi , omj ) :→ [0,1], which calculates the similarity between two multimedia items of modalitym. Similarities are used here instead of distances, as in the retrieval framework, taking values from 0 (totally dissimilar) to 1 (totally similar). Similarities can be calculated from distances using e.g. some heat kernel: S = e−aD. This can be applied directly if the actual distance metrics of the unimodal spaces are known; however, if normalized distances are used, unimodal retrievals have first to be performed in the small database ofN objects, using each object subsequently as a query.
3.1 Multimodal similarity
Many existing visualization approaches (such as clustering or dimensionality reduction ones) use the distances or similarities among the objects as their input. If a similarity measure between two multimodal objects is defined, which uses information from all modalities, then such a measure could be used with any existing similarity-based visualization method. Here a multimodal similarity is defined between two multimodal ob-jects as a weighted sum of the unimodal similarities of their constituting media items. This approach lies between early and late fusion, since some processing of the raw modality features (the calculation of unimodal similarities) is performed before fusion occurs.
Each modalitymis assigned a weightwm,m = 1. . . M, which shows how important this modality is for the determination of the total similarity between two objects. For instance, if the sounds contained in a set of objects are ambiguous, then more weight could be given to the image modality, so that the visualization relies more on the images rather than the sounds. The multimodal similarity function,S :O×O→[0,1], between two objectsoiandoj is then defined as
S(oi, oj) = M
X
m=1
wherewm ≥0,PM
m=1wm = 1. Using a weighted sum is a common approach for fusing data from different
modalities and is related to multi-view techniques such as Multiple Kernel Learning (see e.g. [10]).
Using this weighted sum, similarities can be calculated between every pair of objects and be given as input in any similarity-based visualization method, such as those of Section 3.3.
3.2 User feedback
A common approach to bridge the semantic gap between the low-level media descriptors and the high-level semantics of the data is receiving feedback from the user. In the proposed visualization method, user feedback is utilized to tune the weights of the multimodal similarity function (Equation (4)).
Incorporation of user feedback is achieved as follows: Initially, the weights are given arbitrary values, for examplewm = 1/M,∀m. Using these weights, similarities between every pair of objects are calculated, with Equation (4), and some visualization method is performed. Since the selection of the weights is arbitrary, the presented result may not be sufficient for the user and the visualization may have favored a modality which is not so important for the user. The system allows users to denote possible mistakes, by allowing the formation of pairs of objects,{oi, oj}, that could be placed closer in the visualization.
The system then makes the assumption that the most important modality for the user (denoted asm0) is the
one, for which the two objects of the pair achieve the maximum similarity score:m0 = arg maxmSm(omi , omj ). Then, the weights of the modalities are updated by slightly increasing the weight ofm0 and accordingly
de-creasing the weights of the other modalities: wnewm =
woldm +c(1−wmold) ifm=m0
wm
old−cwmold ifm6=m0 (5)
wherecis a constant determining the amount of the adjustment, taking values in the[0,1]interval. Limitingc in this interval ensures thatwnewm ∈[0,1], m= 1. . . M andPM
m=1wmnew= 1.
After the weight adjustment, multimodal similarities are recalculated among the objects and a new visualiza-tion is presented, which is hopefully better for the user. The user can subsequently provide more pairs of objects to further adjust the visualization. Further, such feedback could also be collected from many users through a collaboration scheme and used when similar queries are submitted by other users.
3.3 Visualization approaches using the proposed method
Once multimodal similarities have been estimated among the objects, a similarity-based visualization method is applied to present them to the user. Two such methods have been utilized within the proposed framework. The first one, force-directed maximum spanning tree (MST-FD), takes as input a set of objects and the similarities among each pair of them and forms a complete graph, having the objects as its vertices. There are edges between every pair of vertices, weighted by the similarity value between the respective pair of objects. Then the maximum spanning tree of this graph is calculated. The maximum spanning tree has the property that similar objects are connected by few edges on the tree (see also [17]). In order to visualize the tree on the two-dimensional screen, the vertices are initially placed in random locations and then a force-directed graph placement algorithm [18] is applied.
The second one usesself-organizing maps (SOM). The Self-Organizing Map (SOM, [7]) is a non-linear method for projecting a high-dimensional dataset on a two-dimensional grid (the map). Each of the grid’s cells is assigned a high-dimensional model, which is a representative of some local area of the high-dimensional input data. After an iterative updating process, the models are tuned to the high-dimensional data so that models that are close on the map represent data areas that are close in the original high-dimensional space (for details, see [7]). In this paper, a modification of the original SOM is used, proposed in [19], which uses distances (or similarities) between data as inputs.
4
Experimental evaluation
4.1 Evaluation of the retrieval framework
The performance of the proposed cross-modal retrieval framework has been evaluated in a number of experi-ments. For the experiments, two datasets were used, an artificial one and a realistic one.
4.1.1 Artificial dataset
As a first experiment, multimodal objects were artificially generated, by the following process: The total num-ber of modalities isM. Each of the database’s object is considered to belong in one ofNc classes. Then a random number of objects is generated for each class and each object contains items of random modalities. Each item is essentially a feature vector, lying in a feature space, specific for each modality. For every class and every modality, the class center in the respective feature space is randomly selected. Finally, the feature vectors for each object in every modality are normally distributed around the class center, using the distances between class centers as standard deviation, so that there is an overlap of the classes.
The selected measure for the evaluation of the framework’s retrieval performance is the Cumulative Gain Diagram. Given a query and the firstpretrieved results, the Cumulative Gain is defined asCGp =
Pp
i=1reli, wherereli is the relevance of the result at positioni. Relevance takes values from 0 (irrelevant) up to some positive value denoting total relevance (e.g. 1). The Cumulative Gain Diagram depicts the value of the Cu-mulative Gain for different numbers of retrieved results. The larger the area under the CuCu-mulative Gain curve, the better the retrieval performance. All diagrams presented below show the average Cumulative Gains, after using each object of the database as a query. Cumulative Gain Diagrams are similar to the frequently-used Precision-Recall diagrams, but also contain quantitative information of the results’ relevance, not just a binary distinction of them as relevant or not.
Retrieval sessions have been performed with the artificial dataset, usingM = 2,4andNc= 4,8, while the corresponding Cumulative Gain Diagrams are shown in Figure 2a. The proposed cross-modal approach (using both the initial and the normalized distances) is compared to unimodal retrievals, which use each modality separately, and to the multimodal approach of [3], which uses a Multimedia Correlation Space (MMCS). For the calculation of the estimated normalized distances, theGfunction of Equation (3) is selected to be linear, G= Nx
t, wherexis the result’s position in the ranked list andNtis the total number of results.
As shown in Figure 2a, when the size of the database is small (4 classes), the performance of the proposed method, using the original features and distances, is comparable to the MMCS approach. Both methods are also comparable to the unimodal retrievals; however, they overall manage to retrieve much larger number of results, due to the results coming from many modalities. However, when the size of the database is large (8 classes), the proposed method (initial distances) is significantly better than the MMCS approach and the unimodal ones. Nevertheless, in every case, the proposed method, when using estimated distances, outperforms all other methods, showing that normalizing the distances and gaining independence from the specific unimodal characteristics is beneficial for retrieval.
4.1.2 Realistic dataset
The proposed method has also been tested with a realistic dataset. In the literature about multimodal retrieval, there is a lack of a standard multimodal database, on which experiments can be performed and different retrieval methods be compared. The datasets used are different in each paper. In [2], the dataset was compiled by the authors and consisted of images and 3D models. In [3], data originated from an Internet multimedia database and consisted of images, audio clips and text. Finally, in [1] and [4], image galleries enhanced with text and audio clips were used. Since there is no standard multimodal database, a handcrafted dataset has been used in the current paper as well. Only few of the multimodal datasets in the literature use 3D models as modalities, hence, a dataset consisting of images and 3D models has been used in the current paper, in order to explore
Figure 2: (a) Cumulative Gain diagrams for the artificial database. Results are shown for 2 and 4 modalities and for 4 and 8 generated classes. (b) Cumulative Gain diagrams for the ITI database, using the Spherical Harmonics Descriptor and 3D Krawtchouk Moments as 3D descriptors (Modality 1), and the Polar Fourier Descriptor and 2D Krawtchouk Moments as image descriptors (Modality 2).
the co-existence of these two modalities. The dataset consists of the 544 3D objects of the ITI database [20], enhanced with five 2D screenshots for each of them. The Spherical Harmonics Descriptor [21] and the 3D Krawtchouk Moments [22] have been used as feature vectors for the 3D models. For the description of the 2D images, the Polar Fourier Descriptor [23] and the 2D Krawtchouk Moments [24] have been used.
The Cumulative Gain Diagram has again been used as the evaluation measure and Figure 2b shows the diagrams created for each combination of 2D and 3D features. Comparisons are also shown to the unimodal and the MMCS approaches. In this realistic setting, the cross-modal approach, especially when using the estimated distances, outperforms the unimodal 3D retrieval and the MMCS approach; however it does not perform better than the 2D unimodal retrieval, although it manages to follow its performance very closely. This is due to the superior retrieval accuracy caused by the highly discriminative image features used, and due to the unavoidable possible introduction of less relevant 3D objects by the cross-modal approach. Due to this last fact however, the cross-modal methods manage to retrieve more overall results.
4.1.3 Effect of modality relations in retrieval performance
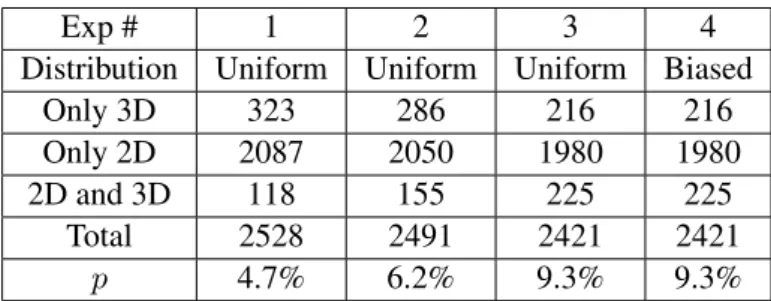
As a further experiment, the influence of modality relations to retrieval is examined. Objects from the ITI database were used and four different experiments were conducted, each with a different proportionpof the total objects being truly multimodal (containing both modalities). In addition, the distribution of the truly multimodal objects across the classes was varied. In the first three experiments, this distribution is uniform, while in the fourth one it is biased. The exact configurations of the four experiments are shown in Table 1.
Figure 3 shows the Cumulative Gain Diagrams of the retrievals in the datasets of the four experiments. As is depicted in the diagrams, the amount of modality relation does affect the retrieval performance; the retrieval accuracy increases as the percentage of the truly multimodal objects rises. However the gain is rather small, even if the percentage is doubled. Furthermore, a biased distribution of the truly multimodal objects across the classes has a negative effect in retrieval performance.
Exp # 1 2 3 4 Distribution Uniform Uniform Uniform Biased
Only 3D 323 286 216 216
Only 2D 2087 2050 1980 1980
2D and 3D 118 155 225 225
Total 2528 2491 2421 2421
p 4.7% 6.2% 9.3% 9.3% Table 1: Characteristics of the databases used in the four dif-ferent experiments of Section 4.1.3. In each experiment, a different proportion,p, of multimodal objects (having both 2D images and 3D models) was used, thus exploring dif-ferent modality relations. In the first three experiments, the multimodal objects were uniformly distributed among the data classes, while in the last one, the distribution was bi-ased.
Figure 3: Modality relation experiments on the ITI database, using 2D and 3D Krawtchouk Moments descriptors and dif-ferent relations between the modalities. The Cumulative Gain axis is logarithmic.
4.2 Evaluation of the visualization framework
Experimental evaluation of the proposed visualization framework was conducted using both the MST-FD and SOM methods of Section 3.3. A dataset consisting of 25 multimodal objects, describing various animals, was used. Each object contains an image and a sound modality and belongs to one of five animal categories, namely dog, canary, horse, frog and cat. Images are described using 12-dimensional color feature vectors, consisting of the first three moments of the hue, saturation and value histograms and the mean of the red, green and blue histograms, similar to [12]. Sounds are described using Bark-Bands descriptors [25].
As a unimodal similarity measure, the Bray-Curtis similarity was used. It is defined between two vectors x= (x1, . . . , xd)andy= (y1, . . . , yd)asSBC(x,y) = 1−DBC(x,y), where DBC(x,y) = Pd k=1|xk−yk| Pd k=1(xk+yk)
is the Bray-Curtis dissimilarity anddis the data dimensionality. Bray-Curtis similarity lies in the range[0,1], where0means no similarity and1total similarity between two items. The same similarity metric was used for both the image and the sound modalities.
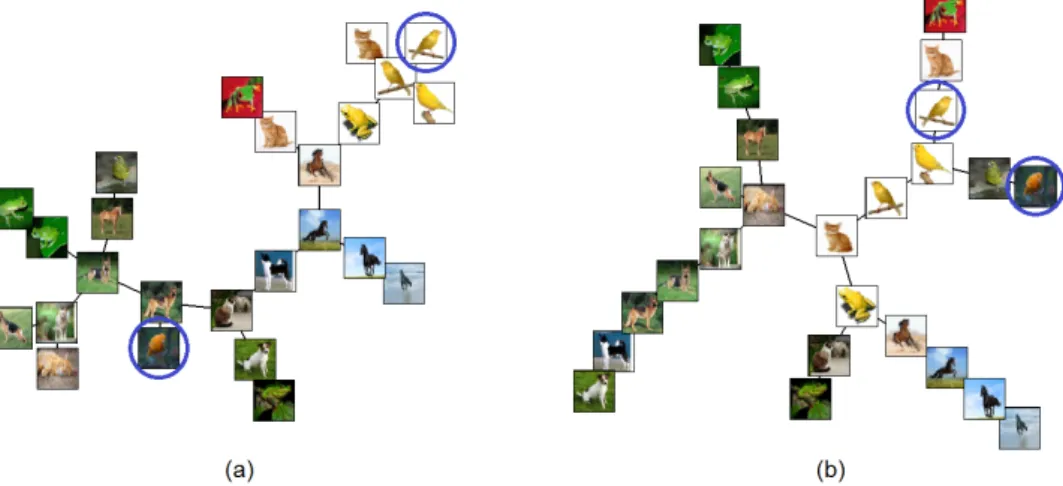
The evaluation of a certain visualization is subjective, meaning that different users may evaluate the same visualization differently, depending on their needs. Therefore, in this paper, the emphasis is on whether the user is able to adjust the outcome via user feedback. However, an objective evaluation measure is also used herein, so that the results of user feedback can be quantified. It is based on the assumption that the user might want to see the results organized according to their classes. The average intra-class distance is used as such a metric, which is the average distance, on the screen, between two objects belonging to the same class. The objects’ class labels were taken as ground truth. For the MST-FD method, the screen distance between two objects is defined as the path distance, on the tree, between them (edge weights are taken to be all equal to 1). For the SOM method, the screen distance is taken as the Euclidean distance, in map cell units, between the two objects. The use of the MST-FD method is shown in Figure 4. Initially, the modality weights have been arbitrarily set to 1 for the image and 0 for the sound modality. In the visualization presented to the user (Figure 4a), the organization is based on the image modality (here on the images’ colors). The average intra-class distance in this setting is 4.76. However, such a visualization may not be adequate for the user, as objects of the same class may have very different images. The user can then select two such objects (the circled ones), to inform the system that they should be closer together. Then, the weights are updated, according to Equation (5) (thec value was experimentally set to0.26) and a new visualization is presented (Figure 4b). Here, the two selected
Figure 4: (MST-FD) (a) Initial visualization. Image weight is 1 and sound weight is 0. The average intra-class distance is 4.76. The user-selected objects are circled. (b) Placement after feedback. The weights are now 0.74 for the image and 0.26 for the sound. The average intra-class distance is now 3.36, which is better.
Figure 5: (SOM) (a) Initial visualization. Image weight is 1 and sound weight is 0. The average intra-class distance is 5.89. The user-selected objects are circled. (b) Placement after feedback. The weights are now 0.7 for the image and 0.3 for the sound. The average intra-class distance is now 4.85, which is better.
objects have indeed been brought closer. Furthermore, due to the change of weights and the use of the sound modality along with the image one, other objects are affected as well, such as the dogs in the lowest-left corner, which are now grouped together. The average intra-class distance is now 3.36, which is better. The average intra-class distance changes as the modality weights change. For the current dataset, its lowest value is 3.12 and is reached at weights 0.7 for image and 0.3 for sound. This value is better than the ones achieved using each modality separately (4.76 for image weight 1 and 3.32 for sound weight 1), indicating that multimodality can indeed be exploited for better visualizations.
Similar results for the SOM method are depicted in Figure 5. The initial visualization (Figure 5a) is also based solely on the image modality and the user selects the two circled object to be brought closer. The weights are updated (withc= 0.3) and a new, better, visualization is presented (Figure 5b). Details can be found in the Figure’s label. The lowest average intra-class distance for SOM is 3.91, for image weight 0.6 and sound weight 0.4. This is again better than using just the image (5.89) or the sound (4.75) modalities.
5
Conclusion
In this paper, a novel cross-modal retrieval framework was proposed, which manages to combine the results of existing powerful unimodal retrieval methods to construct a final retrieval list with data of multiple modalities,
by introducing a cross-modal distance measure. Furthermore, a visualization framework was also included for the user-friendly representation of the results of a multimodal search engine. A multimodal similarity metric was defined between multimodal objects, as a weighted sum of unimodal similarities, and used to extend existing visualization methods to the multimodal case. The aforementioned weights are estimated interactively, via the introduction of a user-based feedback scheme.
Experimental evaluation was performed for both frameworks and the results show the potential of using multiple modalities in tasks such as retrieval and visualization. The cross-modal retrieval framework performed better than unimodal approaches and another multimodal retrieval approach. The visualization framework was tested with two visualization methods and the results indicated that multimodality, combined with feedback from the user, can enhance existing visualization approaches.
Acknowledgments
This work was supported by the EU funded I-SEARCH STREP (FP7-248296).
References
[1] H. Zhang and J. Weng. Measuring multi-modality similarities via subspace learning for cross-media retrieval. Advances in Multimedia Information Processing-PCM 2006, pages 979–988, 2006.
[2] A. Axenopoulos, S. Manolopoulou, and P. Daras. Multimodal search and retrieval using manifold learning and query formulation. InProceedings of the 16th International Conference on 3D Web Technology, pages 51–56, 2011.
[3] Y. Yang, D. Xu, F. Nie, J. Luo, and Y. Zhuang. Ranking with local regression and global alignment for cross media retrieval. InProceedings of the 17th ACM International Conference on Multimedia, pages 175–184, 2009.
[4] F. Wu, H. Zhang, and Y. Zhuang. Learning semantic correlations for cross-media retrieval. In2006 IEEE International Conference on Image Processing, pages 1465–1468, 2006.
[5] C.G.M. Snoek and M. Worring. Concept-based video retrieval. Foundations and Trends in Information Retrieval, 2(4):215–322, 2008.
[6] M. A. A. Cox and T. F. Cox. Multidimensional scaling. In Handbook of Data Visualization. Springer Berlin Heidelberg, 2008.
[7] T. Kohonen. The self-organizing map. Proceedings of the IEEE, 78(9):1464–1480, 1990.
[8] B. McFee and G. Lanckriet. Learning multi-modal similarity. Journal of machine learning research, 12:491–523, 2011.
[9] Y. Y. Lin and C. S. Fuh. Multimodal kernel learning for image retrieval. In Proceedings of the 2010 International Conference on System Science and Engineering, pages 155–160, 2010.
[10] Y.Y. Lin, T.L. Liu, and C.S. Fuh. Multiple kernel learning for dimensionality reduction. Pattern Analysis and Machine Intelligence, IEEE Transactions on, 33(6):1147–1160, 2011.
[11] Y. Wu, E. Y. Chang, K. C. C. Chang, and J. R. Smith. Optimal multimodal fusion for multimedia data analysis. InProceedings of the 12th annual ACM international conference on Multimedia, pages 572–579, 2004.
[12] J. Fogarty, D. Tan, A. Kapoor, and S. Winder. Cueflik: Interactive concept learning in image search. In
Proceeding of the twenty-sixth annual SIGCHI conference on Human factors in computing systems, pages 29–38, 2008.
[13] A. N¨urnberger and M. Detyniecki. Weighted self-organizing maps: incorporating user feedback.Artificial Neural Networks and Neural Information ProcessingICANN/ICONIP 2003, pages 176–176, 2003. [14] M. Bilenko, S. Basu, and R. J. Mooney. Integrating constraints and metric learning in semi-supervised
clustering. InProceedings of the 21st International Conference on Machine Learning, 2004.
[15] H. Cevikalp, J. Verbeek, F. Jurie, and A. Klaser. Semi-supervised dimensionality reduction using pairwise equivalence constraints. InProceedings of the International Conference on Computer Vision Theory and Applications, pages 489–496, 2008.
[16] I. Kalamaras, A. Mademlis, S. Malassiotis, and D. Tzovaras. A novel framework for multimodal retrieval and visualization of multimedia data. InSignal Processing, Pattern Recognition and Applications/779: Computer Graphics and Imaging. ACTA Press, 2012.
[17] C. T. Zahn. Graph-theoretical methods for detecting and describing gestalt clusters. IEEE Transactions on Computers, C-20(1), 1971.
[18] T. M. J Fruchterman and E. M. Reingold. Graph drawing by force-directed placement.Software: Practice and Experience, 21:1129–1164, 1991.
[19] T. Kohonen and P. Somervuo. How to make large self-organizing maps for nonvectorial data. Neural Networks, 15:945–952, 2002.
[20] P. Daras, D. Zarpalas, D. Tzovaras, and M. Strintzis. Efficient 3D model search and retrieval using generalized 3D Radon transforms. IEEE Transactions on Multimedia, 8(1):101–114, 2006.
[21] M Kazhdan, T. Funkhouser, and S. Rusinkiewicz. Rotation invariant shperical harmonic representation of 3D shape descriptors. In Proceedings of the 2003 Eurographics/ACM SIGGRAPH Symposium on Geometry Processing, pages 156–164, 2003.
[22] A. Mademlis, A. Axenopoulos, P. Daras, D. Tzovaras, and M. Strintzis. 3D content-based search based on 3D Krawtcouk moments. In International Symposium on 3D Data Processing, Visualization and Transmission, pages 743–749, 2006.
[23] D. Zhang and G. Lu. Generic fourier descriptor for shape-based image retrieval. InProceedings of 2002 IEEE International Conference on Multimedia and Expo, pages 425–428, 2002.
[24] P. T. Yap, R. Paramesran, and S. H. Ong. Image analysis by Krawtchouk moments. IEEE Transactions on Image Processing, 12(11):1367–1377, 2003.
[25] G. Roma and P. Herrera. Graph grammar representation for collaborative sample-based music creation. InProceedings of the 5th Audio Mostly Conference: A Conference on Interaction with Sound, 2010.
A
Computation of maximum estimation error
A proof for the maximum estimation error of Equation (1) is presented. According to the triangle inequality, the real valueD¯mnof the estimatedDmnof Equation (1) is bounded as:
|Dm−µDn| ≤D¯mn≤Dm+µDn,
The estimation error is equal toe= ¯Dmn−Dmn. By combining these and (1), it can be easily concluded that:
|Dm−µDn| −Dmn≤D¯mn−Dmn≤Dm+µDn−Dmn,⇔ −min{Dm, µDn} ≤e≤min{Dm, µDn}.