Issues
ISSN: 2146-4138
available at http: www.econjournals.com
International Journal of Economics and Financial Issues, 2018, 8(4), 277-283.
Figuring the Relationship between Cash Dividend Ratio and
Stock Price Crash in Companies Accepted in Tehran Stock
Exchange
Nadia Ahadnezhad
1, Behnam Azadi
2*, Peyman Imanzadeh
31Accounting, Astara Azad University, Iran, 2Doctorate of Economics, Faculty of Member, Ardebil Azad University, Iran, 3Accounting, Faculty of Member, Talesh Azad University, Iran. *Email: [email protected]
ABSTRACT
The present survey aims at instigating the relationship between cash dividend ratio and the risk of stock price crash of companies accepted in Tehran
stock exchange. A statistical sample of 131 companies accepted in Tehran Stock Exchange was surveyed for the period between 2010 and 2015. In this study, Levin-Lin-Chu test is utilized to examine the fixity of variables. Also, Panel method with random effects are used to assess the significance of data. The results obtained from the survey hypothesis test are expressive of the fact that there is a significant reverse relationship between cash
dividend ratio and the risk of stock price fallout. In other words, with the increase of cash dividend ratio, the risk of falling out stock prices decreases.
Keywords: Cash Dividend, Risk of Stock Price Crash, Tehran Stock Exchange JEL Classification: G32
1. INTRODUCTION
In present emerging economies, the investor managers are always looking for right investment choices to not only acquire the desired
profit but also accumulate their earnings in the long-term. Financial
markets are among circles which could stimulate investment initiative in investors. At the moment, this important mission is shouldered by Tehran Stock Exchange. Dividend distribution could be debated from two invaluable angles. From one side, it is an effective factor on investment opportunities open to the companies when dividend distribution causes decrease of internal resources increasing the demand for foreign input. From the other side, most of the shareholders would like the cash dividend to be distributed. So the managers have to create a balance between shareholders’
diverse interests and profitable investment opportunities with
an aim of maximizing wealth. Therefore, dividend distribution decisions made by managers are quite sensitive and of prime importance.
An all-encompassing attention paid to the factors and restrictions
influencing dividend distribution polices not only maximizes the
wealth of the shareholders but also helps maintain and survive the
company in the arena of competition, growth and ever-increasing development. From the other side, in a situation where there is
lack of full transparency in financial reports (profit management),
the managers are motivated to partially cover some losses in order to keep their job. This process i.e., hiding real losses continues until the manager is holding his position. After the manager leaves the company, a great volume of undisclosed losses enter into the market and cause stock price crash. In addition, in ambiguous reporting situations, the investors are unable to pinpoint loss-generating projects. Investors’ inability to initially differentiate
between profit-/loss-generating projects causes the losses to
continue and swell. Negative effects of these projects accumulates in the long-run and the moment the information is disclosed, stock
prices begin to fall out intensively (Pourheidary and Arababadi, 2013).
1.1. Expression of the Issue
Every economic entity is trying to gain maximum wealth for its shareholders. Achieving this aim, the companies are bound to take critical decisions on different levels, especially at the highest levels of the management. These decisions, having vast dimensions, are
distribution etc. Dividend payout is among companies’ major decisions. This is generally distributed in two forms of cash and
shares (bonus shares). Dividend distribution policy including
short-term strategies on cash dividend distribution and long-term
strategies influencing shareholders’ earnings is considered as company’s valuation (Jahanshad et al., 2010).
Two decades ago, the scholars declared that the more we study the picture of dividend, the more it looks like a puzzle whose
pieces do not match. The puzzle of dividend has drawn financial
researchers’ attention to itself, at least from the time Modigliani and Miller published their fundamental article. They brought up the point that in a perfect world, when company’s investment
policy is kept as fixed, dividend distribution policy does not have any influence on shareholders’ earnings (Mahmoudabadi and Ebrahimi, 2013).
Paying out more dividend causes cumulative and capital profit
to decrease and vice versa. As a result, shareholders’ total earning remains unchanged. Anyway, despite this prediction, companies would choose their dividend payment strategies quite
knowledgably (Mahmoudabadi and Ebrahimi, 2013).
Traditional theories argue that the companies pay dividends either to give signals of managers’ information to the market or
to fulfill their clients’ request for receiving cash dividends. In
other words, by paying dividends, the companies would in fact
announce their future profit-making situation. This theory initially
succeeded in practice. Because when the companies pay dividend
(with increase) their stock price would increase or vice versa (Mahmoudabadi and Ebrahimi, 2013).
Managers of economic units are as keen in propagating the good news regarding their company as they are in hiding the bad news. These disclosing motivations stem from various factors. Like contracts of bonus payments and job grievances. If managers could keep the bad news hidden for a long period of time, it seems that negative information could get stocked inside the company. Nevertheless, there is a restriction for managers in terms of adsorption of bad news and keeping it as a secret successfully.
The reason behind this restriction is that when after a specified
period of time, the volume of bad news gathered reaches a certain
threshold or a specified level, to continue hiding from that point
on, is either impossible or quite costly.
When gathering bad news reached its peak (declination point),
all the information would abruptly get spread and ends in high negative returns for stocks with which the market had accustomed and this is the very phenomenon of stock crash which is always the
great challenge of investors and managers (Hutton et al., 2009).
Most of the researchers like Chen et al., (2001) believe that
stock price changes in a company are due to internal information management. In situation wherein the information enters into the market at random and the process of information dispersal whether good or bad occurs systematically, if managers disclose all information promptly, this causes stock return to have a symmetric distribution i.e., the average volume of positive return regarding
good news has got to be equal with the average volume of negative
return regarding bad news (Chen et al., 2001).
Therefore the principal issue which has become one of the main concerns of stock markets and bourse throughout the world, is the problem of future stock price crash. Thus, we intend to prove
whether there is a significant relationship between cash dividend
ratio and the risk of stock price crash in the accepted companies in TSE?
An accounting item prepared and presented throughout financial reports (statement of profit and loss) is the net profit. Calculation of the net profit of an economic agency is influenced by the use of
accounting methods and estimates. As a result, the profit figures
may be manipulated by the management. Possibility of utilizing
different accounting methods has caused differences in the real
profit of companies with the profits as reported through financial
statements. The policy of dividend distribution may cause the real
profit to be reported as true or false and the just representation of
operation performance of the trading unit. In fact, managers make decisions to pay or increase the payment of dividend when they
feel the profit has not been noticeably influenced by manipulation
of accounting methods and it is improbable to decrease dividends in the future.
Creation of value and increase of stockholders’ earnings in the long-run is one of the most important objectives of the companies and earnings would not increase unless through favorable performance. Understanding relationships between performance and cash dividend distribution in underdeveloped countries having traditional market structure is important. According to studies conducted in developing countries with high economic growth, distributed dividend is less than countries with lower growth rate, therefore, dividend distribution could be investigated from two angles:
Microeconomics: To maximize stockholders earnings.
Macroeconomics: For economic efficiency and optimal allocation
of country’s resources.
For managerial performance assessment and measuring stockholders earnings, different indices have been discussed. The newest indices like induces having economic approach such as economic value added and market value added which are considered along with traditional indices with accounting approach. From the other side, information asymmetry is a negative phenomenon usually occurring in stock exchange markets causing difference between the natural value of a stock and its estimated value. The stock is valued by investors and thus leads to improper economic decisions. Information asymmetry occurs when one party to the contract or transaction is more informative than the other party, and when communicating with the other party could effectively use this information. What managers are after, is the increase of stockholders earnings, promote company
performance and improve company’s financial situation during the
period of depression. The ratio of cash dividend is another policy
tool in distributing management profit which individuals receive
increase or decrease corresponding to company’s performance
(Pourheidari and Arababadi, 2013).
Pointing to theoretical fundamentals regarding research, a review
is made of several local and foreign research histories in line with research topic as follows:
1.2. Local Research History
Setayesh and Ebrahimi (2015) conducted a research titled “investigating the effect of Concentrated Ownership on the Policy of Dividend Payment by Companies Accepted in Tehran Stock
Exchange.” Their research sample consists of 86 companies during
the time period between 2005 and 2011. Research variables were
ownership concentration and payment of dividend. Results gained from research hypothesis test in combined data is evident that there is a positive relationship between ownership concentration, and dividend payment ratio, and dividend payment ratio and assets.
But this relationship is not significant in regard to stocks payment
ratio against the assets, in other words the higher the ownership concentration, the more payable dividend.
Foroughi and Ghasemzadeh (2015) conducted a research titled ‘Investigating higher than normal influence of management on
future fall out risk of stock prices in companies accepted by Tehran Stock Exchange’ among 117 bourse companies during the
time interval between 2004 and 2013. Their research variables were: Managers’ excessive self-confidence and fall out risk of
future stock prices. To test hypotheses they used multi-variable regression pattern and combined data. The results show that
managers’ confidence has a significant positive influence on all 3
risk measures of stock price crash. In other words, excessive
self-confidence of managers, increases the risk of stock price fallout.
Vadi-ee and Rostami (2014) carried out a research titled
‘Investigation of the effect of type of institutional ownership on the risk of future stock price crash in companies accepted in TSE.
They investigated the data regarding 80 companies during the years 2004-2012. In this regard one principal hypothesis and two
auxiliary hypotheses were compiled and to test the hypotheses, logistic regression and combined data were utilized. Findings
show that institutional ownership has positive significant effect on future stock price crash (bottom to top fluctuation variable). But
dividing active and inactive institutional ownership, the results show that the positive institutional ownership on future stock price crash originates from active institutional ownership which have a monitoring role in decreasing future stock prices. In other words, active institutional ownership has a negative effect and inactive institutional ownership has positive effect on future price crash
risk (bottom to top fluctuation variable).
Bon and Hong (2016) focused on U.S. companies in a survey
titled “investigating the relationship between dividend payment and the risk of stock price fall out.” Survey variables include dividend payment and stock fall out risk. The method used in this survey is multiple regression. They investigated a great number
of U.S. companies from 1991 to 2011 and concluded that there is a negative (reverse) relationship between dividend payment and
price fall out risk. Such that with the increase of dividend payment
especially in cash, the risk of price fall out could be controlled and would decrease.
Dang et al., (2016) conducted a survey of U.S. firms titled
“investigating the relationship between the structure of debt due and price fall out risk.” Research variables used were debt due and price fall out. They used information in a time period between
1989 and 2014. They surveyed 7712 companies and a sample consisting of 53052 company-years (observations). The method of
hypothesis test was linear regression. The results obtained showed
a negative significant relationship between debt structure due and
risk of stock price decrease in U.S. companies.
Bon and Zhang (2015) investigated “relationship between
Conservative accounting with the risk of future stock price crash.” Research variables were conservative accounting used based on Basu model and future risk of price crash. To do this, they surveyed over
58,072 U.S. companies for a period of 1964-2007. They found out
that conditional conservatism accounting causes decrease in the risk of prices crash. They also found out that in companies where information asymmetric is abundant, the risk of stock price crash is more evident.
2. RESEARCH HYPOTHESES
Taking the subject of research and its theoretical fundamentals into account, it could be said that with the increase of cash dividend ratio, the risk of stock price crash decreases. Therefore, the
hypothesis could be put forth as follows: There is a significance
relationship between cash dividend ratio and stock price fall.
3. RESEARCH METHOD
The present survey from the point of view of objective, is applied, from nature, descriptive- correlative and retrospective. From method viewpoint is analogical, inductive rezoning. In these kind of surveys, the aim is to investigate the relationship between variables and the data are gathered and analyzed from a natural setting or from past events free from researcher’s direct
interference. Here, the research has used panel data.
3.1. Research Statistical Population
Statistical population of the survey includes all companies accepted in Tehran stock exchange. It is noteworthy to mention that
the survey time period starts from 2010 to 2015. Sample companies
have been chosen based on the following criteria:
1. Companies were bound to be members of TSE from start to the end of survey.
2. Banks, financial intermediaries, holdings and leasing got
excluded.
3. Companies not having data on variables were removed.
4. Companies’ stocks have been transacted in TSE from 2010 to 2015.
5. Companies’ fiscal year end 29th Esfand.
3.2. Method of Data Gathering and Analysis
For gathering theoretical principles and research background, library method was used. Data gathering required for analysis and tests were gathered through data mining. Required data
were retrieved from Tadbir Pardaz data bank, Rahavard Novin, Modiriyat Pazhouhesh site, TSE development and Islamic studies,
and TSE site. Statistical analysis of data and testing hypotheses of the present survey were derived from descriptive statistics
(including mean, standard deviation) and for inferential statistics (multi-variable linear regression) was used. Survey variables were processed by Excel 2010 and analyzed by Eviews version 9.
3.3. Research Variables
3.3.1. Dependent variable
In this research, the dependent variable is the risk of future crash
of stock prices to measure which negative skewness coefficient (Chen et al., 2001) was used. In other similar surveys like Bon and Hong (2016), Dang et al., (2016), Bon and Zhang (2015), Huton et al., (2009) and Forougi and Ghasemzadeh (2015), Model (1)
was used as follows:
Mode (1): NCSKEWit=-[n (n-1)3/2∑Wit]/[(n-1)(n-2)(∑Wit)3/2]
In the above: NCSKEWit is negative skewness coefficient where
Wit indicatesthe monthly return of the company I for the month t
and n numbers of monthly return during the fiscal year. In the above modelwhen the coefficient of negative skewness is greater, the company is exposed to more stock price crash (t denotes month).
“Special monthly return of the company” is equal to natural log of number 1 plus remaining Et calculated from model no.2. In model number 3, RJ, t is the stock return of company j in month t, and rm,
t is the monthly return of the market (according to market index).
Model (2)
Wj,t = ln(1+εj,t)
Wherein:
Wj,t: is the special monthly return of the company during the
fiscal year
εj,t: Stocks remaining returns
Model (3)
rj,t = αj+β1rm,t-2+β2rm,t-1+β3rm,t+β4rm,t+1+β5rm,t+2+εj,t
Wherein
rj,t: Company j stock return in month t and
rm,t: The monthly return of the market (according to market index).
3.3.2. Independent variable
The independent variable in this research is cash dividend ratio
paid from cash dividend paid to net profit of the company. Lawsen and Wang (2015), Caskey and Hanlon (2014), Etemadi and Ahmadian (2013), and Setayesh and Kazeminezhad (2010) have
also used this ratio.
4. DATA ANALYSIS OF THE RESEARCH
4.1. Descriptive Statistics
In Table 1 descriptive statistic related to research variables are
shown. Research data are related to a 6-year period 2010-2015
for extracted annually for 131 companies.
4.2. Stationary Test
Before estimating the model in studies using panel data
(cross sectional and temporal), first the stationary of variables (stationary during the time) has to be investigated because if the variables are not fixed, false regression occurs. To determine
stationary of model variables single root tests in panel data would be used. Variable reliability is stationary of the mean and variables variance along the time and covariance of variables between different years. According to Gujarati in econometrics, if the number of companies is much more than temporal cross sections, there is no need for the stationary or reliability of data. In this research, Levin-Lin-Chu test has been used to examine
the stationary of variables. Since variables significance level obtained from Levin-Lin-Chu test is less than 0.05, it could
be concluded that the survey variables are at the stationary
level (Table 2). Therefore, due to stationary of variables the
problem of false regression would not be developed in regression analysis.
Table 1: Descriptive statistics
Symbol Variable Mean±Standard deviation Median Skewness Elongation Minimum Maximum
Crash it Stock price fall 1.8647±0.4374 −1.735 −3.3746 28.3156 −6.8876 −1.2072
DCRit Cash dividend ratio 0.5446±3.2604 0.2756 19.2594 477.6236 −16.1228 81.0572
LEVit Financial leverage 0.6345±0.3067 0.6219 2.4409 16.7253 0.0657 3.0604
SIZEit Company size 14.0697±1.6169 13.7890 0.8012 3.7098 10.312 19.1062
ROAit Profitability 0.1307±0.1365 0.1150 0.2605 4.9987 −0.5425 0.6392
Table 2: Levin-Lin-Chu stationary test
Variable Levin-Lin-Chu test
Statistic value Significance level Test result
Stock price fall Crash it −16.28 0.0000 Stationary Cash dividend ratio DCRit −33637.0 0.0000 Stationary Financial leverage LEVit −11.43 0.0000 Stationary Company size SIZEit −13.00 0.0000 Stationary
4.3. Tests of Classic Assumptions
4.3.1. Normalization test
One of the most important Assumptions in using linear regression model is normal distribution for model and dependent variable of the survey. In estimation models it is assumed that remainders and following the dependent variable are random variables. Therefore distribution of dependent variable follows the distribution of remainders. In this survey normalization is investigated through Jarak-Bera statistic.
4.3.2. Test of homoscedascity
Goodness of fit of variance in different cycles is among other
assumptions of linear regression. Infringement of this assumption develops heteroscedasticity. Assumption of homoscedascity is the direct result of the assumption of normalization of distribution of
dependent variable. Heteroscedasticity is the change in the quantity
of variance of the random section of the model during observation
of the sample. As the significance level of these tests in Table 3 are
less than the error level of 0.05, therefore, it could be concluded that the zero assumption of these tests is not confirmed. In other
words. The problem of heteroscedasticity exists and to remove this problem generalized least squares GLS method shall be deployed.
Investigating research hypothesis:
In order to test research hypothesis, model below would be used:
Crashit=β0+β1Dcrit+β2ROAit+β3Sizeit+β4Levit+εit
Crash it= Stock price crash risk Dcr it= Cash dividend ratio
ROA it= Profitability
LEV it= Financial Leverage SIZE it= Company’s Size
εit =regression error
β0: Constant coefficient
βi,i=1,2,3,4= Regression coefficients
In the above regression model, if an independent variable coefficient is significant, it is concluded that the research
hypothesis is confirmed. In surveys having panel data it must first be evident that there is an individual difference or a so-called
heterogeneity in the cross sections or the sections are homogenous. Using F Lamer test heterogeneity between sections could be indicated. Statistical hypotheses of F Lamer test are as follows:
Null hypotheses: Here the sections are homogenous or in other words, pooled (data) combined model is appropriate for estimation.
Alternative hypothesis: There is heterogeneity between sections.
Panel data suitable for estimation.
In case null hypothesis indicates homogeneity of sections
(combined model suitability is confirmed) all data shall be
combined together and parameters get estimated through a classic regression. Results gained from this test is shown in Table 4.
Since significance level of F Limer is less than error level of 0.05
in survey model, it is concluded that panel data is suitable for estimation of research model.
After it became evident that there is heterogeneity in sections and individual differences can be reckoned, and panel data is suitable for estimation, it should become evident whether estimation error is due to change in sections or has occurred due to the passage of time. In dealing with such errors we are faced with two effects:
Fixed effect and random effect. To prove the effects, Hausman test is conducted. In Hausman test null hypothesis is indicative of randomness of error estimation (suitability of random effects in regression models of panel data) the result of which is shown in
Table 4. Two important points in regard to fixed or random effects
are that all individuals or sections of the panel are homogenous.
Here, there is no need to be worry about y-intercepts for individuals or sections. In fact Panel data approach could decently indicate
heterogeneity between individuals. This is an advantage of panel models in regard to sectional or temporal models. Second point
is that y-intercepts is a fixed point for a person or a section in
regression model. Random model assumes y-intercept is random for each group, but the random distribution occurs once in each cycle of regression model. I.e., for the whole cycles there is just one
y-intercept for each person. Since significance level of Hausman test is higher than error level of 0.05, it is concluded that panel
method with random effects is suitable.
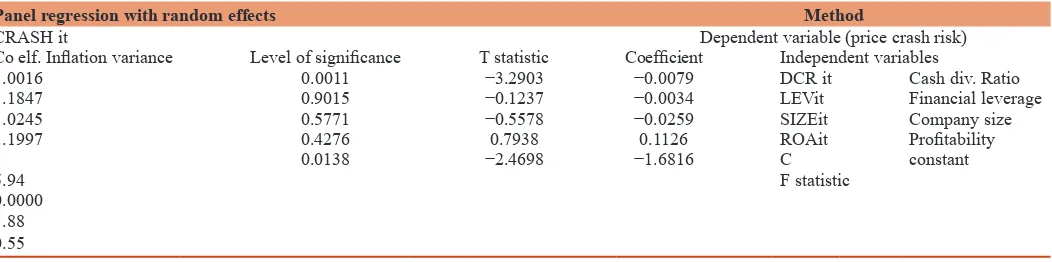
As mentioned, to test research hypothesis, the estimation approach was used. Setting forth regression hypotheses and choosing the suitable method of estimation, the results of model estimation is shown in Table 5. In order to rely on
model estimation results, regression assumptions have to be investigated. The main assumption of multi-variable regression
analysis is the significance of the whole regression. In Table 5,
F statistic and its level of significance is related to the test of certainty for being a linear relation (the significance test for the whole regression) between independent variables and dependent
Table 3: Classsic regression assumptions
Test of homoscedascity: Harvey Result of test
Sum of F statistic Level of significance Heteroscedasticity
5.9613 0.0001
Normalization test of variable remains: Test of JARAK-BERA
Sum of statistic Level of significance Not normal
variable. Since the significance level of this test for the model is less than the error level of 0.05, it could be concluded that in the
research model, there is a linear relation between independent variables and dependent variable. Therefore, it is concluded
that the whole model is significant. Another assumption taken
into account in regression, is the independence of errors from
each other (difference between real sums and predicted ones by regression equation). If the hypothesis of independence of
errors is rejected and errors are correlated, it is impossible to use regression. In order to investigate the independence of errors from each other, Durbin-Watson test shall be used. If statistic
of Durbin-Watson is close to 2 (between 1.5 and 2.5), lack of
correlation between errors is confirmed. In Table 5,
Durbin-Watson test sum is 1.88, falling within the accepted interval of
1.5-2.5.
Research hypothesis: There is a significant relationship between
cash dividend ratio and the risk of stock price crash.
To investigate the above hypothesis, using the information of Table 5 it could be concluded that: The sum of variable coefficient of cash dividend ratio (DCRit) is equal to −0.0079. Paying attention to the significance level of the coefficient of the variable which is lower than the error level of 0.05, it is conclude that there is a significant reverse relationship
between cash dividend ratio and the risk of companies’ stock price crash. In other words, with the increase of cash dividend ratio, the risk of stock price crash decreases. Therefore, taking the above points into account, it is concluded that the above
hypothesis i.e., “There is a significant relationship between
cash dividend ratio and the risk of stock price crash.” Could
be confirmed with 95% confidence. Taking the significance of
control variables, it could as well be stated that: There is no
significant relationship between any of the control variables i.e., financial leverage, company size and profitability, with
the risk of stock price crash.
5. CONCLUSIONS AND SUGGESTIONS
The results of hypothesis test showed that there is a negative
significant relationship between cash dividend ratio and risk of stock price crash. Therefore, the findings could be so justified
that managers with their decision regarding cash dividend, transmit to the market some information on their company’s situation and standing. To put it more accurately, they signal to actual and potential investors that their company is in a favorable
situation. This is a confirmation of the theory of signaling. From
the other side, it could be stated that cash dividend distribution
influences the behavior of investors and this influence changes
the attitude of the investors toward the company and with the procedures taken, the risk of stock price crash decreases. This attitude of the investors complies with the theory “a bird in hand” which means dividend distribution is better than its
accumulation or better said: “Paid in cash is preferred to pay
in installments.”
The following suggestions could be presented:
1. Based on the results obtained, it is recommended to the scholars who compile accounting standards to encourage companies to pay cash dividends. Because this policy lessens
the risk of stock price crash and leads to financial boom in
stock exchange market.
2. According to the findings of the survey, we hereby ask the
investors to pay attention to dividend distribution especially the cash form. It must be said that payment of cash dividend is not an absolute signal of the company profitability and positive return and sometimes could stem from the opportunistic behavior of the managers to achieve their personal goals.
3. We herewith recommend major stockholders and the members of the board of the companies who play essential roles in the company to pay attention to cash dividend because the
Table 4: F Limer and Hausman tests
2 F statistic Significance level Test result
F Limer test 3.5897 0.0000 Panel method
Hausman test 5.6161 0.2297 Panel method with random effects
Table 5: Estimation of research model
Crashit =β0+β1Dcrit+β2ROAit+β3Sizeit+β4Levit+εit
Panel regression with random effects Method
CRASH it Dependent variable (price crash risk)
Co elf. Inflation variance Level of significance T statistic Coefficient Independent variables
1.0016 0.0011 −3.2903 −0.0079 DCR it Cash div. Ratio
1.1847 0.9015 −0.1237 −0.0034 LEVit Financial leverage
1.0245 0.5771 −0.5578 −0.0259 SIZEit Company size
1.1997 0.4276 0.7938 0.1126 ROAit Profitability
0.0138 −2.4698 −1.6816 C constant
5.94 F statistic
0.0000
1.88
dividend distributed is one of the important factors in investors and stockholder’s decisions.
4. Finally, it is recommended to financial analysts and
researchers to recognize the effective factors influencing the
behavior of stock price and especially the reasons of stock price crash risk in Tehran stock exchange and try to clarify the subject for their audiences, because price crash risk causes
public lack of confidence in stock market and negatively affects its efficiency and eventually takes the capital out of
Stock Exchange market.
REFERENCES
Bon, K.J., Zhang, L. (2015), Accounting Conservatism and Stock Price
Crash Risk: Firm-level Evidence. Research Output: Conference
Papers (RGC: 31A, 31B, 32, 33).
Bon, K.J.L.L., Hong, X. (2016), Dividend Payments and Stock Price Crash Risk. Available from: https://www.ssrn.com/abstract=2745395. Caskey, J., Hanlon, M. (2014), Dividend policy at firms accused of
accounting fraud dividend policy at firms accused of accounting fraud. Contemporary Accounting Research, 30(2), 818-850. Chen, J., Hong, H., Stein, J. (2001), Forecasting crashes: Trading volume,
past returns, and conditional skewness in stock prices. Journal of
Financial Economics, 61, 345-38.
Dang, V., Dang, E.L., Yangke, L., Cheng, Z. (2016), Corporate debt
maturity and stock price crash risk. Journal of Financial and
Quantitative Analysis, 38, 185-212.
Etemadi, H, Ahmadian, V. (2013), Investigating the effect of the type of
the largest shareholder on dividend policies of accepted companies in
Tehran stock exchange. Journal of Management and Finance, 3, 56-72. Foroughi, D., Ghasemzadeh, P. (2015), Excessive effect of management on future stock price risk in companies accepted in TSE. Scientific Research Journal of Danesh Hesabdari Maali, 2, 55-71.
Foroughi, D., Ghasemzadeh, P. (2015), Investigating the impact of
management excess on the risk of future stock falling in companies admitted to the Tehran stock exchange. Journal of Financial
Accounting Knowledge, 2, 71-55.
Hutton, A.P., Marcus, A.J., Tehranian, H. (2009), Opaque financial reports,
R2, and crash risk. Journal of Financial Economics, 94, 67-86.
Jahanshad, A., Asgari, M.R., Asadikoli, V. (2010), Effect of percentage change of dividend payment on future profit growth, Danesh Maali. Tahlil Oragh Bahadar Scientific, Research Quarterly, 12, 41-63. Lawsen, B., Wang, D. (2015), Do Dividends Inform Auditors about
Clients’ Earnings Quality? Evidence from Audit Pricing. Available from: http://www.cepd.okstate.edu/accounting/arc.
Mahmoudabadi, H., Ebrahimi, S. (2013), Survey on effect of market
competition on dividend payment. Accounting and Auditing
Review, 7, 85-92.
Pourheidari, O., Arababadi, R. (2013), Relation of stock price and
voluntary disclosure in companies accepted in TSE. Management
School, Tehran University, Accounting Review, 21(1), 39-56. Setayesh, M.H., Ebrahimi, S. (2015), Survey of effect of ownership
concentration on dividend payment policy in companies accepted
in TSE. Accounting and auditing Review, 36(4), 51-61.
Setayesh, M.H., Kazemnejad, M. (2010), Investigating the effect of the ownership structure and combination of the board on dividend profit policies of Tehran stock exchange. 1, 29-50.
Vadi-ee, M.H., Rostami, A. (2014), Effect of type of institutional ownership
on future stock price crash risk in companies accepted in TSE.