DOI: 10.5958/2230-732X.2017.00090.0 ©2017New Delhi Publishers. All rights reserved
AGRICULTURE ENGINEERING
Optimization of Process Parameters for Osmotic Dehydration
of Chayote Cubes by Response Surface Methodology
Avinash Kumar
1, Sahijul Islam
1, Kshirod Kumar Dash
2and Sudipto Sarkar*
1 1Department of Agricultural Engineering, Triguna Sen School of Technology, Assam University, Silchar, Assam, India 2Department of Food Engineering and Technology, School of Engineering, Tezpur University, Napaam, Assam, India * Corresponding author: [email protected] (ORCID ID: 0000-0001-7127-1754)Paper No.: 635 Received: 02-09-2017 Accepted: 19-11-2017
ABSTRACT
Chayote is a rich source of vitamin C and vitamin B-6 as well as folate. It also contains dietary fiber and is high in potassium and very low in sodium, a combination which makes it ideal for supporting healthy blood pressure. The response surface methodology (RSM) of central composite rotatable design (CCRD) with 30 experimental runs were used for the optimization of process parameters during the osmotic dehydration of chayote cubes (1 cm3) using brine solution of salt for maximizing water loss (WL), minimizing solid gain (SG) and maximizing rehydration ratio (RR) of the dehydrated product. The independent process variables with four factors and five levels included solution temperature (25-45ºC), immersion time (140-220 min), concentration (5-15%) and sample to solution ratio (1:6-1:14 w/w). Osmotically pretreated chayote cubes were further dehydrated in hot air oven at the desired temperature of 60°C and later it was analyzed for rehydration ratio of the dried samples by placing it into water for 16-17 hours at ambient temperature. The results were obtained at the optimum operating conditions to be the solution temperature of 35.61ºC, immersion time of 186.56 min, concentration of 9.02% and STSR of 1:11.23 (w/w). Under these conditions, the WL SG and RR were evaluated as 29.79% (wb), 5.47% (wb) and 21.14, respectively.
Highlights
mAt a solution temperature of 35.61ºC, immersion time of 186.56 min, concentration of 9.02% and STSR of 1:11.23 (w/w)., the WL, SG and RR were evaluated as 29.79% (wb), 5.47% (wb) and 21.14, respectively Keywords: Optimization, osmotic dehydration, squash, salt solution, response surface methodology
Chayote or squash (Sechium edule L.), is an edible fruit consumed as vegetable of a tropical perennial vine plant belonging to Cucurbitacae family and its
physical characteristics are pale green, peer shape,
mild flavor and crispy textures having a single seed. It has a low lipid, protein, and calorie content, but
it is a vital source of minerals, amino acids, and
vitamins (Lira-Saade 1996; Cadena-Iniguez et al. 2006). It has also been reported to exhibit diuretic and anti-inflammatory properties (Ordonez et al. 2006).Moreover, its popularity is growing world wide for its inherent qualities. It’s cultivated in various parts of India for its huge market demand. In Assam, chayote is available from the month of
July to October, where it is locally called squash. Chayote has been used in salads, cooked vegetables, fermented pickles, candy, juice, murabba, cakes and snack foods. Hence, Chayote occupies an important place among similar properties of vegetables like potato and guard for its varied applications,
culminating in various processing operations and
stored for more than 6-7 days in ambient conditions, but shelf life can be extended through different processing methods such as fermentation, pickling, canning or cold storage freeze-drying. Freeze drying produces highest quality of food products but it is also the most expensive method of food preservation (Singh et al. 2010). Therefore, a new technology was developed to extend the self-life of chayote using the principle of osmotic dehydration. The further drying followed by hot air dryer was needed to reduce the excessive moisture content of chayote and enhance the shelf-life.
Osmotic dehydration is the partial water removal
process from food materials such as fruits and
vegetables by their immersion in concentrated solutions using osmotic agents. The osmotic dehydration (OD) is a pretreatment method for
food preservation in the processing of dehydrated
foods. It works around ambient temperatures, so it presents some benefits such as reducing the damage of heat to the flavor and color, inhibiting the browning of enzymes and decreasing the energy costs (Alakali et al. 2006). Hence, this simple and inexpensive method has become more
popular in food processing sector and its potential
is well suited for food industry in India and other countries. The most commonly used osmotic agents
are sucrose, sodium chloride, glucose, fructose, and corn syrup, among them sodium chloride is
preferred for vegetables and sucrose for fruits. In osmotic dehydration, the water removal process is influenced by many factors such as type and
the concentration of osmotic agents, temperature,
agitation/circulation of solution, solution to sample ratio, thickness of food material and pretreatment (Rosa and Girox 2001). Number of researchers has
tried to increase the mass transfer to reduce the
processing time and to minimize the solid uptake (Ispir and Togrul 2009; Devic et al. 2010; Borah et al. 2017).
The response surface methodology (RSM) is a statistical technique generally used for designing experiments, building models, evaluating the effects of factors and for searching the optimum conditions. It has been used to determine the optimal values
for the process parameters in various processes
(Mannan et al. 2007; Rajasimman et al. 2009). Several works have been carried out on the optimization of vegetables by RSM method (Uddin et al. 2004;
Eren and Ertekin 2007; Singh et al. 2008; Sarkar et al. 2015). Therefore, RSM toolhas been given the priority for the optimization of process parameters and the behavior of the parameters during osmotic dehydration.
Although there have been very few studies on the osmotic dehydration of chayote (Ruiz-Lopez et al. 2010; Akonor and Tortoe 2014) no information is available on the optimization of process conditions with the statistical modeling of chayote drying by osmotic dehydration. Therefore, the present work was carried out with the objectives: (i) to optimize water loss, solid gain, and rehydration as a function of the process variables by the application of response surface methodology; and (ii) to study
the effect of process parameters during osmotic
dehydration process.
MATERIALS AND METHODS
MaterialsThe secondary collection of fresh and well-graded chayote were procured from the local market, Irongmara, Silchar, Assam (India) on a daily basis prior to each set of experiments and were transported to the laboratory for this research work. The osmotic agent NaCl salt used in the osmotic dehydration process was also purchased from a local market. The osmotic solution was prepared by blending the desired amount of salt and distilled water. The average moisture content of the chayote was found to be 93.27% on a wet basis.
Experimental design
chayote), and rehydration ratio. The ranges of the input variables from low level to high level in un-coded forms were taken as solution temperature, 25-45˚C; immersion time, 140-220 minutes; salt concentration, 5-15% and STSR, 06-14.
The coded and un-coded form of process variables of the experiments is as given in Table 3.1. In this study, the experiments were conducted randomly to minimize the effects of unexplained variability in the observed responses because of external factors (Jokic et al. 2007).The design was prepared using Design Expert® 9 software which gave the overall 30 experiments for four process variables.
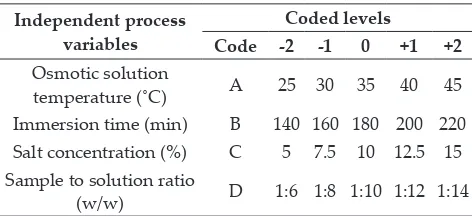
Table 1: The different levels of independent process variables in coded and un-coded forms
Independent process variables
Coded levels
Code -2 -1 0 +1 +2
Osmotic solution
temperature (˚C) A 25 30 35 40 45
Immersion time (min) B 140 160 180 200 220 Salt concentration (%) C 5 7.5 10 12.5 15 Sample to solution ratio
(w/w) D 1:6 1:8 1:10 1:12 1:14
Preparation of samples and osmotic dehydration
The selected chayote were washed, peeled manually and diced by a knife into cubes of 1cm × 1 cm × 1 cm size. No blanching was done prior to osmosis as it has been reported to be detrimental to osmotic dehydration process due to the loss of semi-permeability of cell membranes (Ponting 1973). In this study, salt solution was chosen for osmosis, as it is an excellent osmotic agent for vegetables retarding oxidative and non-enzymatic browning (Jackson and Mohammed 1971). Each experiment was conducted by taking three replicates of pre-weight known, amount of chayote cubes with the desired
concentration of salt solution and the sample to
solution ratio (STSR) was prepared and the samples were immersed in each Erlenmeyer flasks 500 ml separately, which were then kept in the incubator shaker (SCIENTECH INSTRUMENT, DELHI, INDIA), set at constant agitation 175 rpm with desired time temperature combination. Agitation was used to reduce the mass transfer resistance at the surface of the chayote cubes, to ensure good mixing and close temperature uniformity and
control in the osmotic medium (Mavroudis et al. 1998). During experimentation, it was assumed
that the amount of solid leaching out of chayote
cubes during osmosis was negligible (Lazarides et al. 1995; Sablani et al. 2002). After each experiment with the desired time temperature combination, the samples were taken out of salt solution, rinsed with distilled water, and then gently blotted up with the absorbent paper to remove the free water present on the surface of cubes and weighed the samples using a digital electronic balance (KERN & SOHN GMBH, Germany) with an accuracy of ±0.001g for measuring the weight reduction after osmotic treatment.
Osmotic pretreated samples were transferred for further drying into a hot air oven (REICO EQUIPMENT AND INSTRUMENT, KOLKATA, INDIA), set at desired optimum temperature of similar properties of fruit for 60°C and air circulation 1 m/s. During drying, the masses of the samples were monitored until they attained the moisture content up to 6-8% (wet basis) to maintain the quality of the product and then again the samples were reweighed by the same digital electronic balance to check the water loss and the solid gain. The dried samples were cooled in the desiccator containing silica gel for 1 hour, packed in zip-lip HDPE (high density polyethylene) bags and kept at an ambient temperature for quality analysis.
Mathematical Calculations
Water loss and solute during osmotic dehydration
The percentage of water loss(WL) and solid gain (SG) during osmotic dehydration were computed using the following equations as given (Ozen et al. 2002; Singh et al. 2010):
WL (%) = Water loss g/100 g fresh chayote
=
(
o o) (
t t)
100o
W S W S
W
− − −
× … (1)
SG (%) = Solid gain g/100 g fresh chayote
=
(
t o)
100o
S S
W
−
Where, Wo is the initial weight (g) of the chayote cubes, is the weight(g) of sample after osmotic dehydration at time t (min), is the initial weight of solids (dry matter) in the cubes (g), is the weight of solids (dry matter) in the cubes (g) after osmotic dehydration at time t (min).
Rehydration ratio
Rehydration ratio (RR) is used to measure the water absorption capacity of osmo-dehydrated chayotes. The rehydration of osmo-dried chayote cubes was determined by soaking a known weight 10 g of each sample in a sufficient volume of water (approximately 30 times the weight of the dehydrated chayote cubes) at room temperature (Mazza 1983). The chayote cubes were found to be of constant weight at 15-17 hrs. The cubes were weighed after removing the excess water with the help of an absorbent paper. The rehydration ratio was calculated as follows:
Rehydration ratio =
Weight of rehydrated chayotes(g)
Weight of dehydrated chyotes (g) … (3)
Statistical Analysis and Optimization
A second order polynomial equation was fitted to the experimental data of each dependent variable as given below (Singh et al. 2010):
1 2 0
1 1 1 1
n n n n
k k ki i kii i kij i j k
i i i j i
Y β β x β x − β x x e
= = = = +
= +
∑
+∑
+∑ ∑
+ ... (4)where, Yk = response variable, Y1= water loss g/100 g fresh chayote cubes, Y2 = solid gain g/100 g fresh chayote cubes, Y3 = rehydration ratio). Coefficient βko is the value of fitted response at the center point design, i.e., point (0, 0, 0), and βki βkii and βkj are
the linear, quadratic, and interaction regression
coefficients, n is the number of independent parameters (n = 4), ek= error, respectively.
The main aim of the optimization of osmotic dehydration process was to find the levels of process variables, viz. osmotic solution temperature (ºC), immersion time (min), salt concentration (%), and sample to solution ratio (w/w), which would give in maximum water loss, minimum solid gain, and maximum rehydration ratio of the chayote
cubes. The model equation 3 was fitted to examine
the effect of model terms and also to evaluate
the desired response parameters at 5% level of significance. The βcoefficient values were used to predict the dependent variables as a function of each independent variable. The response surface plots were generated for different process variables and the interaction of any two variables, while holding the values of third and fourth-variable as constant (at the central value). The three dimensional response surface plots were generated in the same software, which gives accurate geometrical representation and sound information about the system behavior.
RESULTS AND DISCUSSION
Diagnostic Checking of Fitted Models
The CCRD experimental designs were performed in Table 2 to investigate the optimum conditions for the responses during osmotic dehydration. A Model F-value of 43.71, 100.86, 68.30 and 69.47 for weight reduction, solid gain, water loss, and rehydration
ratio, respectively implies that the model is
significant. The models indicated that the 90% of variation in the experimental data were highly significant (R2>0.90). In the regression summary of
different models, the values of coefficients, sum of squares, F-values and p-values for coded forms of process variables are presented in Tables 3-5. The Mathematical expressions of second order polynomial coefficients of developed model in the form of coded equation (5), (6), & (7) using design expert 9.0.6.2, are as follows:
(Y1) = ‘Water loss g/100 g of fresh chayote’ = +29.60+1.55A+2.47B+2.80C+1.41D+0.45AB
+0.096AC–0.32AD–0.10BC–0.24BD +0.49CD– 0.64A2–0.58B2–1.39C2–0.50D2 … (5) (Y2) = ‘Solid gain g/100 g of fresh chayote’
= +5.47+0.26A+0.63B+1.17C+0.40D–0.059AB +0.28AC–0.097AD–0.19 BC+0.083BD+0.071CD +0.052A2 +0.077B2–0.032C2–0.077D2 … (6) (Y3) = ‘Rehydration ratio’
Water Loss
Analysis of variance (ANOVA) was used to analyze the results presented in Table 3. The p-values (Table 3) indicate that all the linear
terms are significant, the interactions terms of
AB, BC, and CD are significant, whereas AC, AD, and BDare non-significant, and all the quadratic terms are significant. The F-values indicated that the most significant variable for the water loss of chayote cubes was concentration (F=348.46), followed by processing time (F=270.85), solution temperature (F=107.25), and sample to solution ratio
(F=87.66) given in (Table 3). The coefficient of values (Table 3) indicates the maximum positive effect of osmotic solution concentration (=2.80) followed by immersion time (=2.47), temperature (=1.55), and STSR (=1.55). In this study, water loss increased with the increase in osmotic solution concentration, immersion time, temperature, and STSR and this is clearly depicted in Fig. 1(a-f). The interaction terms AB, BC, and CD have positive effect, whereas the interactions of AD, BC and CD have negative effects on water loss (Table 3). Further, the quadratic terms
of temperature, immersion time, and concentration
Table 2: CCRD design with experimental values of response variables for osmotic dehydration of chayote cubes
Exp. No.
Actual and coded values Response parameters Temp.
(ºC)
Time (min)
Conc. (%)
STSR (w/w)
Water Loss (Y1)
Solid Gain (Y2)
Rehy. Ratio (Y3)
1 30(-1) 200(1) 12.50(1) 12(1) 31.19 ±0.78 7.27 ±0.29 16.92 ±0.08
2 35(0) 180(0) 10(0) 10(0) 28.96 ±0.48 5.56 ±0.39 20.65 ±0.22
3 40(1) 160(-1) 12.5(1) 8(-1) 26.38 ±0.68 6.60 ±0.11 16.69 ±0.13
4 30(-1) 160(-1) 7.5(-1) 8(-1) 18.62 ±1.07 3.07 ±0.08 21.67 ±0.51
5 40(1) 200(1) 12.5(1) 12(1) 34.26 ±0.95 8.12 ±0.38 16.65 ±0.17
6 35(0) 180(0) 10(0) 10(0) 29.52 ±0.40 5.44 ±0.36 21.12 ±0.21
7 35(0) 180(0) 10(0) 10(0) 29.80 ±1.15 5.40 ±0.12 20.78 ±0.12
8 35(0) 180(0) 10(0) 10(0) 29.59 ±0.28 5.57 ±0.21 20.55 ±0.28
9 35(0) 180(0) 10(0) 6(-2) 24.35 ±0.64 4.20 ±0.42 19.04 ±0.13
10 35(0) 180(0) 15(2) 10(0) 30.09 ±0.42 7.80 ±0.39 18.12 ±0.13
11 40(1) 200(1) 7.5(-1) 8(-1) 28.03 ±0.89 4.78 ±0.48 17.69 ±0.08
12 40(1) 160(-1) 12.5(1) 12(1) 29.66 ±0.79 6.72 ±0.24 14.87 ±0.31
13 30(-1) 160(-1) 12.5(1) 12(1) 28.77 ±0.46 6.12 ±0.07 19.49 ±0.08
14 35(0) 180(0) 10(0) 14(2) 30.83 ±0.59 6.14 ±0.07 20.78 ±0.43
15 35(0) 220(2) 10(0) 10(0) 32.52 ±0.25 6.90 ±0.21 17.65 ±0.12
16 30(-1) 200(1) 7.5(-1) 12(1) 26.04 ±0.70 5.70 ±0.37 22.24 ±0.33
17 25(-2) 180(0) 10(0) 10(0) 22.60 ±0.62 5.04 ±0.20 18.02 ±0.07
18 40(1) 200(1) 12.5(1) 8(-1) 31.69 ±0.85 7.12 ±0.08 16.99 ±0.13
19 30(-1) 200(1) 12.5(1) 8(-1) 27.11±0.49 5.90 ±0.11 16.42 ±0.12
20 45(2) 180(0) 10(0) 10(0) 31.48±0.75 6.33 ±0.12 13.70 ±0.23
21 30(-1) 200(1) 7.5(-1) 8(-1) 24.48±0.69 5.05 ±0.06 17.95 ±0.33
22 35(0) 180(0) 5(-2) 10(0) 17.99±0.23 2.90 ±0.11 22.85 ±0.09
23 40(1) 200(1) 7.5(-1) 12(1) 28.25±0.43 5.27 ±0.23 19.44 ±0.11
24 35(0) 180(0) 10(0) 10(0) 30.18±0.19 5.30 ±0.04 20.75 ±0.13
25 30(-1) 160(-1) 12.5(1) 8(-1) 24.38±0.70 5.20 ±0.09 20.08 ±0.11
26 35(0) 140(-2) 10(0) 10(0) 22.01±0.34 4.67 ±0.24 19.32 ±0.12
27 35(0) 180(0) 10(0) 10(0) 29.55±0.29 5.55 ±0.24 20.38 ±0.23
28 40(1) 160(-1) 7.5(-1) 12(1) 22.58±0.28 3.80 ±0.10 17.02 ±0.26
29 40(1) 160(-1) 7.5(-1) 8(-1) 20.84±0.45 3.34 ±0.24 16.94 ±0.09
30 30(-1) 160(-1) 7.5(-1) 12(1) 21.55±0.66 3.75 ±0.12 22.60 ±0.13
have negative effect on water loss. The coefficient of determination R2 of 0.9846 and adj-R2 of 0.9701 for
water loss have shown that the relationship between independent and dependent variables is well fitted. The adequate precision (signal to noise ratio) was found to be 31.664, since the ratio greater than 4 is desirable for the response, which implies the best fitness of the developed model.
Table 3: ANOVA showing the variables as linear, interaction, and quadratic terms on water loss
Source df β SS F value p-value
Model 14 517.13 68.30 < 0.0001
A-Temperature 1 1.55 58.00 107.25 < 0.0001 B-Time 1 2.47 146.47 270.85 < 0.0001 C-Concentration 1 2.80 188.44 348.46 < 0.0001 D-STSR 1 1.41 47.40 87.66 < 0.0001
AB 1 0.45 3.30 6.11 0.0259
AC 1 0.096 0.15 0.27 0.6106*
AD 1 -0.32 1.66 3.07 0.1004*
BC 1 -0.51 4.15 7.68 0.0143
BD 1 -0.24 0.96 1.77 0.2036*
CD 1 0.49 3.87 7.16 0.0173
A2 1 -0.64 11.20 20.71 0.0004
B2 1 -0.58 9.32 17.23 0.0009
C2 1 -1.39 52.92 97.86 < 0.0001
D2 1 -0.50 6.90 12.76 0.0028
Residual 15 8.11
Lack of Fit 10 7.32 4.60 0.0529*
Pure Error 5 0.79 Corrected Total 29 525.25
R2 0.9846
Adjusted R2 0.9701 Adeq. Precision 31.664
*Non-significant at 5% level, df=degree of freedom, β = coefficient, SS = sum of square
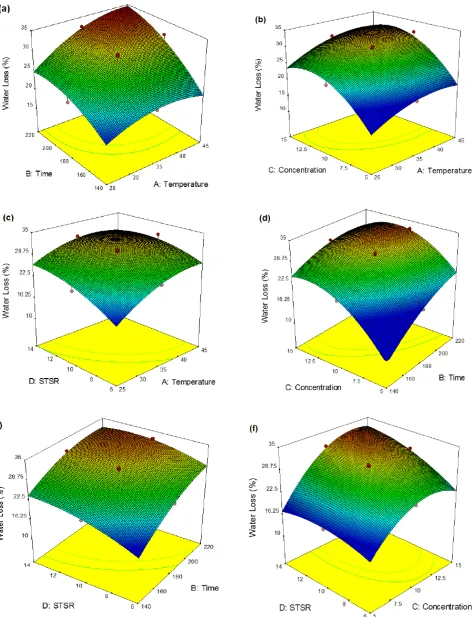
Response surface 3-D plots for WL in relation to the combination of process variables and its effects are shown in Fig. 1(a-f). The interaction effects of process variables on water loss can be explained with the help of the coefficient of equation (Eq.5). In this observation, the duration of osmosis contributed maximum WL, followed by temperature and time at specific salt concentration (Fig. 1a). It was observed that, as the temperature increased at a specific salt concentration, there was a continuous increase in water loss (Fig. 1b). However, the interactive effect of temperature and STSR showed a decreasing
effect of WL after a certain level (Fig. 1c). The negative effect of WL, followed by temperature and concentration in equation (Eq. 4.1), indicated the WL decreases with decreasing process variables (Fig. 1d). These results indicate an increase in WL with
an increase in the osmotic solution temperature
for specific concentration. Similarly, the interactive effect of concentration and STSR also showed the decreasing effect of water loss (Fig. 1e). As the salt concentration increased, water loss had maximum effect with increase in STSR and showed the positive
interaction effect of solution concentration and
STSR on WL (Fig. 1f). The minimum and maximum values of water loss were found to be 17.99% and 34.26% as showed in Table 2.
Solid Gain
The results of regression summary conducted for
the second order response surface model are given
in Table 4.
Table 4: ANOVA showing the variables as linear, interaction, and quadratic terms on solid gain
Source df β SS F
value p-value
Model 14 50.51 100.86 < 0.0001
A-Temperature 1 0.26 1.64 45.79 < 0.0001 B-Time 1 0.63 9.46 264.52 < 0.0001 C-Concentration 1 1.17 32.88 919.05 < 0.0001 D-STSR 1 0.40 3.82 106.67 < 0.0001
AB 1 -0.059 0.056 1.58 0.2284*
AC 1 0.28 1.24 34.60 < 0.0001
AD 1 -0.097 0.15 4.20 0.0584*
BC 1 -0.19 0.59 16.47 0.0010
BD 1 0.083 0.11 3.09 0.0991*
CD 1 0.071 0.080 2.23 0.1560*
A2 1 0.052 0.075 2.09 0.1690*
B2 1 0.077 0.16 4.57 0.0494
C2 1 -0.032 0.027 0.76 0.3959*
D2 1 -0.077 0.16 4.49 0.0511*
Residual 15 0.54
Lack of Fit 10 0.48 4.03 0.0686*
Pure Error 5 0.059
Corrected Total 29 51.05
R2 0.9895
3-D response surface plots of water loss
The p-values (Table 4) indicated that the all linear terms are significant, the interactions terms of AC, BC are significant, whereas the AB, AD, BD and CD are non-significant, and except B2 all the quadratic
terms are non-significant. The Model F-value of 100.86 implies the model is significant. There is only a 0.01% chance that an F-value this large could occur due to noise. The relative magnitude of β values (Table 4) indicate the maximum positive effect of osmotic solution concentration (β=1.71) followed by process duration (β=0.63), sample to solution ratio (β=0.40), and solution temperature (β=0.26). The interactive effects of AC, BD, and CD have positive effects on SG, whereas the interactive effects of AB, AD, and BC have negative effects (Table 4). The coefficient of determination R2 was 0.9895, and the
lack of fit of 0.0686 was non-significant (p>0.05), which implied that the model was adequate predicting SG. The “Lack of Fit F-value” of 4.03 implies that there is a 6.86% chance that a “Lack of Fit F-value” this large could occur due to noise. In this case, the ratio of 37.613 was found, which indicates an adequate signal. It is indicated as the best fitness of the developed model.
The effect of individual variables and their interactions on SG can be explained with the help of the coefficients of the equation (Eq. 6). As observed in the above Fig. (2a), SG decreases with the
decreasein process time and solution temperature
up to a level at specific concentration. However, when the salt concentration increased from 5 to 15%, the increase in SG was a more pronounce deffect with an increase in concentration when compared to the increase in temperature (Fig. 2b). This positive interaction effects between concentration and solution temperature was also reported by Yadav et al. (2012) during the osmotic dehydration studies on peach in sucrose solution.
The negative interactive effects of temperature and STSR in equation 23, indicates that SG decreased with a decrease in the solution temperature and sample to solution ratio (Fig. 2c). The present results are also an agreement with Manivannan and Rajasimman (2008) who observed a decrease in SG with decrease in STSR. The above Fig. 2d indicates the SG decrease with decrease in immersion time and solution concentration, which has less pronounced effect of immersion time in comparison to solution concentration. This was reported by Singh et al.,
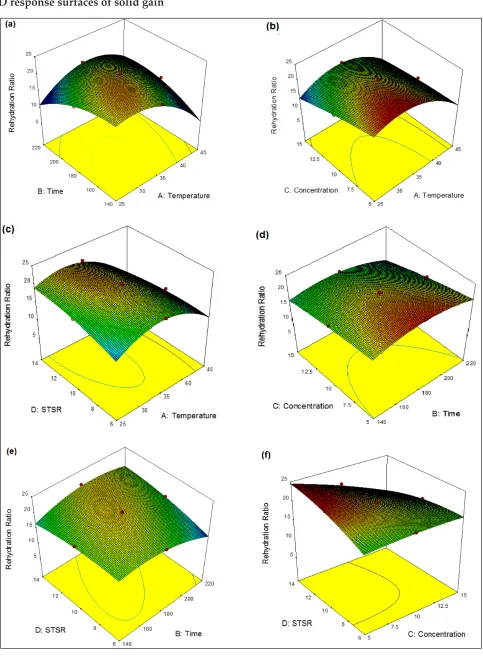
(2007) in carrot cubes using sucrose-salt solution. The positive effect of time and STSR is shown in Eq. 6, which indicates the increase of SG increase with STSR and time (Fig. 2e). However, the SG showed an increasing trend with an increase in the salt concentration as well as STSR at maximum level was observed in Fig. 2f. The SG varied from 2.9% to 8.12%, which is presented in Table 2.
Rehydration Ratio
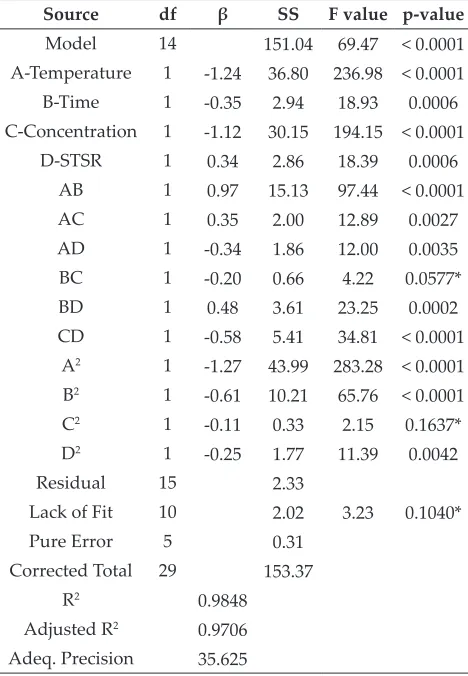
Rehydration ratio (RR) is used to measure the water absorption capacity and the leaching of solutes by the dehydrated product (Lewicki 1998). The model F-value was 69.47, which indicated that the model is significant and the lack of fit was 3.23, which implies the non-significant relative to pure error for the rehydration ratio (Table 5). The regression summary of rehydration ratio with different terms of process variables were analyzed by using analysis of variance (ANOVA) as given in Table 5.
Table 5: ANOVA showing the variables as linear, interaction, and quadratic terms on rehydration ratio
Source df β SS F value p-value
Model 14 151.04 69.47 < 0.0001
A-Temperature 1 -1.24 36.80 236.98 < 0.0001
B-Time 1 -0.35 2.94 18.93 0.0006
C-Concentration 1 -1.12 30.15 194.15 < 0.0001
D-STSR 1 0.34 2.86 18.39 0.0006
AB 1 0.97 15.13 97.44 < 0.0001
AC 1 0.35 2.00 12.89 0.0027
AD 1 -0.34 1.86 12.00 0.0035
BC 1 -0.20 0.66 4.22 0.0577*
BD 1 0.48 3.61 23.25 0.0002
CD 1 -0.58 5.41 34.81 < 0.0001
A2 1 -1.27 43.99 283.28 < 0.0001
B2 1 -0.61 10.21 65.76 < 0.0001
C2 1 -0.11 0.33 2.15 0.1637*
D2 1 -0.25 1.77 11.39 0.0042
Residual 15 2.33
Lack of Fit 10 2.02 3.23 0.1040*
Pure Error 5 0.31 Corrected Total 29 153.37
R2 0.9848
3-D response surfaces of solid gain
The p-values (Table 5) indicated that all the linear terms were significant, the interactions terms of AB, AC, AD, BD and CD were significant, whereas only BC was non-significant, and all the quadratic terms were also significant, except the term C2. The
F-values (Table 5) indicated that the most significant variable for the rehydration ratio of chayote cubes was solution temperature (F=236.98), followed by concentration (F=194.15), immersion time (F=18.93), and sample to solution ratio (F=18.39). The relative magnitude of coefficient β values (Table 5) indicated the maximum positive effect of STSR (β=0.34), and maximum negative contribution of process temperature (β= –1.24), followed by solution concentration (β= –1.12), and processing time (β= 0.35) of the rehydration ratio. It implies the decrease in rehydration ratio with an increase of process
duration, solution concentration and immersion
time, whereas it increases by increasing the STSR (Fig. 3a-f). This is because the rehydration ratio is
inversely related to the solute gain during osmotic
dehydration process, which has to be leached out during rehydration process (Singh et al. 2007). The interactive effects of AB, AC, and BD have positive effects on RR, whereas the interactive effects of AD, BC, and CD have negative effects (Table 5). The effects of all the process variables in quadratic terms were negative. The coefficient of determination R2 was found to be 0.9895 and adj.
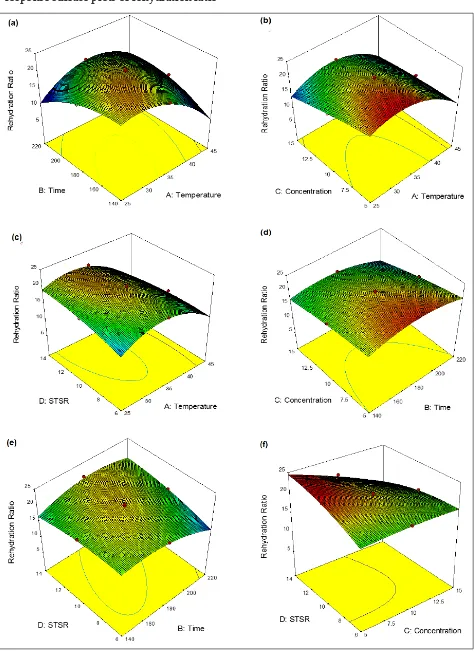
R2 was 0.9706, which represents the relationship
between the process and the response variables. The 3-D response surfaces of RR can be explained with the help of Eq. 7. The maximum RR was observed as 22.85 whereas the minimum was 13.7 in the Table 2. The increase in temperature has a significant effect on RR at constant time with maximum increase at about 45°C. However, when immersion time increased from 140 to 220 min, the RR was less effective with an increase in temperature at 220 min (Fig. 3a). Similarly, the RR increases with an increase in temperature resulting with more effect in RR at particular salt concentration up to 45°C (Fig. 3b). However, this increasing effect of temperature on RR was less pronounced with an increase in salt concentration. These results of interaction effects were observed by Singh et al., (2007) in carrot cubes during osmotic dehydration. As observed in Fig. 3c, the RR decreases with the decrease in immersion time and STSR. However,
the effect of osmotic dehydration on RR has less pronounced effect due to the decrease in time and concentration (Fig. 3d). The Fig. 3e indicates the positive effect on RR with an increase in immersion time and STSR during osmotic dehydration. On the other hand, the RR increases with a decrease in solution concentration and STSR (Fig. 3f). Similar results were also reported by Tiroutchevame et al. (2015) in amla using sugar solution during osmotic dehydration.
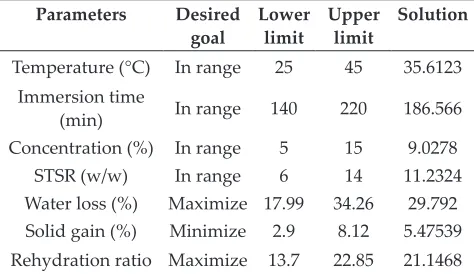
Table 6: Optimization criteria for different factors
and responses and solutions for optimum conditions
of osmo-convective dehydration of chayote cubes
Parameters Desired
goal Lower limit Upper limit Solution Temperature (°C) In range 25 45 35.6123
Immersion time
(min) In range 140 220 186.566
Concentration (%) In range 5 15 9.0278
STSR (w/w) In range 6 14 11.2324
Water loss (%) Maximize 17.99 34.26 29.792 Solid gain (%) Minimize 2.9 8.12 5.47539 Rehydration ratio Maximize 13.7 22.85 21.1468
Optimization
Optimum process conditions for osmotic
dehydration of chayote was determined to obtain maximum water loss, rehydration ratio and minimum solid gain by the numerical optimization techniques in combination with the design expert software. In this study, the second order polynomial models were utilized for each response in order to obtain the specified optimum condition for the parameters. The desired goals were set in response
to their process conditions and the response for
optimization. The optimum operating conditions for
process temperature, immersion time, concentration
and sample to solution ratio (STSR) were 35.61, 186.56 min, 9.02% and 11.23 (w/w), respectively. The optimum values of process parameters in these conditions were water loss 29.79 g water loss/100 g of fresh chayote cubes, 5.47 g solid gain/100 g fresh chayote cubes and rehydration ratio 21.14.
CONCLUSION
3-D response surface plots of rehydration ratio
gain, and maximum rehydration ratio in osmotic dehydration of chayote cubes using statistical software Design Expert 9.0.6.2. The effects of all the process variables including solution temperature, immersion time, concentration and STSR have shown the linear terms in regression summary equations of the second order polynomial which were statistically significant. In this study, Optimum solutions of operating process conditions were 35.61°C osmotic solution temperature, 186.56 min immersion time, 9.02% salt concentration, and 1:11.23 STSR to obtained maximum water loss (WL), and rehydration (RR) and minimum solid gain (SG). The optimum values for response parameters of WL, RR and, SG, were found to be 29.79%, 21.14, and 5.47%, respectively.
REFERENCES
Akonor, P.T. and Tortoe, C. 2014. Effect of blanching and osmotic pre-treatment on drying kinetics, shrinkage and rehydration of chayote (Sechium edule L.) during convective drying. Br. J. Appl. Sci. Technol., 4(8): 1215-1229. Alakali, J.S., Ariahu, C.C. and Kpa, N.N.N. 2006. Kinetics of
osmotic dehydration of mango. J. Food Process. Preserv., 30: 597–607.
Cadena-Iniguez, J., Arevalo-Galarza, L., Ruiz-Posadas, L.M., Aguirre-Medina, J.F., Soto-Hernandez, M., Luna-Cavazos, M. and Zavaleta-Mancera, H.A. 2006. Quality evaluation and influence of 1-MCP on Sechium edule (Jacq.) Sw. fruit during postharvest. Postharvest Biol. Technol., 40(2):
170–176.
Devic, E., Guyoi. S., Daudin, J. and Bonazzi, C. 2010. Effect
of temperature and cultivar on polyphenol retention and
mass transfer during osmotic dehydration of apples. J. Agric. Food Chem., 58: 606–614.
Eren, I. and Kaymak-Ertekin, F. 2007. Optimization of
osmotic dehydration of potato using response surface
methodology. J. Food Eng., 79: 344–352.
Ispir, A. and Togrul, T.I. 2009. Osmotic dehydration of apricot: Kinetics and the effect of process parameters. Chem. Eng. Res. Des., 78: 166–180.
Jackson, T.H. and Mohamed, B.B. 1971. The shambat process: new development arising from the osmotic dehydration of fruits and vegetables. Sudan J. Food Sci. Technol., 3: 18–22. Jokic, A., Gyura, J., Levic, L. and Zavargo, Z. 2007. Osmotic
dehydration of sugar beet in combined aqueous solutions of sucrose and sodium chloride. J. Food Eng., 78: 47–51. Khuri, A.I. and Cornell, J.A. 1987. Response Surfaces Design
and Analysis; Marcel Dekker: New York.
Lazarides, H. N., Katsanidis, E. and Nickolaidis, A. 1995. Mass transfer kinetics during osmotic preconcentration aiming at minimal solid uptake. J. Food Eng., 25: 151–166.
Lira-Saade, S. 1996. Promoting the conservation and use of underutilized and neglected crops. 8. Chayote. Sechium edule (Jacq.) Sw.; Institute of Plant Genetics and Crop Plant Research, Gatersleben=International Plant Genetic Resources Institute: Rome, Italy.
Mannan, S., Fakhrul-Razi, A. and Alam, Z. 2007. Optimization of process parameters for the bioconversion of activated sludge by Penicilliumcorylophilum, using response
surface methodology. J. Environ. Sci., 19: 23–28.
Manivannan, P. and Rajasimman, M. 2008. Osmotic
dehydration of beetroot in salt Solution: Optimization of parameters through statistical experimental design. Int. J. Chem. Mol. Nacl. Mater. Metall. Eng., 2(1): 11–18.
Mavroudis, N.E., Gekas, V. and Sjoholm, I. 1998. Osmotic dehydration of apples-effects of agitation and raw material characteristics. J. Food Eng., 35: 191–209. Mazza, G. 1983. Dehydration of carrots. Effects of pre-drying
treatments on moisture transport and product quality. J. Food Technol., 18: 113–123.
Ordonez, A.A.L., Gomez, J.D., Vattuone, M.A. and Isla, M.I. 2006. Antioxidant activities of Sechium edule (Jacq.) Swartz extracts. J. Food Chem., 97: 452–458.
Ozen, B.F., Dock, L.L., Ozdemir, M. and Floros, J.D. 2002. Processing factors affecting the osmotic dehydration of diced green peppers. Int. J. Food Sci. Technol., 37: 497–502. Perez-Francisco, J.M., Cerecero-Enrıquez, R., Andrade-Gonzalez, I., Ragazzo-Sanchez, J.A. and Luna-Solano, G. 2008. Optimization of vegetal pear drying using response surface methodology. Drying Technol., 26(11): 1401–1405. Ponting, J.D. 1973. Osmotic dehydration of fruits: Recent
modifications and applications. Process Biochem., 8: 18–22. Rajasimman, M. and Subathra, S. 2009. Optimization of
gentamicin production: Comparison of ANN and RSM techniques. Int. J. Nat. Eng. Sci., 2: 32–37.
Rosa, M.D. and Giroux, F. 2001. Osmotic treatments and problems related to the solution management. J. Food Eng., 49: 223–236.
Ruiz-Lopez, I. I., Huerta-Mora, I. R., Vivar-Vera, M. A., Martnez-Sanchez, C. E. and Herman-Lara, E. 2010. Effect of osmotic dehydration on air-drying characteristics of chayote. Drying Technol., 28(10): 1201–1212.
Sablani, S.S.; Rahman, M.S.; Al-Sadeiri, D.S. 2002. Equilibrium distribution data for osmotic drying of apple cubes in sugar-water solution. J. Food Eng., 52: 193–199.
Borah, A., Sethi, L. N., Sarkar, S. and Hazarika K. 2017. Effect of Drying on Texture and Color Characteristics of Ginger and Turmeric in a Solar Biomass Integrated Dryer. J. Food Process Eng., 40(1).
Sarkar, S., Kumar, A., Kumar, D., Sethi, L.N., Hazarika, M.M. and Das, G. 2015. Optimal Size of Fish Pond for Socio-Economical Development of Cachar (Assam). Int. J. Agric. Environ. Biotechnol., 8(2): 405–411.
sugar-salt solutions using response surface methodology. Eur. Food Res. Technol., 225: 157–165.
Singh, B., Panesar, P.S. and Nanda, V. 2008. Optimization of osmotic dehydration process of carrot cubes in sucrose solution. J. Food Process Eng., 31: 1–20.
Singh, B., Panesar, P.S. and Nanda, V. 2008. Osmotic dehydration kinetics of carrot cubes in sodium chloride solution. Int. J. Food Sci. Technol., 43: 1361–1370.
Singh, B., Panesar, P. S., Nanda, V. and Kennedy, J.F. 2010. Optimization of osmotic dehydration process of carrot cubes in mixtures of sucrose and sodium chloride solutions. J. Food Chem., 123: 590–600.
Tiroutchelvame, D., Sivakumar, V. and Prakash Maran, J. 2015. Mass transfer kinetics during osmotic dehydration of Amla (Emblica officinalis L.) cubes in sugar solution. Chem. Ind. Chem. Eng. Q., 21: 1–26.
Uddin, M. B.; Ainsworth, P.; Ibanoglu, S. 2004. Evaluation of mass exchange during osmotic dehydration of carrots using response surface methodology. J. Food Eng., 65 (4): 473-477.
Yadav, B.S., Yadav, R.B. and Jatain, M. 2012. Optimization of
osmotic dehydration conditions of peach slices in sucrose