of peer-reviewed research and commentary in the population sciences published by the Max Planck Institute for Demographic Research Konrad-Zuse Str. 1, D-18057 Rostock · GERMANY www.demographic-research.org
DEMOGRAPHIC RESEARCH
VOLUME 22, ARTICLE 32, PAGES 1015-1036
PUBLISHED 04 JUNE 2010
http://www.demographic-research.org/Volumes/Vol22/32/ DOI: 10.4054/DemRes.2010.22.32
Research Article
How do employers cope with an ageing
workforce? Views from employers and
employees
Hendrik P. van Dalen
Kène Henkens
Joop Schippers
© 2010 van Dalen, Henkens & Schippers.
This open-access work is published under the terms of the Creative Commons Attribution NonCommercial License 2.0 Germany, which permits use, reproduction & distribution in any medium for non-commercial purposes, provided the original author(s) and source are given credit.
1 Introduction 1016
2 Background: an ageing labour market 1017
3 Theoretical background 1018
4 Method and data 1021
5 Employers, ageing and personnel policy 1022
6 So what do employers do if their employees perform poorly? 1028
7 Conclusion and discussion 1031
Research Article
How do employers cope with an ageing workforce?
Views from employers and employees
Hendrik P. van Dalen1 Kène Henkens2 Joop Schippers3
Abstract
How age-conscious are human resource policies? Using a survey of Dutch employers, we examine how employers deal with the prospect of an ageing work force. We supplement our analysis with an additional survey of Dutch employees to compare human resource policies to practices. Results show that a small minority of employers are taking measures to enhance productivity (training programmes) or bring productivity in line with pay (demotion). Personnel policies tend to ‘spare’ older workers: giving them extra leave, early retirement, or generous employment protection: older workers who perform poorly are allowed to stay, whereas younger workers under similar conditions are dismissed.
1 Netherlands Interdisciplinary Demographic Institute (NIDI). P.O. Box 11650, NL-2502 AR The Hague, The
Netherlands. E-mail: [email protected].
Tilburg University, Department of Economics.
2 Netherlands Interdisciplinary Demographic Institute (NIDI). E-mail: [email protected].
Tilburg University, Department of Sociology.
3 University of Utrecht, Utrecht School of Economics, Janskerkhof 12, NL - 3511 BG Utrecht,
1. Introduction
Extending people’s working life is seen as a key element in dampening or curtailing the rising costs associated with an ageing population. In the OECD countries, many initiatives are aimed at delaying retirement and supporting the labour force participation of older workers. At the government level, these initiatives vary from pension reforms that limit opportunities for an early exit from the workforce, to legislation against age discrimination and public campaigns to combat negative stereotyping in the workplace. At the organisational level, employers are urged to develop policies geared towards increasing the employability of older workers, for instance through life-long learning programs. However, government initiatives may not achieve their goals if proposals to extend the working life of older workers are not actively supported by employers. Vickerstaff, Cox and Keen (2003), state that any significant change in retirement behaviour will come primarily from changes in employer policies. Yet how employers go about dealing with an aging labour force remains unclear and thereby casts some serious doubts on the effectiveness of such policies in raising the labour force participation of older workers.
In this paper we examine how Dutch employers deal in practice with older workers. The Dutch labour market offers interesting case material. On the one hand, the Dutch government has implemented substantial reforms aimed at restricting early exit from the labour force by abolishing the fiscal facilities for the arrangement of early retirement (Euwals, De Mooij and Van Vuuren 2009). Moreover, successive government campaigns have been launched in the past decades to increase the retirement age to correspond with increases in life expectancy. By looking at human resource management within organisations, we are able to identify whether activating public policy measures are accompanied by activating personnel policies within organisations. In other words, do employers practice what the government preaches? In this study we distinguish between official Human Resource Management (HRM) policy, as set down in collective labour agreements between employers and employees, and informal policies, as reflected in the way in which employees are treated by employers as employees become less productive.
survey we sought to identify employers’ actual behaviour towards older and younger employees.
This paper is structured as follows: in the next section we address some key features of the ageing labour force in the Netherlands. In the subsequent section we expand on the theoretical background of the relationship between age, productivity and wages. The results are subsequently presented and we conclude with a summary of our main findings and a discussion.
2. Background: an ageing labour market
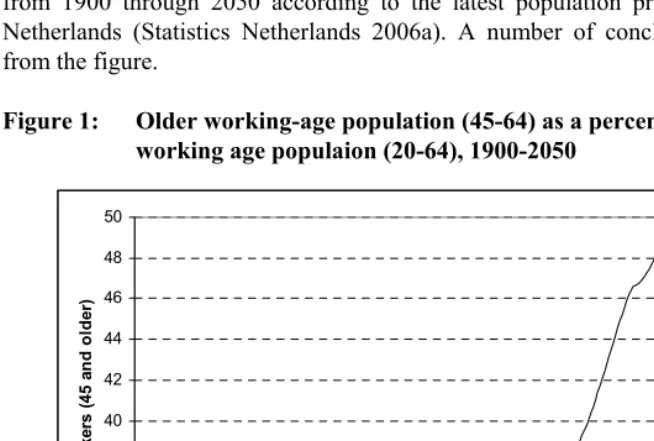
Figure 1 clearly shows the extent to which the labour market will age in the future. It presents the number of older workers as a percentage of the working age population from 1900 through 2050 according to the latest population projections of Statistics Netherlands (Statistics Netherlands 2006a). A number of conclusions can be drawn from the figure.
Figure 1: Older working-age population (45-64) as a percentage of the total working age populaion (20-64), 1900-2050
30 32 34 36 38 40 42 44 46 48 50
1900 1910 1920 1930 1940 1950 1960 1970 1980 1990 2000 2010 2020 2030 2040 2050
%
ol
de
r
w
o
rk
er
s (
45
a
n
d
o
lde
r)
A first observation is that an ageing labour force is not a unique phenomenon in the history of the Netherlands. A similar phenomenon was apparent in the 1950s, but the trend was abruptly halted as the post-war baby boomers flocked to the labour market. Note, however, that the magnitude and effect of the current and future ageing process differs substantially from that of the 1940s and 1950s. The process towards an ever-younger labour market, which started in the 1960s, came to an end in the early 1990s when the first baby boomers turned 45. The ageing of the labour market that has been occurring since the 1990s is set to continue through around 2010, when almost half the population of working age will be 45 years old or older. The finding that the average age structure of the working age population will decline after 2020 is the result of the large cohorts of post World War II baby boomers reaching the age of 65 and leaving the potential workforce. Figure 1 presents the long-term demographic outlook through the year 2050 for the Dutch labour market and this outlook suggests that employers will face a permanently older labour force.
3. Theoretical background
The basic conundrum of firms dealing with an ageing work force is the wage-productivity gap. If the wages of older workers exceed their wage-productivity, older workers represent a potential loss for firms. A starting point for examining the relationship between age and productivity is generally found in human capital theory (Becker 1962). In a nutshell, productivity is positively related to the human capital that an individual accumulates over his or her lifetime. Just like physical capital, human capital depreciates and in order to enlarge the human capital stock investments have to be made, either firm-specific or of a general nature. It is generally perceived that beyond a certain age investments slow down and as a consequence the human capital stock decreases and so does the average level of productivity of workers at the end or their career. The depreciation may be of biological nature or it may be economically based, when the old do not keep up with technological developments and knowledge of a certain vintage becomes less useful or outdated. The age at which the productivity slowdown sets in is hard to observe or generalise as human capital is a mixture of formal knowledge, generally accumulated at the start of a career, but also informal, tacit knowledge which accumulates with experience. Skirbekk (2008) provides a rich overview of how age impacts on the various physical and cognitive skills of workers.
1989). Thurow (1975) was one of the first to suggest that whilst wage income and productivity are related, they are not necessarily related at every single moment in a worker’s career. He explained that employers have an understanding – an implicit contract – with their employees regarding the relationship between productivity and earnings during the course of their careers. This understanding, Thurow stated, is based on the seniority principle, such that during the first phase of workers’ careers their earnings are lower than their productivity and during the second phase their earnings are higher than their productivity. He explained that the prospect of a gradual rise in income acts as an incentive for employees to continue working for that specific employer, where their investments yield the highest returns.
Lazear (1979) stressed that this implicit contract is bound to be unsustainable if workers work beyond the age at which the net present value of wages exceeds that of the productivity profile. Therefore, employers will either opt for mandatory retirement schedules or the use of private pension schemes which penalise continued employment beyond a certain age. The trouble with these types of implicit contracts is that the sustainability of the contract is negatively affected by the ageing of the population. Lazear (1990) later made this explicit in stating that population ageing challenges the financing of delayed payment contracts by firms. In the Netherlands seniority based wage systems are a common phenomenon, resulting in age-wage profiles across the lifecourse which are steeper than the age-productivity profile (Kalmijn and Alessie 2008; OECD 2006). Figures from the OECD suggest that this element in Dutch wage systems is stronger than in other European countries such as the UK. Work force ageing increases the incentives of firm owners to either decrease the wages of older workers or lay them off. An additional complication is that age-related fringe benefits (e.g., extra leave or exemptions from working overtime) further increase the labour costs of older workers. The central policy question for firms is how to deal with an ageing work force: Do firms invest in older workers, in order to increase productivity at higher ages? Or do firms aim to rebalance wages and productivity by means of demotion or laying off older workers?
A complication in designing these policies is that the productivity of workers is hard to measure and is often based on stereotypical views4. It is well documented in the
literature that many stereotypes prevail among employers regarding the productivity of
4 Empirical analysis of Dutch individual firm data by Gelderblom, De Koning and Kroes (2005) shows that
older workers (Chiu et al. 2001; Finkelstein, Burke and Raju 1995; Hassell and Perrewe 1995; Henkens 2005; Lee and Clemons 1985; Loretto, Duncan and White 2000; Remery et al. 2003; Taylor and Walker 1998).
A recent study by van Dalen, Henkens and Schippers (2010) revealed that two dimensions were found to underlie perceptions of productivity: stereotypes about hard qualities and stereotypes about soft qualities. Hard qualities refer to qualities such as flexibility, physical and mental capacity, the willingness to learn and new technology skills. Soft qualities refer to qualities such as commitment to the organization, reliability and social skills. The comparative advantage of the older worker (50 years and older) lies primarily in their soft skills, whereas the comparative advantage of younger workers lies primarily in their hard abilities. However, the weights attached to the hard and soft qualities of productivity differ substantially. Hard qualities carry a much greater weight in the evaluation of worker productivity than soft qualities. This is true for the evaluation of the productivity of older and younger workers, alike.
Age-related stereotypes may be partially accurate, or at least accurate of the local reality to which the perceiver is exposed (Judd and Park 1993). Stereotypes may, however, also lead to the social exclusion of older workers, not only because employers may judge employees on the basis of average and inaccurate representations, but also because stereotypes may lead to self-fulfilling prophecies, when those who are subject to negative stereotypes behave according to those stereotypes (Hilton and Von Hippel, 1996). Negative age-related stereotypes among employers may influence employers’ policies toward older workers. Chiu et al. (2001) showed that the more respondents perceive older workers as being able to adapt to change, the more favorable their views are on training of older workers. Henkens (2005) showed that negative stereotypes toward older workers stimulated managers’ support for early retirement.
4. Method and data
This study used three data sources to answer the research questions. First, we carried out a survey among Dutch employers. A random sample of companies in the Netherlands was drawn from the trade register of the Chamber of Commerce. To include enough large organisations the sample was stratified by size band: companies with 100 or more employees were oversampled. The sample of private companies consisted of 3,377 companies with at least 10 employees. The sector breakdown of the trade register followed the NACE, the classification of economic activities developed by the European Union. Because few public health sector organizations are included in the Chamber of Commerce register, these organisations were selected from different sources. All 462 Dutch municipalities (registration May 2005) were included in the sample, together with 78 general hospitals registered in the digital version of Pyttersen’s Almanak (registration May 2005). In addition, all 13 ministries of the national government in The Hague were included. The total sample is comprised of 3,930 organizations with at least 10 employees. Total response rate was 15.2 percent (n=597), comparable to the response rate of other employer surveys. Response rates for surveys in Europe and the United States tend not to exceed 20 to 30 percent (see for example Brewster et al., 1994; Kalleberg et al., 1996). Respondents were addressed in the questionnaire as employer.
Questionnaires were completed by a board member/managing director (15 percent), the owner (13 percent), plant manager (8 percent), head of human resources department (38 percent), member of the human resource department (17%) and other (9%). Of the 597 respondents, 56% were males and 44% were females. They varied in age between 19 and 69 years, with a mean age of 43 years (SD= 9.6); one third (28%) of the respondents were 50 years or older. The types of industrial sectors varied from the manufacturing/construction sector (25%), and the service sector (banking, transport, insurance, trade, hotels and restaurants) (40%) to the public sector (35%).
important for the meetings to be facilitated by trained discussion leaders. In this study we opted to hold the focus group meetings across the country in view of the differences in the local labour market situations. The population in some regions in the Netherlands has aged more than in others.
Finally, we carried out a survey among Dutch employees in 2007. Data were collected by the CentERdata Institute of Tilburg University, which maintains a representative Internet-based panel of two thousand households in the Netherlands. The response rate for our survey was 70 percent of the panel participants. All Dutch respondents between 20 and 60 years of age were included in the analysis. Furthermore, we only included workers who were defined as employees according to the definition proposed by the Labor Force Survey of Statistics Netherlands (Statistics Netherlands 2006b). The final employee data set included 896 observations. That does not include, self-employed, owners of companies, and those working in family businesses. We did not have information on whether the employee had a supervisory position in their organisation. However, the respondents were addressed in the questionnaire as employee. Furthermore, the sample was restricted to employees in the prime working age range between 20 and 65 years. The age of 65 is the statutory retirement age in the Netherlands at which one is eligible for a public pension. In most sectors of industry retirement from the labour force is mandatory at this age. Of the 896 employees, 58% were males and 42% were females. The mean age was 43 (SD= 10.2); one third (30%) of the employees were 50 years or older. The types of industrial sectors varied from the manufacturing/construction sector (23%), and the service sector (banking, transport, insurance, trade, hotels and restaurants) (33%) to the public sector (45%). To rule out the possibility of two or more respondents from the same household and their reciprocal influence in stating preferences, we included only one member per household - either the head of household or the head of household’s partner.
5. Employers, ageing and personnel policy
When interpreting employers’ personnel policies for older workers we first need to gain insight into their views about the implications of an ageing workforce. Table 1 sets out how employers see the relationship between age, productivity and labour costs.
respondents. This test revealed that there are no significant differences between young and old respondents regarding the perception of the ageing-productivity relationship. However, older respondents are somewhat less likely (correlation r = 0.09; p<0.05) to expect an increase in labour costs as a result of an ageing workforce.
Table 1: Expected implications of a substantial increase in the average age of the workforce for the organisation, according to employers
(percentages; N=597)
Increase in labour costs Rising productivity
Highly unlikely 1 11
Unlikely 5 41
Neutral 17 42
Likely 55 6
Very likely 21 1
Total 100 100
Source: Employer Survey NIDI-UU (2005).
An important question is what implications these employers’ perceptions have for organisational policies. Are the policies focused on bringing the costs and benefits of older workers into equilibrium, and what measures are implemented to reach this new balance? To examine these questions, we look into policies set down in collective labour agreements, as well as policies developed by individual organisations. The survey results will be placed in perspective by relating them to the insights gained during the focus group meetings.
The employers were presented with a list of measures and asked to indicate whether their organisation was implementing these measures, or was considering doing so. The list was based on earlier research into age-conscious personnel policies (Remery et al., 2003). Table 2 presents the results.
older workers was mentioned less frequently. The number of organisations offering a proactive policy for older workers, such as training programmes for older staff, was surprisingly low. Measures aimed at reviewing older workers’ productivity and remuneration, ultimately reducing them to a lower rank and a loss of salary, commonly known as demotion, were also found to be almost absent – present at no more than seven percent of organizations. Two kinds of measures were related to the potential benefits of older workers. One third of all employers use older workers as coaches or mentors for younger workers. And more than half of the employers (52 percent) are considering doing so. However, several participants of the focus group meetings reported that their organisation lacks sufficient jobs where older workers can act as coaches. Working in age-diverse teams was implemented by one quarter of the organisations. Of course, this does not necessarily imply the absence of such teams at other firms, but the other organisations do not actively promote this as a measure aimed at older staff. All in all, organisations do their best to accommodate the needs of their older workers, but they are not very active in increasing older workers’ productivity. Moreover, they are not inclined to look for the potential benefits of older workers’ experience.
Table 2: Policies applied by employers for older staff (%; n = 597)
Measure Is currently
applied
Will be considered
Will not be considered
Additional leave 56 27 17
Ergonomic measures 49 38 13
Part-time retirement 46 29 25
Using older workers for coaching 33 52 15
Reducing workload 32 51 16
Age limits for irregular working hours / shift work
30 26 44
Exemption from working overtime 28 33 38
Flexible working hours 27 41 32
Performance assessments aimed at career termination
26 56 18
Working in mixed-age teams 25 45 30
Training programmes 13 46 40
Career interruptions 9 33 58
Demotion 6 41 53
Source: Employer Survey NIDI-UU (2005)
workload; (b) demotion; and (c) implementation of special training programmes. These three policies differ in their emphasis on either: (a) reducing workload, (b) reducing labour costs, or (c) increasing productivity. The last two measures are designed to close the gap between wage and productivity and are often mentioned by policy makers as a potential solution to the conundrum of an ageing work force. However, the enthusiasm among employers and employees is considerably less than the enthusiasm with which policy makers embrace these measures. In Table 3 these policy measures have been linked to the size of organisation, the sector in which the organisation operates, and the composition of the workforce by education, age and sex.
Table 3: Results of multivariate logit analysis to explain organisational human resource policies (0 = not implemented; 1= implemented as a policy measure)
Reducing older
workers’ workload
Demotion of older workers
Training programme for older workers Coefficient t-value Coefficient t-value Coefficient t-value Manufacturing/construction
(reference category)
Service industry -0.20 -0.76 -0.07 -0.13 0.48 1.22
Public sector 0.57 1.69 -0.08 -0.11 0.49 1.03
Size of organisation 0.41* 3.02 0.63* 2.37 0.54* 2.91 Percentage 50-plus 0.14* 1.96 0.40 0.27 0.44 0.42 Percentage higher educated 0.22 0.57 1.44* 2.20 0.77 1.56 Percentage women 0.64 1.13 0.32 0.30 0.89 1.15 Percentage part-time workers -1.39* -2.55 0.05 0.05 -1.20 1.62
Constant -1.80** -4.99 -4.68** -5.84 -3.60** -6.58
Pseudo R2 0.06 0.05 0.04
N = 597 597 597
* significant p<0.05; ** significant p<0.01 Source: Employer Survey NIDI-UU (2005)
There is an inherent logic to this: most participants in the focus group meetings felt that demotion was an unsuitable instrument for lesser-educated employees in direct productive jobs given that lower-educated employees form the lowest level in an organisation’s job structure already.
The discussion with and between employers in the focus groups showed that demotion is a sensitive issue. Many employers feel that demotion should, in theory, be possible yet actual practice proves otherwise. Employers point out first of all that employees are little inclined to take a step back. And those employees who are
prepared to take a step down in terms of their position and duties tend not to be willing to do so in terms of their employment conditions. The implications for their pensions and pension accrual is a particularly sensitive case in point, say employers. Many employees still mistakenly think in terms of a final pay pension system, where pensions are based on the last-earned salary. That said, employees’ limited willingness to take a step back financially tends to be fairly well understood by employers: “You can hardly expect a man of sixty with an 18-year-old and a 21-year-old child at university and a large mortgage on his home to take a step down”. And various employers indicated that if they do actually demote older workers they do so by temporarily freezing their salaries “until the employee ends up in a lower pay scale after having missed out on a number of wage increases”. Alternatively, an employer points out that highly educated and well-paid employees often like to hold onto their status and therefore “don’t want to take a step down to a lower position” despite their greater financial leeway. Moreover, some employers fear that demotion of former managers may result in unclear hierarchical relations within the organisation. A number of employers argue that demotion should be stripped of its double negative connotation: back and lower. These same employers do not know, however, how this negative connotation could be avoided.
With respect to their company’s training policies, employers said that on the whole, older workers are little inclined to engage in additional training and development. Others pointed out that older workers are not particularly keen to reveal their shortcomings in training sessions with young colleagues. Some employers, however, commented that there were other, successful routes along which older workers could acquire new knowledge, skills and competencies, such as through traineeships or temporary secondment to another location or company in the same sector of industry. There appeared to be general consensus that given the huge variation in life courses and life experience, updating the knowledge of older workers requires a tailor-made approach and that mapping out the best route to achieving this should also be customised.
“Because you are old, you don’t have to do that anymore”. The participants almost unanimously agreed, however, that an accommodating policy was appropriate in cases where it was really necessary to spare older workers, for example because their work was too physically taxing. A number of employers were very displeased with dynamic employees in their fifties who no longer wish to work overtime or night shifts on the basis of their age alone, or who are no longer allowed to do so under their collective employment agreement. As a result, “this kind of work always needs to be done by younger employees for whom this is also a great burden”, said a personnel manager in the health sector.
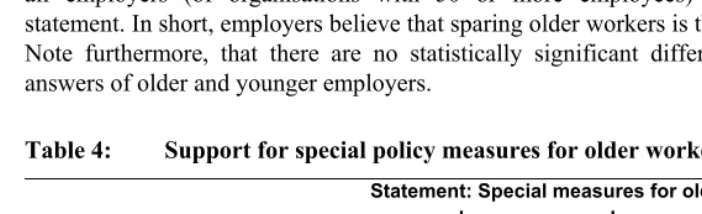
Another disadvantage of such accommodations are the costs involved. In addition to the drawbacks of an overly generous package of accommodating measures formulated by the employers themselves, they also pointed out – as shown by the answers to one of the survey questions – that they sensed some dissatisfaction among their staff. Twenty percent of the employers agreed with the statement 'Special measures for older workers make younger employees envious". Table 4 shows that criticism of measures that spare older workers came mainly from young employees in small companies. However, it is striking to see that far more employers disagree or are neutral with respect to this statement, especially in larger firms. Approximately half of all employers (of organisations with 50 or more employees) disagree with the statement. In short, employers believe that sparing older workers is the right thing to do. Note furthermore, that there are no statistically significant differences between the answers of older and younger employers.
Table 4: Support for special policy measures for older workers Statement: Special measures for older workers
make younger employees envious
Size of the organisation Disagree Neutral Agree
Percentages
Less than 50 employees 39 35 26
50-200 employees 51 30 19
More than 200 employees 49 36 15
Total 47 33 20
6. So what do employers do if their employees perform poorly?
Both the survey and the focus group meetings with employers showed that they set great store in optimally employing their staff. In order to see how employers actually behave one has to think of a counterfactual situation that offers insights into how an age conscious policy really works out. Most organisations reported having older employees who fail to perform adequately and for whom traditional policy measures do not work. How do employers then deal in practice with those older workers, and more importantly, how are the actions of the employer received by employees, both young and old? As noted above, employers see no fault in giving older workers a break when they are not functioning well. Poor performance is not necessarily related to age, but the way in which organisations respond to poor performance may well differ depending on whether the employee is young or old. Usually poor performance is much more costly in case of older workers, who have climbed the job ladder and are at the end of their career, than in case of younger workers, who are still at the beginning of their career. Underperformance of older workers may also be related to the Peter Principle, or as the originators of the principle, Peter and Hull (1969) state: "In a hierarchy every employee tends to rise to his level of incompetence". In other words, workers are promoted until they reach the job level that is just beyond their capacities. Workers who are good in one job are not necessarily good in the job into which they are promoted. As a result, individuals may appear incompetent in the job in which the settle. 5
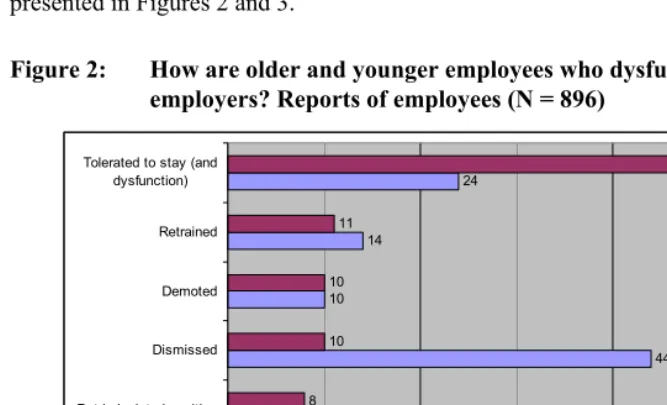
To get insight into the personnel policy actions of employers, we asked employees about the way in which employers deal with employees whose performance is under par. The reason we asked employees and not employers about these policy responses is that employers might be inclined to give a biased picture of organizational behaviour toward underperformance. In order to gain more insight into everyday practice, employees were asked the following question: “Every organisation has employees who perform above average and others who perform below. How does your own organisation treat employees over age 50 whose performance is not up to par?” We presented six policy responses toward underperformance: workers are (1) “Tolerated to stay (and function under par)”, (2) “Retrained”, (3) ”Demoted”, (4) ”Dismissed”, (5) ”Put in an isolated position”, or (6) ”Promoted out of sight”. Then the employees were asked: “To what extent do you find this a satisfactory solution?” Both questions were
5 Lazear (2004) argues however that the difficulty in observing (in)competence is that part of the observation
also asked for staff aged 35 or under (denoted as younger workers). The answers are presented in Figures 2 and 3.
Figure 2: How are older and younger employees who dysfunction treated by employers? Reports of employees (N = 896)
4 3
44 10
14
24
7 8
10 10 11
53
0 10 20 30 40 50 60
Promoted 'out of sight' Put in isolated position Dismissed Demoted Retrained Tolerated to stay (and
dysfunction)
Old Young
Source: NIDI Employee Survey, March 2007.
with ‘demotion’ is substantially higher among older employees (correlation r=0.27; p<0.05) than among younger employees. Dissatisfaction with ‘promotion out of sight’ is substantially higher among younger employees (correlation r=0.37; p<0.05).
Figure 3: Percentage of employees who find the solution opted for dissatisfactory N = 896)
59 63 12
9 6
71
59 63 32
21 9
54
0 10 20 30 40 50 60 70 80
Promoted 'out of sight' Put in isolated position Dismissed Demoted Retrained Tolerated to stay (and
dysfunction)
% who finds solution dissatisfactory
Old Young
Source: NIDI Employee Survey, March 2007.
The focus group meetings also showed that employers are often inclined to be lenient towards underperforming older workers. A number of employers felt that you cannot simply fire older workers who can no longer keep up on the grounds of services rendered and loyalty they have shown to the firm. Others were more harsh: “Those who can’t keep up, must eventually leave.” Both categories of employers agree that this tolerant attitude is not applied in the case of job applicants. An employer in a production company did not mince words, succinctly typifying the situation as: “bad enough having to deal with your own cripples”.
them to step on the pedal for two months only to subsequently come to a complete standstill”.
The organisations under study hardly had any true job mobility policies for older employees and any individual initiatives that were reported to be potentially effective ran up against practical problems. A school principal, for example, who felt that, in theory, it would be possible to rotate teachers between the educational institute’s various locations remarked that “if the other school is situated in a town fifty kilometres away, we would face the problem that people are not prepared to travel back and forth.” However, an employer in the health care sector reported a successful initiative: “We have started a club of employers who get together once every few months to see whether one of us is able to offer one of our older workers a job. This works very well now that the labour market situation is improving. We sometimes have to go to the trouble of finding suitable people who we can ‘put on offer’ as it were”. Employers of small organisations point out that regional networks of this kind can be particularly helpful for small companies because while mobility within their own firm is limited, together they have access to a greater variety of jobs.
Developing a suitable mobility programme is even more difficult for specialist jobs. “Surgeons, for example, have spent many years at university to get where they are, but there are surgeons, of course, who at some point in their careers no longer enjoy the work they do, or can no longer cope, or are looking for something different. People don’t talk about these things, but it is a problem,” said a hospital manager. An employer in the business world described a slightly different situation: “Chartered accountants or tax advisors will continue to do the same work. They won’t suddenly become a notary public, for example. That said, they do have different types of customers. What you need to do, then, is make sure that they develop themselves within the job they have. You could see this as a form of mobility.”
7. Conclusion and discussion
opportunities of older workers in the Dutch labour market (Euwals, De Mooij and Van Vuuren, 2009). Employers are especially sceptical about the application of measures imposed by the government or sector-wide labour agreements as these measures reduce older workers’ employability and raise costs. Only very few organisations have personnel policies that are targeted at narrowing the growing productivity-wage gap. Only six percent of the organisations made use of the possibility of demotion and a mere 13 percent had special training programmes for older employees. The lack of a clear age-conscious personnel policy becomes most apparent when we consider the case of underperforming workers. When older workers no longer perform up to standard they tend to be tolerated and no corrective measures are taken to improve their employability. Their non-performing younger colleagues on the other hand, are not tolerated under such circumstances and are dismissed. Employers who wish to develop an age-conscious personnel policy need to tailor their measures to individual employees in an effort to enhance their participation in the labour force and promote sustainable employability.
References
Becker, G.S. (1962). Investment in human capital: A theoretical analysis. Journal of Political Economy 70: 9-49. doi:10.1086/258724.
Brewster, C., Hegewisch, A., Mayne, L., and Tregaskis, O. (1994). Methodology of the Price Waterhouse Cranfield project. In: Brewster, C. and Hegewisch, A. (eds.).
Policy and Practice in European Human Resource Management. London: Routledge: 230-245.
Chiu, W.C.K., Chan, A.W., Snape, E. and Redman, T. (2001). Age stereotypes and discriminatory attitudes towards older workers: An East-West comparison.
Human Relations 54: 629-661. doi:10.1177/0018726701545004.
Euwals, R., De Mooij, R., and Van Vuuren, D. (2009) Rethinking Retirement. The Hague: CPB Report.
Finkelstein, L.M., Burke, M.J., and Raju, N.S. (1995). Age discrimination in simulated employment contexts: An integrative analysis. Journal of Applied Psychology
80: 652-663. doi:10.1037/0021-9010.80.6.652.
Gelderblom, A., De Koning, J., and Kroes, H. (2005). Does an older workforce negatively affect a firm's performance? TLM.NET Working Papers no. 2005-31, Amsterdam.
Hassell, B., and Perrewe, P.L. (1995). An examination of beliefs about older workers: Do stereotypes still exist? Journal of Organizational Behaviour 16: 457-468. doi:10.1002/job.4030160506.
Henkens, K. (2005). Stereotyping older workers and retirement: The managers’ point of view. Canadian Journal on Aging 24: 35-48. doi:10.1353/cja.2006.0011.
Hilton, J.L. and Von Hippel, W. (1996). Stereotypes. Annual Review of Psychology 47: 237-271. doi:10.1146/annurev.psych.47.1.237.
Hutchens, R.M. (1989). Seniority, wages and productivity: A turbulent decade. Journal of Economic Perspectives 3: 49-64.
Judd, C.M. and Park, B. (1993). Definition and assessment of accuracy in social stereotypes. Psychology Review 100: 109-128. doi:10.1037/0033-295X.100.1.109.
Kalmijn, M., and Alessie, R. (2008). Life course changes in income. Netspar paper, Tilburg University.
Lazear, E.P. (1979). Why is there mandatory retirement? Journal of Political Economy
87: 1261-1274. doi:10.1086/260835.
Lazear, E.P. (1990). Adjusting to an aging labor force. In: Wise, D.A. (ed.). Issues in the Economics of Aging Chicago. University of Chicago Press: 287-312.
Lazear, E.P. (2004). The Peter Principle: A theory of decline. Journal of Political Economy 112: S141-S163. doi:10.1086/379943.
Lee, J.A., and Clemons, T. (1985). Factors affecting employment decisions about older workers. Journal of Applied Psychology 70: 785-788.
doi:10.1037/0021-9010.70.4.785.
Loretto, W., Duncan, C., and White, P.J. (2000). Ageism and employment: Controversies, ambiguities and younger people’s perceptions. Aging and Society
20: 279-302. doi:10.1017/S0144686X00007741. OECD. (2006). Live Longer, Work Longer. Paris: OECD.
Peter, L.J., and Hull, R. (1969). The Peter Principle: why things always go wrong. New York: William Morrow & Co.
Remery, C., Henkens, K., Schippers, J.J., and Ekamper, P. (2003). Manageing an ageing workforce and a tight labor market: Views held by Dutch employers.
Population Research and Policy Review 22: 21-40.
doi:10.1023/A:1023543307473.
Skirbekk, V. (2008). Age and productivity potential: A new approach based on ability levels and industry-wide task demand. Population and Development Review
34(Supplement): 191-207.
Statistics Netherlands (2006a). Bevolkingsprognose 2006-2050. Voorburg.
Statistics Netherlands (2006b). Methoden en definities Enquete Beroepsbevolking 2005. Voorburg.
Taylor, P. and Walker, A. (1998). Employers and older workers: Attitudes and employment practices. Ageing and Society 18: 641-658.
doi:10.1017/S0144686X98007119.
van Dalen, H.P., Henkens, K., and Schippers, J. (2009). Dealing with older workers in Europe: a comparative survey of employers' attitudes and actions. Journal of European Social Policy 19: 47-60. doi:10.1177/0958928708098523.
van Dalen, H.P., Henkens, K., and Schippers, J. (2010). Productivity of Older workers: Perceptions of Employers and Employees. Population and Development Review
36: 309-330.
Van Ours, J.C. and Stoeldraijer, L. (2010). Age, wage and productivity. CentER Discussion Paper no. 12, Tilburg University.