0 INTRODUCTION
Manufacturing processes are aimed at transforming materials into goods, generating wealth [1].
Camposeco-Negrete [2] states that cost and quality
are the main goals of manufacturing companies. To improve quality in this type of process, several authors have studied the turning process using mathematical strategies in order to contribute to the efficiency of these processes, such as: the Taguchi method [3], ant colony optimization [4], genetic algorithm [5] and response surface methodology (RSM) [6].
The primary input parameters in the turning process, i.e., cutting speed, feed rate and depth of
cut [7], are directly responsible for the quality and
productivity characteristics of the process, such as the amount of material removed, tool wear, and finishing of the product [8].
Furthermore, the finishing of the machined parts can be evaluated according to the surface roughness, which are irregularities presented on the surface of the parts, characterized by grooves made by the tool during the machining process [9] of the cutting parameters (ranging from a single parameter per
experiment) in the quality responses, such as tool life and surface roughness. This paper makes use of only one roughness parameter (arithmetic average
roughness, Ra), considering the calculation of its
metrics of the roughness characteristics (Ra, Ry, Rq, Rz
and Rt). The average arithmetic roughness (Ra) is the
arithmetic mean of the absolute values of the ordinates of the effective (measured) profile in relation to the midline in a sample length (Fig. 1). In addition, Ra is
the most used parameter for general quality control [10].
The steel used in the turning process of this study was AISI 12L14 carbon steel (used in studies such as: Peruchi et al. [11], Kishawy et al. [12], Overcash and Cuttino [13], Milstein and Marschall, [14]). The surface roughness of the turned parts and how their roughness is affected by the wear of the cutting tool was studied. The interaction of the wear on the tool (notch wear, flank wear, crater wear, among others) and the cutting parameters used in the process can be critical to the machined work surface finish [15] and [16] and may give unsatisfactory results.
As a result, to minimize experimental costs, it is necessary to use strategies such as the design of
A Weighted Mean Square Error Approach
to the Robust Optimization of the Surface Roughness
in an AISI 12L14 Free-Machining Steel-Turning Process
Almeida, F.A. – Gomes, G.F. – de Paula, V.R. – Corrêa, J.E. – Paiva, A.P. – Gomes, J.H.F. – Turrioni, J.B.Fabrício Alves de Almeida1 – Guilherme Ferreira Gomes2 – Vinícius Renó de Paula1 – João Ederson Corrêa1 –
Anderson Paulo de Paiva1 – José Henrique de Freitas Gomes1 – João Batista Turrioni1
1Federal University of Itajubá, Institute of Industrial Engineering and Management, Brazil 2Federal University of Itajubá, Mechanical Engineering Institute, Brazil
The objective of this work is to determine an optimal setup for the 12L14 free-machining steel-turning process that will be able to neutralize the influence of tool wear in the workpiece’s mean roughness Ra. Aiming this, equations for the mean and variance of the roughness were
modelled using the response surface methodology. A crossed array with three input variables of the turning process (cutting speed, feed and depth of cut) and a noise variable (use of new and wear tools) is applied to the methodology. Subsequently, these same responses were optimized using the mean square error, which allows the response mean value to approach a predetermined target value by cancelling variations thereof through a weighted objective. Confirmation experiments were conducted to prove the suitability of the method and excellent results were obtained.
Keywords: robust parameter optimization, mean square error, 12L14 free-machining steel turning, response surface methodology
Highlights
• A robust parameter design applied to the AISI 12L14 free machining steel turning process.
• Using techniques such as Response Surface Methodology (RSM) and crossed array to generate a model for process optimization.
• The Mean Square Error (MSE) method followed by a meta-modelling of the answers in order to neutralize the roughness of the answers for both a new and a wear tool through a weighted objective.
experiments (DOE), which is a statistical technique capable of modelling and optimizing experiments. According to Naves et al. [17], response surface methodology (RSM) is a type of DOE widely used in several follow ups. Among all the RSM designs, there is the specific one known as central composite design (CCD). This design can generate complete quadratic models [18].
Fig. 1. Definition of the arithmetic average roughness Ra;
Adapted from [10]
Furthermore, an experimental study was carried out to model the responses of interest (relative to the average roughness of the machined surfaces) where an experimental arrangement was created for three process variables (cutting speed, feed rate, and depth of cut) and for a noise variable (new and wear tools). This experimental arrangement created from RSM, is used to model machining parameters as in Mandal et al. [19], Bouacha et al. [20], Paiva et al. [21], Iqbal et al. [22], Al-Ahmari [23], Paiva et al. [24], Sahin and
Motorcu [25], Kwak et al.[26], Özel and Karpat [27],
Öktem et al. [28], Kwak [29], Benga and Abrão [30] and Suresh et al. [31].
Each of these theoretical positions makes a significant contribution to the understanding of the ordinary least squares method (OLS). This method is an algorithm used to estimate multiple linear regression model coefficients, factorial and response surfaces.
According to Montgomery [18], RSM is presented as an efficient approach for the application of a robust parameter design (RPD), in which it is characterized by a set of techniques to determine the levels of controllable factors with the purpose of reducing the sensitivity of the process [32]. In this way, the RPD application aims to ensure that the average response is
presented at a desirable level, while the variability of this level is minimized [18] and [33].
As a matter of fact, when optimizing an RPD (or robust optimization), it is necessary to use experimental arrangements such as the crossed array design [18]. In a robust optimization, there is a dual response surface (DRS), these functions being
for the mean (μ) and variance (σ2) of the analysed
characteristic, simultaneously optimizing both functions using RPD concepts, using multi-objective techniques such as mean square error (MSE).
An equally significant aspect, MSE is a technique presented by Köksoy [34] that presents the sum of the variance with the quadratic difference between the mean of the response and the target value. For problems with multiple characteristics, there is the agglutination of several MSE functions in which different degrees of importance can be presented [33]. Some studies that use MSE as an evaluation metric in the turning process [35] to [37]. In this way, the MSE was chosen to perform the robust optimization for
this turning process, from the mean (μ) and variance
(σ2) functions of the average roughness (Ra) of AISI
12L14 steel.
This article proposes to determine an optimum setup for the turning process of AISI 12L14 steel capable of eliminating the effects of tool wear on the average roughness of the machined part. For this, a robust optimization is proposed, followed by a meta-modelling of the answers to neutralize the roughness of the answers for both a new and a wear tool through a weighted objective.
This manuscript is organized as follows: Section 2 a general bibliographic review is presented, addressing the techniques used in the study. Section 3 the methodological procedure is presented. Section 4 presents the application of the method for the turning process of AISI 12L14 carbon steel, detailing the design, steps and the experimental results demonstrating the mathematical modelling can be confirmed in practice. Finally, section 5 draws the conclusions.
1 THEORETICAL BACKGROUND
1.1 Response Surface Methodology
According to Gomes et al. [39], the second-order polynomial significantly represents the problems for response surface:
Y i ix x x x
i k
ii i i
k
ij i j i j
= + + + +
= = <
∑
∑
∑
∑
β0 β β β ε
1
2 1
, (1)
where Y is the response of interest, k the number of independent variables, β the estimated coefficients, x
the parameters and ε the associated error term.
1.2 Robust Parameter Design
Introduced by Taguchi [40], RPD is a methodology to specify parameters of a process so that it presents an improvement in quality, ensuring that they reach the desired average of the responses, and minimizing variability before the quality of response. This make the process more stable and insensitive to noise [18], [32], [33], [41] and [42].
For problems that allow the use of RPD concepts,
Montgomery [18] states that RSM is characterized
as an efficient approach making use of experimental arrangements such as the crossed array. Thus, the noise variables will be treated as control variables, placing them in a single experimental arrangement.
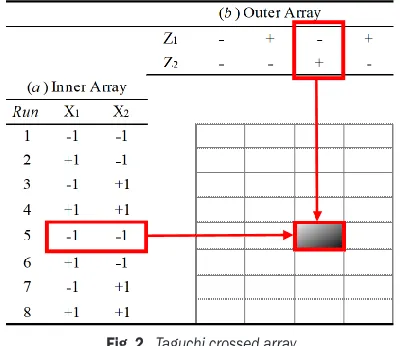
The crossed array consists of combined controllable factors (inner array) and uncontrollable factors (outer array) where each run is tested [43]. The Fig. 2 presents an example of an RPD with a crossed array.
Fig. 2. Taguchi crossed array
From the RPD concept, it is necessary to use DRS for the robust optimization, being of the mean and variance, where Brito et al. [44] states that the coefficients can be estimated from the OLS algorithm.
As a dual problem, a range of different multi-objective optimization techniques can be employed, in which the MSE will be used in this paper.
1.3 Mean Square Error
Equally important, MSE is a multi-objective optimization technique that, according to Köksoy [34], is characterized by the sum of the variance and the square of the difference between the target value and the mean of the response. Minimizing the MSE allows the mean value of the response to approximate the target value and successively the lowest value for the variability. Eq. (2) presents the formulation of this optimization [44].
MSE y( j)=µ(yj)−Tyj +σ (yj),
2 2
(2)
where the MSE(yj) is the MSE for the jth response, μ(yj)
the established model for the mean of the jth response, Tyj the jth response target (for individual optimization) and σ2(yj) the model established for the jth variance.
However, Eq. (2) matches the mean and variance for equal levels of importance, in this way, several functions that can be weighted for a global MSE function can be agglutinated, Eq. (3).
MSET w MSEi i wi y T
i P
i P
i i
= ⋅ = ⋅
(
−)
+
=
=
∑
∑
1 1
2 2
σ . (3)
As the weights w1 and w2 are specified as positive constants [44] to [48] and can be defined by different convex combinations w1 + w2 = 1 and wn > 0), for
example, through an arrangement of simplex-lattice
mixtures.
2 EXPERIMENTAL METHODOLOGY
To find a robust design for the AISI 12L14 free machining steels, the procedure was divided into five steps described in the sequence.
• Step 1. Determine experimental arrangements: Considering the amplitudes of cutting speed (Vc), feed rate ( f ) and depth of cut (ap) variables
recommended by the tool manufacture, several experiments are performed as preliminary tests. Considering the maximum tool wear edge of
VBmax = 0.25 mm. Adopting the crossed array as
experimental design, including the control and noise variables and adopting the variations, to perform the experiments randomly.
• Step 2. Execution of the experiments: Before
must execute the experiments in a random way and store their answers.
• Step 3. Modelling of the responses: Given
the original data obtained and with the OLS algorithm, we can establish the equations. In this way, it is possible to establish the models of the mean and variance functions and to analyse their fit (R2adj).
• Step 4. MSE optimization: The modelled
responses are optimized using the MSE
multi-objective technique, using generalized reduced
gradient (GRG) in the restricted response optimization. To obtain a Pareto frontier, the weights of the functions can be determined
according to an arrangement of simplex-lattice
mixtures, where the combination with the lowest value for the MSE corresponds to the optimal value.
• Step 5. Confirmation experiments: From the values of the best point for multi-objective optimization, confirmatory experiments are performed to verify the responses from one ANOVA.
3 AISI 12L14 TURNING PROCESS OPTIMIZATION RESULTS
The AISI 12L14 free machining steels are characterized, according to Gomes et al. [39], as a relevant industrial process, used in elements such as appliances, plugs, connectors, and components for pumps, in which, the AISI 12L14 do not need to present structural responsibility, thus other mechanical characteristics (response to heat treatments, strength and ductility) are considered secondary factors.
In this way, a procedure focused on the optimization of this process and aiming at the effect of tool wear on the final surface quality through the rough roughness (Ra) can follow the following steps.
3.1 Experimental Setup
In front of the input parameters are cutting speed (Vc),
feed rate ( f ) and depth of cut (ap). It has the limits
of the parameters for the experiment indicated in Table 1. The wear of the tool flank (Zd), Table 2, was
considered as a noise variable.
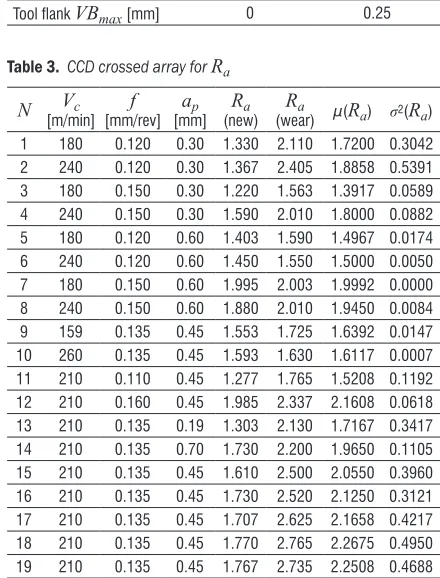
After defining the amplitude of the input parameters (Table 1), a planned CCD was performed with three factors at two levels (2k = 23 = 8), six axial
points (2k = 6) and five central points, totalling in an experimental array of 19 runs described in Table 3. The CCD is the most used design for experiments, presenting greater advantages than other types of
design [18]. In addition, the CCD is widely used in
machining applications: [2], [23], [49] to [52].
Table 1. Inner array: control factors
Control factors
Levels
–1.682 –1 0 1 1.682
Vc [m/min] 159 180 210 240 260
f [mm/rev] 0.11 0.12 0.135 0.15 0.16
ap [mm] 0.19 0.30 0.45 0.60 0.70
The levels of tool wear are described in Table 2. According to Brito et al. [44], the conditions of
the noise factors (Zd) show variation in the surface
roughness values. In this way, the RPD is used to determine a control configuration that presents minimum values of roughness with reduced variance against noise factors.
Table 2. Outer array: noise factor
Noise factor Levels
–1 1
Tool flank VBmax [mm] 0 0.25
Table 3. CCD crossed array for Ra N Vc
[m/min] [mm/rev]f [mm]ap (new)Ra (wear)Ra μ(Ra) σ2(Ra)
1 180 0.120 0.30 1.330 2.110 1.7200 0.3042
2 240 0.120 0.30 1.367 2.405 1.8858 0.5391
3 180 0.150 0.30 1.220 1.563 1.3917 0.0589
4 240 0.150 0.30 1.590 2.010 1.8000 0.0882
5 180 0.120 0.60 1.403 1.590 1.4967 0.0174
6 240 0.120 0.60 1.450 1.550 1.5000 0.0050
7 180 0.150 0.60 1.995 2.003 1.9992 0.0000
8 240 0.150 0.60 1.880 2.010 1.9450 0.0084
9 159 0.135 0.45 1.553 1.725 1.6392 0.0147
10 260 0.135 0.45 1.593 1.630 1.6117 0.0007
11 210 0.110 0.45 1.277 1.765 1.5208 0.1192
12 210 0.160 0.45 1.985 2.337 2.1608 0.0618
13 210 0.135 0.19 1.303 2.130 1.7167 0.3417
14 210 0.135 0.70 1.730 2.200 1.9650 0.1105
15 210 0.135 0.45 1.610 2.500 2.0550 0.3960
16 210 0.135 0.45 1.730 2.520 2.1250 0.3121
17 210 0.135 0.45 1.707 2.625 2.1658 0.4217
18 210 0.135 0.45 1.770 2.765 2.2675 0.4950
19 210 0.135 0.45 1.767 2.735 2.2508 0.4688
3.2 Execution of the Experiments
0.08 % Ni; 0.26 % Cu; 0.001 % Al; 0.02 % Mo;
0.28 % Pb; 0.0079 % N2 with dimensions of Ø 40
mm × 295 mm (Fig. 3) machined in Nardini CNC lathe, with 5.5 kW power and maximum rotation of 4000 rpm. The hard metal inserts Sandvik GC 4035 (ISO P35 class, code SNMG 090304 - PM) and a tool holder ISO DSBNL 1616H 09. Measurements were performed on a portable surface roughness tester Mitutoyo Surftest SJ 201 (Fig. 4).
Fig. 3. AISI 12L14 free machining steel turning process
Fig. 4. Mitutoyo portable roughness checker, model Surftest SJ 201
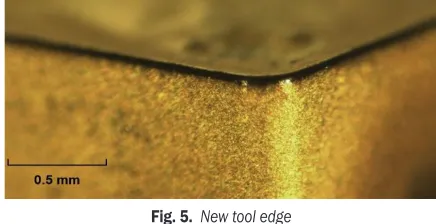
The tools used had their views captured through
an SZ61 Olympus® stereoscope and the measurements
made by the Analisys Five® software. As a criterion of
life for the tool was adopted a wear with a flank of
VBmax = 0.25 mm approximately, Figs. 5 and 6.
Fig. 5. New tool edge
From the data obtained for the roughness (Ra) of
the specimens after the machining with the two tools, it was possible to calculate the mean and variance for
each of the experiments. The calculated values are also shown in Table 3.
Fig. 6. Wear tool edge; VBmax = 0.25 mm
3.3 Modelling of Responses
The OLS was applied to the mean and variance data of
Ra to obtain the quadratic models of these functions.
The models presented high values of R2, indicating
that the adopted models are adequate.
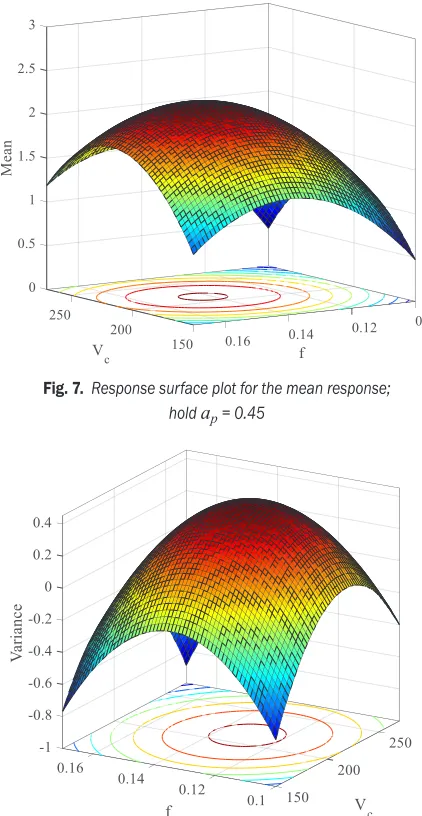
Therefore, according to the full quadratic model
described in Table 4, the mean μ and variance σ2
equations for Ra can be described as in Eqs. (4) and
(5). The graphs of these response surfaces are shown
in Figs. 7 and 8, where the ap value was maintained
as 0.45.
Table 4. Coefficients for the final quadratic models of turning outputs
Coef μ R σ2 P
β0 2.1739 0.000 0.4172 0.000
β1 0.0349 0.300 0.0173 0.459
β2 0.1179 0.005 -0.0591 0.027
β3 0.0411 0.228 -0.0987 0.002
β11 -0.1993 0.000 -0.1371 0.000
β22 -0.1232 0.004 -0.1078 0.001
β33 -0.1232 0.004 -0.0599 0.025
β12 0.0231 0.591 -0.0231 0.450
β13 -0.0781 0.092 -0.0335 0.281
β23 0.1702 0.003 0.0853 0.017
R2 91.15 % 91.13 %
R2adj 82.30 % 82.25 %
µ( ) . . . .
. . .
R V f a
V f a
a c p
c
= + + +
− − −
2 174 0 035 0 118 0 041
0 199 2 0 123 2 1 232 pp
c c p p
V f V a fa
2
0 023 0 078 0 170
+ . − . + . , (4)
σ2
2 2
0 417 0 017 0 059 0 099
0 137 0 108 0 060
( ) . . . .
. . .
R V f a
V f
a c p
c
= + − −
− − − aa
V f V a fa
p
c c p p
2
0 023 0 034 0 085
Fig. 7. Response surface plot for the mean response; hold ap = 0.45
Fig. 8. Response surface plot for the variance response; hold ap = 0.45
3.4 Turning Process Optimization by MSE Objective
To perform the optimization by MSE, the optimal values of mean and variance must be established through restricted individual optimization, in which both responses were minimized. The minimum individual value found for the mean was described in Table 5.
Table 5. Utopia points for the original responses
Target
μ(Ra) σ2(Ra)
1.4448 0.0338
1.8720 0.0010
These values will be used as target values for the formulation of the optimization problem by MSE. In this way, the optimization problem for AISI 12L14 free-machining steel is described by:
min .
. . : .
.
.
MSE w w
s t X XT
=
(
−)
+≥ ≤
1
2 2
2 2
1 4448
0 001
2 829
µ σ
σ (6)
The adopted constraint allows the model to find optimal points within the valid region, without being outside the experimental space. Thus, the restriction of variance was necessary so that the algorithm did not find negative values of variance in the search for optimal points.
The equation was weighted for different
combinations of weights (wi) from an arrangement of
simplex-lattice mixtures varying the weights between 0.085 and 0.915 so that no weight presented null value (equal to zero). The arrangement created is described in Table 6.
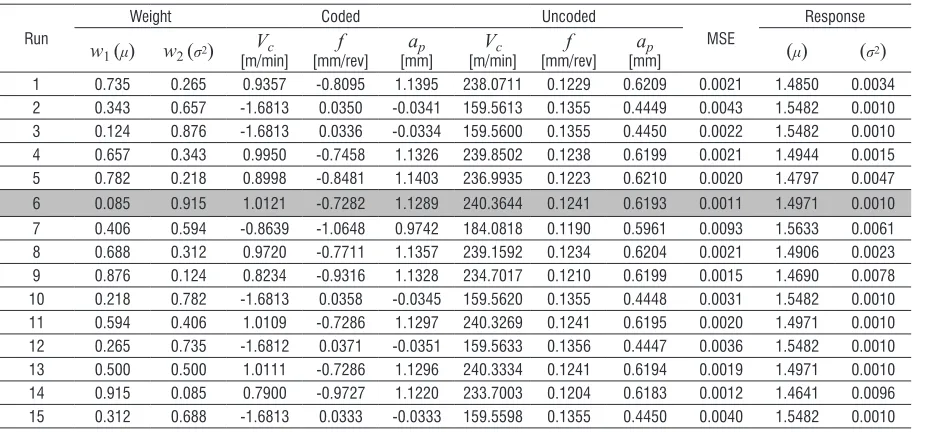
For each combination of weights determined by the arrangement, an optimization was performed, presenting a combination of optimal points for this problem. Table 6 presents the results found for the optimization of each combination of weights used, as well as the parameters coded and un-coded for each of the responses. From the adopted weights, it is possible to establish a Pareto frontier with the optimized answers.
In addition, Fig. 9 shows the Pareto frontier constructed for this problem, highlighting the locations of the optimal weights in relation to the efficient optimization set. The lowest MSE value was
obtained for the combination of weights w1 = 0.085
and w2 = 0.915 is described in Fig. 9.
Fig. 9. Pareto solutions
The balance determined by these weights
f = 0.124 mm/rev and ap = 0.619 mm, providing a
roughness mean of 1.4971 μm with variance 0.001 (MSE = 0.0011). Fig. 10 compares the obtained solutions, and it is possible to verify the optimal point found within the established region.
3.5 Confirmation Experiments
The optimization of the robust project is aimed at finding configurations of controllable parameters that are not influenced by uncontrollable factors, that is, where the noise variable is neutralized in the process. To confirm whether the results were satisfactory, a suitable sample must be determined to perform a hypothesis test of the average values of the surface roughness with and without the presence of noise factors. If the null hypothesis is accepted, it means that the noise factor was neutralized by the robust configuration.
At the same time, the ideal condition of the weights for mean and variance were 8.5 % and 91.5 %,
respectively to the test x*code = [1.0121; –0.7282;
1.1289], i.e., a final machining configuration of
x*uncode = [240.3 m/min; 0.124 mm/rev; 0.619 mm].
The optimal values of the solution vector retain the properties, summarized in Table 7.
To know the number of replicates (or experiments) required to perform the confirmatory test, one must consider the difference established based on the distance of the utopia and nadir points
for the Ra response. Adopting a test power of 80 %,
a significance level of 5 %, and based on the values
of standard deviation of the chosen optimum point, it is possible to obtain the necessary amount of experiments, being of three replicates.
To obtain a better statistical treatment, it was decided to perform two additional experiments, obtaining a total of five replicates for the hypothesis confirmation test described in Table 7.
Fig. 10. Overlaid contour plot for the optimization of 12L14 free machining steel turning (Vc = 210 m/min)
It is easy to verify that the mean values of Ra
for the confirmation tests are close to expectations. Observing the ANOVA results from Table 8, it can be concluded that the noise does not present significant influence on the process, where all values of P > 0.05,
Table 6. Optimal results obtained with the MSE approach
Run
Weight Coded Uncoded
MSE
Response
w1 (μ) w2 (σ2) Vc
[m/min] f
[mm/rev] [mm]ap Vc
[m/min] f
[mm/rev] [mm]ap (μ) (σ2)
1 0.735 0.265 0.9357 -0.8095 1.1395 238.0711 0.1229 0.6209 0.0021 1.4850 0.0034
2 0.343 0.657 -1.6813 0.0350 -0.0341 159.5613 0.1355 0.4449 0.0043 1.5482 0.0010
3 0.124 0.876 -1.6813 0.0336 -0.0334 159.5600 0.1355 0.4450 0.0022 1.5482 0.0010
4 0.657 0.343 0.9950 -0.7458 1.1326 239.8502 0.1238 0.6199 0.0021 1.4944 0.0015
5 0.782 0.218 0.8998 -0.8481 1.1403 236.9935 0.1223 0.6210 0.0020 1.4797 0.0047
6 0.085 0.915 1.0121 -0.7282 1.1289 240.3644 0.1241 0.6193 0.0011 1.4971 0.0010
7 0.406 0.594 -0.8639 -1.0648 0.9742 184.0818 0.1190 0.5961 0.0093 1.5633 0.0061
8 0.688 0.312 0.9720 -0.7711 1.1357 239.1592 0.1234 0.6204 0.0021 1.4906 0.0023
9 0.876 0.124 0.8234 -0.9316 1.1328 234.7017 0.1210 0.6199 0.0015 1.4690 0.0078
10 0.218 0.782 -1.6813 0.0358 -0.0345 159.5620 0.1355 0.4448 0.0031 1.5482 0.0010
11 0.594 0.406 1.0109 -0.7286 1.1297 240.3269 0.1241 0.6195 0.0020 1.4971 0.0010
12 0.265 0.735 -1.6812 0.0371 -0.0351 159.5633 0.1356 0.4447 0.0036 1.5482 0.0010
13 0.500 0.500 1.0111 -0.7286 1.1296 240.3334 0.1241 0.6194 0.0019 1.4971 0.0010
14 0.915 0.085 0.7900 -0.9727 1.1220 233.7003 0.1204 0.6183 0.0012 1.4641 0.0096
characterizing the configuration as robust, where
the Ra response does not change significantly in the
presence of the worn tool.
In a normal configuration of use, the tool undergoes wear through its use in machining, where the initial configuration would be unable to maintain the same surface roughness values. In a robust configuration, the process performance is guaranteed for a long period, since the roughness values tend to remain statistically equal during the life of the tool.
Table 7. Results from the confirmation experiments
Run [m/min]Vc [mm/rev]f [mm]ap Ra [μm](wear) Ra[μm] (new)
1 240 0.124 0.619 2.127 2.023
2 240 0.124 0.619 1.987 2.060
3 240 0.124 0.619 2.040 1.963
4 240 0.124 0.619 2.067 1.950
5 240 0.124 0.619 1.970 1.913
Table 8. ANOVA results for the confirmation experiments
N Mean SE coef T P
Ra (wear) 5 2.038 0.028 1.45 0.19
Ra (new) 5 1.982 0.026
In effect, to ensure the quality of the roughness level, a machining configuration must be established that is not unstable to the wear action of the tool. If this factor is not considered, it would be improbable to maintain an optimum surface roughness value as the tool degrades. This feature differs from a great design to a robust design.
4 CONCLUSIONS
In machining processes, tool wear is a natural consequence and can be considered a noise factor, since its occurrence is inevitable. Tool performance is associated with the number of machining passages, directly influencing the surface roughness values of the workpiece. Thus, this article presents a robust optimization approach using MSE, weighting the
mean (μ) and variance (σ2) for different degrees of
importance applied to the AISI 12L14 free machining steel turning process.
Under those circumstances, the described procedure promoted the minimization of the average
roughness (Ra) and the variability, neutralizing the
influence of the wear tool. The optimized design showed an optimal response setting with the robust
parameters x* = [240.3 m/min; 0.124 mm/rev; 0.619
mm] for an MSE = 0.0010 response with mean
and variance weights of 0.085 (w1) and 0.915 (w2)
respectively. The confirmation experiment showed that the noise factor was not significant for the roughness response.
Generally speaking, establishing an ideal configuration for a machining process, capable of not being influenced by variations in tool wear, ensures the quality of the machined surfaces. Therefore, robust optimization is essential to establish optimum setup and maintain a suitable roughness level for a set time.
5 ACKNOWLEDGMENTS
The authors would like to acknowledge the support from the CNPq, CAPES, and FAPEMIG.
6 REFERENCES
[1] Salonitis, K., Ball, P. (2013). Energy efficient manufacturing from machine tools to manufacturing systems. Procedia CIRP, vol. 7, p. 634-639, DOI:10.1016/j.procir.2013.06.045.
[2] Camposeco-Negrete, C. (2015). Optimization of cutting parameters using response surface method for minimizing energy consumption and maximizing cutting quality in turning of AISI 6061 T6 aluminum. Journal of Cleaner Production, vol. 91, p. 109-117, DOI:10.1016/j.jclepro.2014.12.017.
[3] Yang, W.P., Tarng, Y.S. (1998). Design optimization of cutting parameters for turning operations based on the Taguchi method. Journal of Materials Processing Technology, vol. 84, no. 1-3, p. 122-129, DOI:10.1016/S0924-0136(98)00079-X. [4] Vijayakumar, K., Prabhaharan, G., Asokan, P., Saravanan, R.
(2003). Optimization of multi-pass turning operations using ant colony system. International Journal of Machine Tools and Manufacture, vol. 43, no. 15, p. 1633-1639, DOI:10.1016/ S0890-6955(03)00081-6.
[5] Klancnik, S., Hrelja, M., Balic, J., Brezocnik, M. (2016). Multi-objective optimization of the turning process using a gravitational search algorithm (GSA) and NSGA-II approach.
Advances in Production Engineering & Management, vol. 11, no. 4, p. 366-376, DOI:10.14743/apem2016.4.234.
[6] Chabbi, A., Yallese, M.A., Nouioua, M., Meddour, I., Mabrouki, T., Girardin, F. (2017). Modeling and optimization of turning process parameters during the cutting of polymer (POM C) based on RSM, ANN, and DF methods. The International Journal of Advanced Manufacturing Technology, vol. 91, no. 5-8, p. 2267-2290, DOI:10.1007/s00170-016-9858-8. [7] Özel, T., Hsu, T.-K., Zeren, E. (2005). Effects of cutting edge
geometry, workpiece hardness, feed rate and cutting speed on surface roughness and forces in finish turning of hardened AISI H13 steel. The International Journal of Advanced Manufacturing Technology, vol. 25, no. 3-4, p. 262-269, DOI:10.1007/s00170-003-1878-5.
[9] Benardos, P.G., Vosniakos, G.-C. (2003). Predicting surface roughness in machining: a review. International Journal of Machine Tools and Manufacture, vol. 43, no. 8, p. 833-844, DOI:10.1016/S0890-6955(03)00059-2.
[10] Gadelmawla, E.S., Koura, M.M., Maksoud, T.M.A., Elewa, I.M., Soliman, H.H. (2002). Roughness parameters. Journal of Materials Processing Technology, vol. 123, no. 1, p. 133-145, DOI:10.1016/S0924-0136(02)00060-2.
[11] Peruchi, R.S., Balestrassi, P.P., de Paiva, A.P., Ferreira, J.R., de Santana Carmelossi, M. (2013). A new multivariate gage R&R method for correlated characteristics. International Journal of Production Economics, vol. 144, no. 1, p. 301-315, DOI:10.1016/j.ijpe.2013.02.018.
[12] Kishawy, H.A., Hosseini, A., Moetakef-Imani, B., Astakhov, V.P. (2012). An energy based analysis of broaching operation: Cutting forces and resultant surface integrity. CIRP Annals, vol. 61, no. 1, p. 107-110, DOI:10.1016/j.cirp.2012.03.004. [13] Overcash, J.L., Cuttino, J.F. (2009). Design and experimental
results of a tunable vibration turning device operating at ultrasonic frequencies. Precision Engineering, vol. 33, no. 2, p. 127-134, DOI:10.1016/j.precisioneng.2008.04.006. [14] Milstein, F., Marschall, J. (1988). Influence of symmetry
and bifurcation on the uniaxial loading behaviour of b.c.c. metals. Philosophical Magazine A, vol. 58, no. 2, p. 365-384, DOI:10.1080/01418618808209931.
[15] Asiltürk, I., Neşeli, S., Ince, M.A. (2016). Optimisation of
parameters affecting surface roughness of Co28Cr6Mo medical material during CNC lathe machining by using the Taguchi and RSM methods. Measurement, vol. 78, p. 120-128, DOI:10.1016/j.measurement.2015.09.052.
[16] Bhushan, R.K. (2013). Optimization of cutting parameters for minimizing power consumption and maximizing tool life during machining of Al alloy SiC particle composites. Journal of Cleaner Production, vol. 39, p. 242-254, DOI:10.1016/j. jclepro.2012.08.008.
[17] Naves, F.L., de Paula, T.I., Balestrassi, P.P., Braga, W.L.M., Sawhney, R.S., de Paiva, A.P. (2017). Multivariate normal boundary intersection based on rotated factor scores: A multiobjective optimization method for methyl orange treatment. Journal of Cleaner Production, vol. 143, p. 413-439, DOI:10.1016/j.jclepro.2016.12.092.
[18] Montgomery, D.C. (2013). Design and Analysis of Experiments, 8th ed. John Wiley & Sons, New York.
[19] Mandal, N., Doloi, B., Mondal, B. (2011). Development of flank wear prediction model of Zirconia Toughened Alumina (ZTA) cutting tool using response surface methodology. International Journal of Refractory Metals and Hard Materials, vol. 29, no. 2, p. 273-280, DOI:10.1016/j.ijrmhm.2010.12.001.
[20] Bouacha, K., Yallese, M.A., Mabrouki, T., Rigal, J.F. (2010). Statistical analysis of surface roughness and cutting forces using response surface methodology in hard turning of AISI 52100 bearing steel with CBN tool. International Journal of Refractory Metals and Hard Materials, vol. 28, no. 3, p. 349-361, DOI:10.1016/j.ijrmhm.2009.11.011.
[21] Paiva, A.P., Paiva, E.J., Ferreira, J.R., Balestrassi, P.P., Costa, S.C. (2009). A multivariate mean square error optimization of AISI 52100 hardened steel turning. The International Journal
of Advanced Manufacturing Technology, vol. 43, no. 7-8, p. 631-643, DOI:10.1007/s00170-008-1745-5.
[22] Iqbal, A., Ning, H., Khan, I., Liang, L., Dar, N.U. (2008). Modeling the effects of cutting parameters in MQL-employed finish hard-milling process using D-optimal method. Journal of Materials Processing Technology, vol. 199, no. 1-3, p. 379-390, DOI:10.1016/j.jmatprotec.2007.08.029.
[23] Al-Ahmari, A.M.A. (2007). Predictive machinability models for a selected hard material in turning operations. Journal of Materials Processing Technology, vol. 190, no. 1-3, p. 305-311, DOI:10.1016/j.jmatprotec.2007.02.031.
[24] Paiva, A.P., Ferreira, J.R., Balestrassi, P.P. (2007). A multivariate hybrid approach applied to AISI 52100 hardened steel turning optimization. Journal of Materials Processing Technology, vol. 189, no. 1-3, p. 26-35, DOI:10.1016/j. jmatprotec.2006.12.047.
[25] Sahin, Y., Motorcu, A.R. (2008). Surface roughness model in machining hardened steel with cubic boron nitride cutting tool.
International Journal of Refractory Metals and Hard Materials, vol. 26, no. 2, p. 84-90, DOI:10.1016/j.ijrmhm.2007.02.005. [26] Kwak, J.S., Sim, S.B., Jeong, Y.D. (2006). An analysis of
grinding power and surface roughness in external cylindrical grinding of hardened SCM440 steel using the response surface method. International Journal of Machine Tools and Manufacture, vol. 46, no. 3-4, p. 304-312, DOI:10.1016/j. ijmachtools.2005.05.019.
[27] Özel, T., Karpat, Y. (2005). Predictive modeling of surface roughness and tool wear in hard turning using regression and neural networks. International Journal of Machine Tools and Manufacture, vol. 45, no. 4-5, p. 467-479, DOI:10.1016/j. ijmachtools.2004.09.007.
[28] Öktem, H., Erzurumlu, T., Kurtaran, H. (2005). Application of response surface methodology in the optimization of cutting conditions for surface roughness. Journal of Materials Processing Technology, vol. 170, no. 1-2, p 11-16, DOI:10.1016/j.jmatprotec.2005.04.096.
[29] Kwak, J.S. (2005). Application of Taguchi and response surface methodologies for geometric error in surface grinding process. International Journal of Machine Tools and Manufacture, vol. 45, no. 3, p. 327-334, DOI:10.1016/j. ijmachtools.2004.08.007.
[30] Benga, G.C., Abrao, A.M. (2003). Turning of hardened 100Cr6 bearing steel with ceramic and PCBN cutting tools. Journal of Materials Processing Technology, vol. 143-144, p. 237-241, DOI:10.1016/S0924-0136(03)00346-7.
[31] Suresh, P.V.S., Rao, P.V., Deshmukh, S.G. (2002). A genetic algorithmic approach for optimization of surface roughness prediction model. International Journal of Machine Tools and Manufacture, vol. 42, no. 6, p. 675-680, DOI:10.1016/S0890-6955(02)00005-6.
[32] Ardakani, M.K., Noorossana, R. (2008). A new optimization criterion for robust parameter design --- the case of target is best. The International Journal of Advanced Manufacturing Technology, vol. 38, no. 9-10, p. 851-859, DOI:10.1007/ s00170-007-1141-6.
Manufacturing Technology, vol. 38, no. 1-2, p. 7-18, DOI:10.1007/s00170-007-1082-0.
[34] Köksoy, O. (2006). Multiresponse robust design: Mean square error (MSE) criterion. Applied Mathematics and Computation, vol. 175, no. 2, p. 1716-1729, DOI:10.1016/j. amc.2005.09.016.
[35] Jafarian, F., Amirabadi, H., Sadri, J. (2015). Experimental measurement and optimization of tensile residual stress in turning process of Inconel718 superalloy. Measurement, vol. 63, p. 1-10, DOI:10.1016/j.measurement.2014.11.021. [36] Vinod, P., Rao, C.M., Narendranath, S., Kumar, P.S. (2015).
A study on effect of cutting conditions on surface finish in diamond turning process. International Journal of Precision Technology, vol. 5, no. 2, p. 114-127, DOI:10.1504/ IJPTECH.2015.070635.
[37] Boukezzi, F., Noureddine, R., Benamar, A., & Noureddine, F. (2017). Modelling, prediction and analysis of surface roughness in turning process with carbide tool when cutting steel C38 using artificial neural network. International Journal of Industrial and Systems Engineering, vol. 26, no. 4, p. 567-583, DOI:10.1504/IJISE.2017.085227.
[38] Myers, R.H., Montgomery, D.C., Anderson-Cook, C.M. (2016).
Response Surface Methodology: Process and Product Optimization Using Designed Experiments. 4th ed. John Wiley
& Sons, New York.
[39] Gomes, J.H.F., Júnior, A.R.S., de Paiva, A.P., Ferreira, J.R., da Costa, S.C., Balestrassi, P.P. (2012). Global criterion method based on principal components to the optimization of manufacturing processes with multiple responses. Strojniški vestnik - Journal of Mechanical Engineering, vol. 58, no. 5, p. 345-353, DOI:10.5545/sv-jme.2011.136.
[40] Taguchi, G. (1986). Introduction to Quality Engineering: Designing Quality into Products and Processes. Asian Productivity Organization, Tokyo.
[41] Yang, J., Zhang, R., Liu, M. (2013) Construction of optimal blocking schemes for robust parameter designs. Acta Mathematica Scientia, vol. 33, no. 5, p. 1431-1438, DOI:10.1016/S0252-9602(13)60094-6.
[42] Elsayed, K., Lacor, C. (2014). Robust parameter design optimization using Kriging, RBF and RBFNN with gradient-based and evolutionary optimization techniques. Applied Mathematics and Computation, vol. 236, p. 325-344, DOI:10.1016/j.amc.2014.03.082.
[43] Yang, K., Teo, E.-C., Fuss, F.K. (2006). Application of Taguchi method in optimization of cervical ring cage. Journal of Biomechanics, vol. 40, p. 3251-3256, DOI:10.1016/j. jbiomech.2006.12.016.
[44] Brito, T.G., Paiva, A.P., Ferreira, J.R., Gomes, J.H.F., Balestrassi, P.P. (2014). A normal boundary intersection approach to multiresponse robust optimization of the surface roughness in end milling process with combined arrays. Precision Engineering, vol. 38, no. 3, p. 628-638, DOI:10.1016/j. precisioneng.2014.02.013.
[45] Box, G., Jones, S. (1992). Designing products that are robust to the environment. Total Quality Management, vol. 3, no. 3, p. 265-282, DOI:10.1080/09544129200000034.
[46] Kazemzadeh, R.B., Bashiri, M., Atkinson, A.C., Noorossana, R. (2008). A general framework for multiresponse optimization problems based on goal programming. European Journal of Operational Research, vol. 189, no. 2, p. 421-429, DOI:10.1016/j.ejor.2007.05.030.
[47] Tang, L.C., Xu, K. (2002). A unified approach for dual response surface optimization. Journal of Quality Technology, vol. 34, no. 4, p. 307-322, DOI:10.1002/0470062002.ch20.
[48] Lin, D.K., Tu, W. (1995). Dual response surface optimization.
Journal of Quality Technology, vol. 27, no. 1, p. 34-39, DOI:10.1080/00224065.1995.11979556.
[49] Cukor, G., Jurković, Z. Sekulić, M. (2011). Rotatable central
composite design of experiments versus Taguchi method in the optimization of turning. Metalurgija, vol. 50, no. 1, p. 17-20.
[50] Asiltürk, I. Neşeli, S. (2012). Multi response optimisation of
CNC turning parameters via Taguchi method-based response surface analysis. Measurement, vol. 45, no. 4, p. 785-794, DOI:10.1016/j.measurement.2011.12.004.
[51] Noordin, M.Y., Venkatesh, V.C., Sharif, S., Elting, S., Abdullah, A. (2004). Application of response surface methodology in describing the performance of coated carbide tools when turning AISI 1045 steel. Journal of Materials Processing Technology, vol. 145, no. 1, p. 46-58, DOI:10.1016/S0924-0136(03)00861-6.
![Fig. 1. Definition of the arithmetic average roughness Ra; Adapted from [10]](https://thumb-us.123doks.com/thumbv2/123dok_us/8948621.1857989/2.598.72.274.195.353/fig-definition-arithmetic-average-roughness-ra-adapted.webp)