VOLUME 38, ARTICLE 22, PAGES 549
,
576
PUBLISHED 14 FEBRUARY 2018
http://www.demographic-research.org/Volumes/Vol38/22/ DOI: 10.4054/DemRes.2018.38.22
Research Article
Ultra-low fertility in South Korea: The role of
the tempo effect
Sam Hyun Yoo
Tomáš Sobotka
© 2018 Sam Hyun Yoo & Tomáš Sobotka.
This open-access work is published under the terms of the Creative Commons Attribution 3.0 Germany (CC BY 3.0 DE), which permits use, reproduction, and distribution in any medium, provided the original author(s) and source are given credit.
1 Introduction 550 2 Low fertility and the tempo effect in East Asian countries 551
3 Data 553
4 Methods 554
4.1 Fertility tempo adjustments 555
4.2 Tempo- and parity-adjusted total fertility rate (TFRp*) 555
4.3 Average cohort fertility (ACF) 557
4.4 Measuring tempo distortions and decomposition analysis 557
5 Results 558
5.1 Fertility trends and tempo distortions, 1981‒2015 558 5.2 Three stages of fertility decline in Korea from low to ultra-low
levels 562
6 Discussion 565
7 Acknowledgements 568
References 569
Ultra-low fertility in South Korea: The role of the tempo effect
Sam Hyun Yoo1
Tomáš Sobotka2
Abstract
BACKGROUND
The total fertility rate (TFR) in South Korea has fallen below 1.3 since 2001. The role of the rapid shift toward a late-childbearing pattern in driving Korean fertility decline to this ultra-low level has been little explored until now.
OBJECTIVE
We provide an in-depth analysis of period fertility trends by birth order in South Korea from 1981 to 2015, when the period TFR fell from 2.57 to extremely low levels.
METHODS
We combine census and birth registration data to estimate period and cohort fertility indicators by birth order. We compare changes in conventional TFR with tempo- and parity-adjusted total fertility rate (TFRp*) and their birth-order-specific components.
RESULTS
The tempo effect linked to the shift toward delayed childbearing has had a strong and persistent negative influence on period TFRs in South Korea since the early 1980s. Without the shift to later childbearing, period fertility rates in South Korea would consistently stay higher and decline more gradually, reaching a threshold of very low fertility, 1.5, only in 2014. The postponement of childbearing and the resulting tempo effect were strongest in the early 2000s, when Korean TFR reached the lowest levels. More recently, Korean fertility has been characterized by a diminishing tempo effect and falling first and second birth rates. This trend marks a break with the previous pattern of almost universal fertility and a strong two-child family model.
CONTRIBUTION
Our study demonstrates the importance of the tempo effect in explaining the shift to ultra-low fertility in South Korea and in East Asia.
1 Department of Social Studies Education, Kongju National University, Republic of Korea. E-Mail:[email protected].
1. Introduction
The Republic of Korea is the largest among East Asian and Southeast Asian societies currently experiencing ultra-low (or ‘lowest-low’) period total fertility rates (TFR) below 1.3 (Jones, Tay-Straughan, and Chan 2008; Lee and Choi 2015). In the course of four decades South Korea (hereafter Korea) has experienced a rapid transition from being a high-fertility country to being a country with one of the lowest fertility levels globally. Period TFR fell from 6.3 in 1955‒1960 (United Nations 2017) to subreplacement level in 1984, and then to the lowest-low level, below 1.3, since 2001, bottoming at 1.08 in 2005. In parallel with a fast-paced fertility decline, a rapid “postponement transition” (Kohler, Billari, and Ortega 2002) has been taking place since the early 1980s, with marriages and first births being shifted to ever higher ages. As a result, the mean age of mothers at first birth has increased by over six years, reaching 31 in 2014, the highest level among the larger countries globally (Sobotka 2017).
The experience of low fertility took policymakers by surprise and eventually created a sense of urgency in a country where official policies until the 1980s aimed to limit family size in order to curb population growth and reduce overcrowding. The Korean government abolished the long-lasting antinatalist policy in 1996 and converted it into the New Population Policy (1996‒2004), which aimed at maintaining population quality and welfare through reproductive health service and human resource development (Cho 1996; Suh et al. 2016). In response to very low fertility and population ageing, the Korean government adopted pronatalist policies in 2005 ‒ later than other East Asian countries with very low fertility. Since 2006 the Korean government has launched three five-year plans that formulate a set of pronatalist policies which aims to encourage people to marry and have children in order to increase the country’s fertility rate (Haub 2010; Lee and Choi 2015). The latest policy program, the so-called Third Plan for Ageing Society and Population, 2016‒2020, was announced in December 2015 (Government of the Republic of Korea 2015; Lee 2015). These action plans are formulated on the basis of the observed trends in the period TFR and they also set numerical targets of TFR levels, with the Third Plan aiming to achieve a TFR of 1.50 by 2020 (Government of the Republic of Korea 2015). However, these policy efforts do not yet appear to have much effect (Lee 2009; Lee and Choi 2015), as indicated by the period TFR dropping as low as 1.17 in 2016 (Statistics Korea 2017).
misleading perceptions of fertility trends and provide wrong signals about policy effects (Sobotka and Lutz 2011). The lack of attention to cohort trends and to alternative period fertility measures in policy-related debates in Korea is surprising. A similar situation prevails in other countries of the region as well. Whereas in Europe demographers have extensively discussed the tempo effect in conventional period indicators of fertility and marriage and identified its key role in driving these indicators to very low levels (Bongaarts and Feeney 1998, Sobotka 2004) as well as in stimulating the TFR increases observed in many countries in the 2000s (Goldstein et al. 2009; Bongaarts and Sobotka 2012), studies on East Asia mostly tend to ignore the impact of the tempo effect on the TFRs.
We argue that the trend toward very low fertility in Korea has been partly fueled by the tempo effect and that, similar to many European countries, the tempo effect might have been the decisive force that pushed the period TFR toward the lowest-low level. To understand rises and falls in fertility and cross-country differentials in fertility rates, fertility measurement should go beyond the period TFRs. To address our argument, we provide an in-depth analysis of period fertility trends in Korea over the course of more than three decades from 1981 to 2015, when the period TFR shifted from 2.57 to lowest-low levels below 1.30. We compare changes in conventional TFR with tempo- and parity-adjusted total fertility rate (TFRp*) suggested by Bongaarts and Sobotka (2012) and their order-specific components. To check the robustness of our results, we further compare changes in these two period indicators with the period indicator of average cohort fertility (ACF) in 1981‒2002, which was suggested by Schoen (2004), and with the completed cohort fertility of women born until the 1970s.
We identify three distinct stages in the Korean fertility decline. This decline was first fueled by falling fertility at third and higher birth orders in the 1980s, then by a strong tempo effect linked to the postponement of first and second births in the 1990s, and most recently, by a gradual reduction in first birth rates and a faster decline in fertility rates at second-order births. We show that when tempo and parity composition effects are accounted for, Korean fertility displays more gradual but continuous decline, reaching the 1.5 threshold in 2014.
2. Low fertility and the tempo effect in East Asian countries
and Hayford 2009). The TFR below 1.3 is often described as ‘lowest-low’ fertility (Kohler, Billari, and Ortega 2002), but in East Asia it is also labelled as ‘ultra-low’ fertility.3
Many studies pointed out that ultra-low fertility is mainly attributable to delayed marriage and childbearing in East Asia (Frejka, Jones, and Sardon 2010; Jones 2007). In many East Asian countries women’s mean age at marriage has increased for the past several decades, in parallel with a rise in age at childbearing. Until recently these societies adhered to a universal marriage pattern, with marriage closely connected with childbearing and, for women, usually also with a withdrawal from the labor force and a specialization on household tasks, childrearing, and care for the elderly (e.g., Bumpass et al. 2009 for Japan). Recently, marriage rates have declined across the region and women and men increasingly remain single well into their thirties. Rates of never getting married have also increased considerably (Jones and Gubhaju 2009; Rindfuss and Choe 2015; Yoo 2016). As births out of wedlock remain rare and childbearing is still exclusively linked to marriage across the region, a decline in nuptiality implies fewer births and contributes strongly to the emergence of ultra-low fertility in East Asia. This contrasts with the European experience of a strong increase in nonmarital childbearing, especially within cohabiting unions, which has taken place in all major regions of Europe during the last three decades (Perelli-Harris et al. 2012; Coleman 2013; Thomson 2014).
Despite its persistence, it is not yet clear whether East Asian ultra-low fertility is likely to become a permanent phenomenon, and whether cohort fertility will also fall to such low levels. Many marriages and births presumably delayed at younger ages will eventually take place at later ages, bringing at least a minor recovery in the period TFR. Such a trend has been observed in Japan, the first East Asian country experiencing very low fertility, during the last decade when the period TFR rose gradually from a low of 1.25 in 2005 to 1.46 in 2015. An extensive body of literature has studied socioeconomic factors contributing to fertility decline in Korea, such as costs of education, educational expansion, economic recession, labor market conditions, public policies, and a change in women’s position, gender roles, values, and attitudes (Anderson and Kohler 2013; Choe and Park 2006; Eun 2007; Jun 2005; Kim 2007; Kim 2005, 2013; Kim 2014; Kwon 2007; Ma 2013, 2014, 2016; Park, Lee, and Jo 2013; Woo 2012; Yoo 2006, 2014; Kim and Yoo 2016; Tan, Morgan, and Zagheni 2016). However, the nature of ultra-low fertility has not yet been sufficiently explored. Especially little is known about the role of the tempo effect in depressing fertility in the region. We partly bridge this
gap by providing an in-depth analysis of trends in order-specific period fertility indicators in Korea since the early 1980s. As order-specific data has become available for other countries in the region (especially Japan and Taiwan) thanks to the Human Fertility Database (www.humanfertility.org) and the Human Fertility Collection (www.fertilitydata.org), tempo effects can now be studied for a wider set of East Asian countries.
3. Data
Data for this study comes from two different sources: the Korean Population and Housing Census and Vital Statistics. Descriptive tables derived from both data sources are available online at the Korean Statistical Information Service (KOSIS,kosis.kr). In Korea, the population census is conducted every five years, while birth registration data is available annually since 1981. To compute age- and parity-specific fertility rates, we combined the 2000 census data on parity distribution of female population by age with annual birth registration data on the number of births by age of mother and birth order in 1981‒2015. Female population by age for each year was obtained from census-based population estimates provided by Statistics Korea. All this data is available as aggregate tabulations from KOSIS, but some of them are provided in Korean only (Statistics Korea 2017).
To compute period indicators by age and parity, especially the tempo-adjusted indicator proposed by Bongaarts and Sobotka (2012), we needed first to reconstruct age and parity composition of the female population of reproductive age during the entire period analyzed here, 1981‒2015. This study builds on the method protocol used for the Human Fertility Database (Jasilioniene et al. 2015; http://www.humanfertility.org), where the annual distribution of the female population by age and parity is reconstructed from the initial dataset (referred to as ‘golden census’) combined with the series of age- and order-specific fertility rates for the subsequent years. In this study we have modified this approach as we did not use the earliest available dataset (based on the population census for 1985 or 1990) but rather decided to reconstruct the age and parity distribution on the basis of a census that took place in 2000. This decision was motivated by the higher accuracy of the more recent dataset and, also, by the fact that combining earlier censuses with subsequent vital statistics data yielded parity distribution results that were clearly biased for some cohorts.4
Because data in Korean censuses on children ever born are collected only for the women who have ever married, we had to assume that all the women who have never married were childless. As the proportion of nonmarital births has stayed below 3% for the observed period, this assumption should not affect our results significantly. Starting from the 2000 census, our dataset of age and parity distribution of the female population was then extended forward for the period up to 2015, cumulatively adding annual fertility rates by age (year of birth) and birth order for 2000‒2015 to the estimated cohort parity distribution. Analogous procedure was also applied backward, subtracting annual fertility rates by age (year of birth) and birth order in 1981‒1999 from the parity composition recorded in the 2000 census. These estimations of age– parity distribution of the female population followed the HFD method protocol (see sections 3 and 5 in Jasilioniene et al. 2015). Since the information on migration and mortality by parity is not available, we assumed that women’s migration and mortality were not affected by their fertility. This assumption should not be problematic in Korea because women’s in- and out-migration rates remained low (below 1%) in the observed period, and women’s mortality at prime reproductive ages also stayed at a very low level from the 1980s through the 2010s.
Most of the birth data was initially classified by age of mother and birth cohort (Lexis triangles). We have converted them into a cohort format (Lexis vertical parallelograms), so that the births were classified by calendar year and mother’s age reached during the year (ARDY). Consequently, the TFRs we computed differ slightly from the officially reported fertility indicators by Statistics Korea. For most years, the difference in the resulting TFRs is marginal (on average 0.02 in absolute terms, max. 0.07) and we consistently use our computations throughout this study.
4. Methods
distribution, we have estimated their fertility at higher childbearing ages assuming that the most recent age- and order-specific fertility rates observed in 2015 will remain unchanged in the subsequent years. We have used this estimation for the women born in 1966‒1978, who were aged 36 or older on 1 January 2015 and for whom more than 90% of their estimated CTFRs were realized at that time. In addition, for all birth orders combined we have also compared our results with the period indicator of average cohort fertility (ACF; Schoen 2004), which we were able to reconstruct for the period through 2002.
4.1 Fertility tempo adjustments
In 1998 Bongaarts and Feeney suggested a simple way to remove a distortion in the period TFR caused by the shift in childbearing toward earlier or later ages. Since then, demographers have discussed the usefulness and interpretation of tempo-adjusted indicators and developed other indicators aiming to calculate the period fertility rates free of the tempo effect and to address the shortcomings of the Bongaarts–Feeney method (e.g., Bongaarts and Feeney 2000; Kim and Schoen 2000; Zeng and Land 2001; Sobotka 2003; Schoen 2004; Ní Bhrolcháin 2011). These new indicators also addressed changing variance in fertility schedules by age and the effects of changes in the parity composition of the female population (Bongaarts and Feeney 2006; Bongaarts and Sobotka 2012; Kohler and Ortega 2002; Kohler and Philipov 2001; Pilipov and Kohler 2001; Yamaguchi and Beppu 2004). These methods usually involve more elaborate computation and require more extensive data. Although demographers have not reached consensus regarding the usefulness of various tempo adjustment methods, the idea and significance of the tempo effect in fertility (and also in mortality and marriage rates) has become widely accepted in demographic research (Luy 2011).
4.2 Tempo- and parity-adjusted total fertility rate (TFRp*)
In the original Bongaarts–Feeney (1998) method, the tempo distortion at each birth order is easily adjusted by dividing the conventional TFR according to birth order (TFRi) by (1 ‒ ri), where riindicates the annual rate of change in the mean age at
childbearing at birth orderi. The overall tempo-adjusted TFR (TFR*) is then computed as a sum of its order-specific components, TFRi*, wheret indicates:
∗
As this adjustment procedure is simple and intuitive and can be computed for most low-fertility countries with the available data, it is also the most widely used. However, the TFR* also suffers several shortcomings. It assumes that the shape of fertility schedules remains constant over time, even as births are shifted to earlier or later ages. In reality this assumption is often violated (Zeng and Land 2001), and the variance in fertility schedules in the rich low-fertility countries has typically increased in the last decades (Bongaarts and Sobotka 2012). The TFR* is based on order-specific indicators, which control only for age but not for the changing parity distribution of the female population, which can be a source of additional distortion. Partly because of these factors, the TFR* often displays considerable year-to-year fluctuations, which are difficult to interpret (Sobotka 2003).
To measure fertility rates free of tempo distortions we therefore chose a more sophisticated alternative, the tempo- and parity-adjusted TFR (TFRp*). Among the range of available methods it gives most stable results and its values are closest to completed cohort fertility (Bongaarts and Sobotka 2012). This method was originally developed by Bongaarts and Feeney (1998 and 2006) and by Yamaguchi and Beppu (2004). It is computed from fertility rates of the first kind (“hazard rates”) that are computed separately for each parity. The main difference from most other parity-specific indicators is that births of different birth orders are considered in this method as “separate nonrepeatable events,” and thus order-specific fertility indicators are treated as independent from each other (Bongaarts and Sobotka 2012). This feature distinguishes the method from the increment-decrement life-table framework applied in the Human Fertility Database and used, for instance, in the tempo adjustment method proposed by Kohler and Ortega (2002). In the Bongaarts–Sobotka framework, the hazard rate ofith birth at agea is not computed for women at parityi-1 only, but for all women who have not yet given birth of orderi.
The tempo effect by birth order is computed in the same manner as in the simple Bongaarts–Feeney (1998) method, but the tempo adjustment is then applied to the whole set of parity-specific hazard rates. The TFRp* index is computed as:
∗
( )= ∑ ∗( , )= ∑ 1 − exp − ∑ ( , , )( , ) ,
4.3 Average cohort fertility (ACF)
The original Bongaarts–Feeney (1998) adjustment of period fertility was criticized by some researchers not only for its instability in time, but also for its underlying assumptions and lack of conceptual clarity (Schoen 2004; Ní Bhrolcháin 2011). Schoen (2004) advocated for the average cohort fertility (ACF), an alternative indicator of period fertility that controls for tempo changes. This indicator is based on a timing index (TI), first proposed by Butz and Ward (1979) and Ryder (1980), which summarizes the proportion of cohort fertility that is contributed in a given period by all women of reproductive age. When cohorts of women are shifting births to later ages and contribute only a small portion of births in a period, the TI reaches values below 1. The overall ACF is computed from the conventional TFR, using the timing index (TI) in the period as a correction factor (Schoen 2004: 806, Eq. 8): ACF(t) = TFR(t) / TI(t). See Schoen (2004) for more details on the computation of ACF and TI.
While intuitively appealing, the use of ACF is clearly limited by the availability of cohort data. To compute this indicator for any period t, it is necessary to know or to forecast the completed fertility among each cohort of women at reproductive age in that period. This clearly limits the use of ACF not only in the settings with limited availability of cohort fertility data, but especially for analyzing fertility trends in the more recent periods, when completed fertility cannot be reliably estimated for women at younger reproductive ages. We have computed ACF in Korea up until 2002. Even these computations implied projecting completed cohort fertility for women aged 15 and older in 2002, i.e., for the cohorts born until 1987. To do so, we have extended our simple projection of completed fertility among women born in the 1970s, described above, assuming that age-specific fertility rates observed in Korea in 2015 would remain identical in all the subsequent years.
4.4 Measuring tempo distortions and decomposition analysis
whether ups and downs in the TFR in the last decades were caused by a change in fertility quantum or whether they were at least partly driven by changes in the timing of births or in the parity structure of the female population.
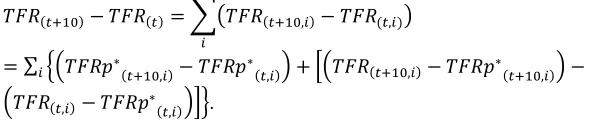
As our data is specified by birth order, we also investigate fertility trends by birth order. In addition, we perform a decomposition analysis, which aims to separate a change in the TFR into a quantum change and a change caused by tempo and parity composition effects (to simplify, we label these two effects as ‘tempo effect’ below). Both quantum and tempo effects are decomposed by birth order as described below. In this way, the change in conventional TFR over any period of interest (here we use a 10-year period fromt tot+10) can be seen as a product of the change in fertility quantum over that period (as measured by TFRp*) and of the change in the size of the tempo effect betweentandt+10:
( )− ( )= ( , )− ( , )
= ∑ ∗
( , )− ∗( , ) + ( , )− ∗( , ) −
( , )− ∗( , ) .
5. Results
5.1 Fertility trends and tempo distortions, 1981‒2015
Figure 1 summarizes fertility trends in Korea between 1981 and 2015, as measured by two period fertility measures ‒ the conventional TFR and the tempo- and parity-adjusted TFR (TFRp*) ‒ which are contrasted with the period index of average cohort fertility (ACF) and lagged completed cohort fertility (CTFR) 5. (The period indicators are also listed in Appendix Table A-1). The conventional TFR fell from 2.57 in 1981 to a low of 1.10 in 2005 ‒ the lowest level on record ‒ before recovering slightly. Overall, the TFR trajectory was far from smooth: Periods when TFR declined rapidly, especially in the early to mid-1980s, and between 1995 and 2005, alternated with the periods when it showed a broad stabilization with some fluctuations and minor rises, between the mid-1980s and the mid-1990s and, more recently, after 2005.
Figure 1: Period (1981‒2015) and cohort (1954‒1977) fertility trends in Korea (different indicators)
Source: own calculations based on census and vital statistics data.
period the TFRp* also remained remarkably close to the lagged completed cohort fertility among women born until the late 1970s, confirming the earlier findings by Bongaarts and Sobotka (2012) on the close correspondence between these two indicators. Moreover, the TFRp* also followed close to the trends in average cohort fertility. During the period when the TFR fell below 2.0 since 1984, up until 2002 when our ACF series ends, the ACF stood consistently below the TFRp* level, but the average difference between the two indexes amounted only to 0.06 in absolute terms (compared to the average difference of 0.32 between TFRp* and the TFR). This evidence suggests that TFRp* computations are robust and give further support to our conclusion that tempo effects were instrumental in Korean fertility decline to very low levels in the 1990s and 2000s.
Figure 2: Order-specific trends in period fertility in Korea, 1981‒2015
Source: own calculations based on census and vital statistics data.
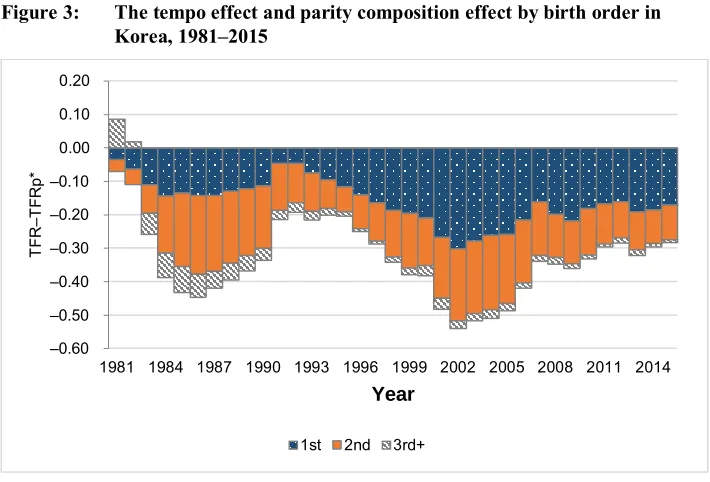
Figure 3: The tempo effect and parity composition effect by birth order in Korea, 1981‒2015
Source: own calculations based on census and vital statistics data.
5.2 Three stages of fertility decline in Korea from low to ultra-low levels
In order to delineate the role of the tempo effect and quantum decline in Korean fertility trends since the early 1980s, we decompose the observed TFR change into its tempo and quantum components, analyzed separately by birth order (Figures 4 and 5; Appendix Table A-2). We distinguish three distinct periods: (a) 1981‒1991, when Korean TFR fell rapidly below the replacement level, (b) 1991‒2001, when the TFR declined more gradually but reached a very low level below 1.5 at the end of the period, and (c) 2001‒2015, when the TFR first fell to the ultra-low levels around 1.2 and then broadly stabilized.
–0.60 –0.50 –0.40 –0.30 –0.20 –0.10 0.00 0.10 0.20
1981 1984 1987 1990 1993 1996 1999 2002 2005 2008 2011 2014
T
F
R
–T
F
R
p*
Year
Figure 4: Decomposition of changes in period TFR in three distinct periods, 1981‒2015
Source: own calculations based on census and vital statistics.
In the first period, 1981‒1991, the TFR plunged by 0.85 in absolute terms, but this fall was almost entirely due to a ‘genuine’ fall in fertility quantum, which was in turn largely concentrated at third and higher-order births. In other words, the fall in fertility in the 1980s to subreplacement levels can be seen as the tail end of the fertility transition, marked by a virtual disappearance of large families with four or more children. In contrast, the TFR decline from 1.71 to 1.34 in the next period, 1991‒2001, was dominantly (by 73%, or by 0.27 in absolute terms) driven by tempo and parity composition effects, linked especially to the postponement of first births, with quantum decline having a small role in the case of second births. This means that the shift to very low TFR levels in Korea was initially brought about by an intensive trend toward later family formation in the late 1990s and early 2000s.
-0.80 -0.60 -0.40 -0.20 0.00 0.20 0.40
1981–1991 1991–2001 2001–2015
C
ha
ng
e
in
th
e
pe
rio
d
T
F
R
Quantum change
Figure 5: Decomposition of changes in period TFR by birth order (a) Change in period TFRs attributable to tempo effects
(b) Change in period TFRs attributable to quantum effects
Source: own calculations based on census and vital statistics.
-0.40 -0.30 -0.20 -0.10 0.00 0.10 0.20
1981–1991 1991–2001 2001–2015
C ha ng e in th e pe rio d T F R
1st 2nd 3rd+
–0.54 -0.40 -0.30 -0.20 -0.10 0.00 0.10 0.20
1981–1991 1991–2001 2001–2015
C ha ng e in th e pe rio d T F R
In the last period of the ultra-low fertility between 2001 and 2015, period quantum and tempo changes had contrasting influences on the TFR. Falling first and especially second birth rates had a negative effect on fertility quantum, as measured by the TFRp*, which fell by 0.31 children per woman in that period. In contrast, the diminishing tempo effect pushed the TFR upward by 0.20 children per woman. The net balance of these two contrasting trends was a minor TFR decline, by 0.11. It is noteworthy that the importance of higher-order births in Korea diminished to the extent that they now have very little influence on fertility trends. After the turn of the century, changes in both period quantum and tempo effects have therefore become concentrated in lower-order births, at birth orders 1 and 2.
6. Discussion
The rapid shift from very high to ultra-low fertility in Korea has attracted the attention of demographers, sociologists, journalists, and policymakers. Most of their analyses, conclusions, and policy plans were based on conventional indicators of period fertility, which are strongly affected by the shift to later family formation. Our study is the first one to provide a comprehensive analysis of the role of the ongoing shift in the timing of births and in the parity distribution of the female population in fueling the Korean fertility decline. Our analysis reveals that the tempo effect has had a strong and persistent negative influence on period TFRs in Korea since the early 1980s. On average the TFRs were depressed by ‒0.33 in absolute terms between 1981 and 2015. This tempo effect was most intensive in the early 2000s, when Korea experienced for the first time ultra-low TFR levels at 1.1‒1.3. The tempo effect has been a decisive force in pushing Korean fertility to such low levels: Without the shift to later childbearing, period fertility rates in Korea would consistently stay higher and would decline more gradually, falling to the threshold of very low fertility at 1.5 only in 2014. This conclusion is supported not only by our indicator of choice to measure period fertility ‒ the tempo- and parity-adjusted total fertility rate (TFRp*) ‒ but also by the trends in period indicator of average cohort fertility rate (ACF) and in completed cohort fertility rates. Women born in 1976, who were at peak childbearing ages at the time the TFR in Korea reached a trough of 1.1 in 2005, had given birth to 1.57 children on average. This vast difference between period TFR and cohort CTFR further shows the extent to which the period TFR trends in Korea in the last decades have been affected by tempo distortions.
four or more children became rare in Korea. Second, further decline to lowest-low fertility in the 1990s and early 2000s was largely fueled by the tempo effect, connected with an intensive postponement of first and second births. Third, the tempo effect has gradually declined after the turn of the century, but, at the same time, Korea has seen a decline in first birth rates from initially high levels and a faster decline in second birth rates, as measured by TFRp*. This latest trend marks a break with the previous pattern prevalent until the 1990s and among women born until around 1970, when first birth rates were almost universal and a large majority of women had a second child.
Our findings based on the TFRp* index also offer a reinterpretation of the Korean fertility decline. Until around 2000, the decline was largely driven by the postponement of childbearing, which itself was driven by expanding education, new work and career opportunities for women, delayed marriages, and difficulties for women to combine their family commitments and labor market participation. However, net of the postponement of childbearing, fertility levels had not declined much below two births per woman. The situation changed soon after 2000, when a gradual shift toward higher childlessness and an even more pronounced trend toward a rising share of women with only one child were detected in the data. Also the completed fertility of women who were in prime childbearing ages in the early 2000s shows a clear decline, falling from 1.7 among those born in 1973 to an estimated level below 1.5 among those born in 1983. This estimate ranks Korea, alongside Japan, Italy, and Spain, among countries with the lowest cohort fertility globally (Myrskylä, Goldstein, and Cheng 2013). This change in fertility behavior proceeded in parallel with a shift away from universal marriage, since a rising share of women born in the 1970s remained unmarried in their late thirties (Yoo 2016; Kim and Yoo 2016).
high rates of ‘nonregular’ (temporary and nonstandard) work contracts (León, Choi, and Ahn 2016; Grubb, Lee, and Tergeist 2007; Ma 2013, 2014).
All these factors have made the combination of employment and childrearing difficult for women. In the past the prevailing adaptation to these labor market constraints among women was to withdraw from the labor market during pregnancy to focus on family responsibilities (Ma 2016). However, this model has been changing since the late 1990s. Four interrelated factors have made the decision among women to form a family or to have a second child more difficult. First, the share of irregular workers without guaranteed employment increased after the onset of the Asian financial crisis in 1997. Moreover, irregular and part-time jobs in Korea are not most widespread among young adults as in most other rich countries, but among women in their 40s and 50s who return to the labor market after a ‘gap’ due to family and childrearing responsibilities (Grubb, Lee, and Tergeist 2007). Second, Ma (2014) shows that while labor market conditions deteriorated after 1997, women’s attachment to the labor market strengthened. She argues that the economic crisis both increased the need for additional income in uncertain times, and thus led to a higher appreciation of women’s employment and earnings by their male partners, but it also fostered a stronger attachment of women to the labor market. As a result, more women returned to employment without interruption soon after giving birth. Third, mothers returning to the labor market in the decade since 1997 experienced marked downward mobility, typically taking jobs with lower occupational status after their return (Ma 2014). Fourth, the 2000s also saw changes in women’s attitudes to family and marriage. Younger generations of women have gradually rethought the rigid patriarchal prescription of women’s roles in the family and in assisting their husband’s career (Chang and Song 2010). Moreover, the view that people should have a child once they marry weakened substantially after 1997, as the data for married women analyzed by Kim and Yoo (2016) indicates.
timing of family formation, the trends in tempo- and parity-adjusted TFRp* and in completed fertility point out that it is unlikely to recover much above the 1.4 threshold, despite various pronatalist efforts of Korean governments enacted since 2005. The low fertility will be sustained by irregular work contracts among younger people and a combination of unfavorable labor market conditions for women with families and the persistence of traditional gender roles and expectations regarding their family roles, household tasks, caring for dependent members, and childrearing (Kim and Cheung 2015).
7. Acknowledgements
References
Anderson, T. and Kohler, H.-P. (2013). Education fever and the East Asian fertility puzzle: A case study of low fertility in South Korea. Asian Population Studies
9(2): 196‒215.doi:10.1080/17441730.2013.797293.
Bongaarts, J. and Feeney, G. (1998). On the quantum and tempo of fertility.Population and Development Review 24(2): 271‒291.doi:10.2307/2807974.
Bongaarts, J. and Feeney, G. (2000). On the quantum and tempo of fertility: Reply.
Population and Development Review 26(3): 560‒564.doi:10.1111/j.1728-4457. 2000.00560.x.
Bongaarts, J. and Feeney, G. (2006). The quantum and tempo of life-cycle events.
Vienna Yearbook of Population Research 4: 115–151. doi:10.1553/population yearbook2006s115.
Bongaarts, J. and Sobotka, T. (2012). A demographic explanation for the recent rise in European fertility. Population and Development Review 38(1): 83‒120. doi:10.1111/j.1728-4457.2012.00473.x.
Bumpass, L.L., Rindfuss, R.R., Choe, M.K., and Tsuya, N.O. (2009). The institutional context of low fertility: The case of Japan.Asian Population Studies 5(3): 215– 235.doi:10.1080/17441730903351479.
Butz, W.P. and Ward, M.P. (1979). Will U.S. fertility remain low? A new economic interpretation.Population and Development Review 5(4): 663‒688.doi:10.2307/ 1971976
Chang, K.-S. and Song, M.-Y. (2010). The stranded individualizer under compressed modernity: South Korean women in individualization without individualism.The British Journal of Sociology 61(3): 539‒564. doi:10.1111/j.1468-4446.2010. 01325.x.
Cho, N. (1996).Achievements and challenges of the population policy development in Korea. Seoul: Korea Institute for Health and Social Affairs.
Choe, M.K. and Park, K.A. (2006). Fertility decline in South Korea: Forty years of policy-behavior dialogue.Korea Journal of Population Studies 29(2): 1‒26. Coleman, D. (2013). Partnership in Europe: Its variety, trends and dissolution.Finnish
Yearbook of Population Research 48: 5‒49.
Eun, K.-S. (2007). Lowest-low fertility in the Republic of Korea: Causes, consequences, and policy responses. Asia-Pacific Population Journal 22(2): 51‒ 72.
Frejka, T., Jones, G.W., and Sardon, J.-P. (2010). East Asian childbearing patterns and policy developments. Population and Development Review 36(3): 579–606. doi:10.1111/j.1728-4457.2010.00347.x.
Goldstein, J.R., Sototka, T., and Jasilioniene, A. (2009). The end of ‘lowest-low’ fertility?Population and Development Review 35(4): 663‒699.
Government of the Republic of Korea (2015). Plan for Ageing Society and Population: 2016‒2020. Seoul: Government of the Republic of Korea (Government Publication Registration Number 1-1352000-001539-13).
Grubb, D., Lee, J.-K, and Tergeist, P. (2007). Addressing labour market duality in Korea. Paris: OECD (OECD Social, Employment, and Migration working papers 61).doi:10.1787/058184274204.
Haub, C. (2010). Did South Korea’s population policy work too well? [electronic resource]. Washington, D.C.: Population Reference Bureau. www.prb.org/ Publications/Articles/2010/koreanfertility.aspx.
Jasilioniene, A., Jdanov, D.A., Sobotka, T., Andreev, E.M., Zeman, K., and Shkolnikov, V.M. (2015). Methods protocol for the human fertility database [electronic resource]. Rostock and Vienna: Max Planck Institute for Demographic Research (MPIDR) and the Vienna Institute of Demography (VID).http://www.humanfertility.org/Docs/methods.pdf.
Jones, G. and Tay-Straughan, P.C., and Chan, A. (2008).Ultra-low fertility in Pacific Asia: Trends, causes, and policy issues. London: Routledge.
Jones, G.W. (2007). Delayed marriage and very low fertility in Pacific Asia.Population and Development Review 33(3): 453‒478. doi:10.1111/j.1728-4457.2007.00 180.x.
Jones, G.W. and Gubhaju, B. (2009). Factors influencing changes in mean age at first marriage and proportions never marrying in the low-fertility countries of East and Southeast Asia. Asian Population Studies 5(3): 237–265. doi:10.1080/ 17441730903351487.
Kim, C.-S. (2007). Parity specific approach to the plan of having an additional child.
Korea Journal of Population Studies 30(2): 97‒116.
Kim, D.-S. (2005). Theoretical explanations of rapid fertility decline in Korea. The Japanese Journal of Population 3(1): 2‒25.
Kim, D.-S. (2013). The 1997 economic crisis, changes in the pattern of achieved fertility, and ideal number of children in Korea. In: Yeung, W.-J.J. and Yap, M.T. (eds.).Economic Stress, Human Capital, and Families in Asia. Dordrecht: Springer: 73‒89.doi:10.1007/978-94-007-7386-8_5.
Kim, D.-S. and Yoo, S.H. (2016). Long-term effects of economic recession on fertility: The case of South Korea. Paper presented at the European Population Conference 2016, Mainz, Germany, August 31– September 3, 2016.
Kim, E.H.W. and Cheung, A.K.L. (2015). Women’s attitudes toward family formation and life stage transitions: A longitudinal study in Korea. Journal of Marriage and Family 77(5): 1074‒1090.doi:10.1111/jomf.12222.
Kim, H.S. (2014). Female labour force participation and fertility in South Korea.Asian Population Studies 10(3): 252‒273.doi:10.1080/17441730.2014.943941. Kim, Y.J. and Schoen, R. (2000). On the quantum and tempo of fertility: Limits to the
Bongaarts‒Feeney adjustment.Population and Development Review 26(3): 554‒ 559.doi:10.1111/j.1728-4457.2000.00554.x.
Kohler, H.P., Billari, F.C., and Ortega, J.A. (2002). The emergence of lowest-low fertility in Europe during the 1990s.Population and Development Review 28(4): 641‒680.doi:10.1111/j.1728-4457.2002.00641.x.
Kohler, H.-P. and Ortega, J.A. (2002). Tempo-adjusted period parity progression measures, fertility postponement, and completed cohort fertility. Demographic Research 6(6): 91‒144.doi:10.4054/DemRes.2002.6.6.
Kohler, H.-P. and Philipov, D. (2001). Variance effects in the Bongaarts‒Feeney formula.Demography 38(1): 1‒16.doi:10.1353/dem.2001.0004.
Kwon, T.-H. (2007). Trends and implications of delayed and non-marriage in Korea.
Asian Population Studies 3(3): 223‒241.doi:10.1080/17441730701746367. Lee, C. (2012). A decomposition of decline in total fertility rate in Korea: Effects of
Lee, S. (2015). Population policy and its challenges [in Korean]. Health and Social Welfare Forum 219: 36–49.
Lee, S. and Choi, H. (2015). Lowest-low fertility and policy responses in South Korea. In: Rindfuss, R.R. and Choe, M.K. (eds.). Low and lower fertility: Variations across developed countries. Cham: Springer: 107–123.
Lee, S.-S. (2009). Low fertility and policy responses in Korea.The Japanese Journal of Population 7(1): 57‒70.
León, M., Choi, Y.J., and Ahn, J.S. (2016). When flexibility meets familialism: Two tales of gendered labour markets in Spain and South Korea.Journal of European Social Policy 26(4): 344‒357.doi:10.1177/0958928716657278.
Luy, M. (2011). Tempo effects and their relevance in demographic analysis.
Comparative Population Studies35(3): 415‒446.
Ma, L. (2013). Employment and motherhood entry in South Korea, 1978‒2006.
Population 68(3): 419‒446.
Ma, L. (2014). Economic crisis and women’s labor force return after childbirth: Evidence from South Korea. Demographic Research 31(18): 511‒552. doi:10.4054/DemRes.2014.31.18.
Ma, L. (2016). Female labour force participation and second birth rates in South Korea.
Journal of Population Research 33(2): 173‒195. doi:10.1007/s12546-016-916 6-z.
Morgan, S.P., Zhigang, G., and Hayford, S.R. (2009). China’s below-replacement fertility: Recent trends and future prospects. Population and Development Review 35(3): 605‒629.doi:10.1111/j.1728-4457.2009.00298.x.
Myrskylä, M., Goldstein, J., and Cheng, Y.A. (2013). New cohort fertility forecasts for the developed world: Rises, falls, and reversals. Population and Development Review 39(1): 31‒56.doi:10.1111/j.1728-4457.2013.00572.x.
Ní Bhrolcháin, M. (2011). Tempo and the TFR. Demography 48(3): 841–861. doi:10.1007/s13524-011-0033-4.
OECD (2017). OECD family database [electronic resource]. Paris: OECD.www.oecd. org/els/family/database.htm.
Park, H., Lee, J.K., and Jo, I. (2013). Changing relationships between education and marriage among Korean women.Korean Journal of Sociology 47(3): 51‒76. Perelli-Harris, B., Kreyenfeld, M., Sigle-Rushton, W., Keizer, R., Lappegård, T.,
Jasilioniene, A., Berghammer, C., and Di Giulio, P. (2012). Changes in union status during the transition to parenthood in eleven European countries, 1970s to early 2000s. Population Studies 66(2): 167‒182. doi:10.1080/00324728.2012. 673004.
Philipov, D. and Kohler, H.-P. (2001). Tempo effects in the fertility decline in Eastern Europe: Evidence from Bulgaria, the Czech Republic, Hungary, Poland, and Russia.European Journal of Population 17(1): 37‒60.
Rindfuss, R.R. and Choe, M.K. (2015). Low and lower fertility: Variations across developed countries. Cham: Springer.doi:10.1007/978-3-319-21482-5.
Ryder, N.B. (1980). Components of temporal variations in American fertility. In: Hiorns, R.W. (ed.). Demographic patterns in developed societies. London: Taylor and Francis: 15‒54.
Sacchi, S. and Roh, J. (2016). Conditionality, austerity and welfare: Financial crisis and its impact on welfare in Italy and Korea. Journal of European Social Policy
26(4): 358‒373.doi:10.1177/0958928716657277.
Schoen, R. (2004). Timing effects and the interpretation of period fertility.Demography
41(4): 801‒819.doi:10.1353/dem.2004.0036.
Sobotka, T. (2003). Tempo-quantum and period-cohort interplay in fertility changes in Europe: Evidence from the Czech Republic, Italy, the Netherlands, and Sweden.
Demographic Research 8(6): 151‒214.doi:10.4054/DemRes.2003.8.6.
Sobotka, T. (2004). Is lowest-low fertility in Europe explained by the postponement of childbearing? Population and Development Review 30(2): 195–220. doi:10.111 1/j.1728-4457.2004.010_1.x.
Sobotka, T. (2017). Post-transitional fertility: the role of childbearing postponement in fueling and the shift to low and unstable fertility levels. Journal of Biosocial Science 49(S1): S20–S45.doi:10.1017/S0021932017000323.
Sobotka, T. and Lutz, W. (2011). Misleading policy messages derived from the period TFR: Should we stop using it?Comparative Population Studies 35(3): 637–664. doi:10.4232/10.cpos-2010-15en.
Suh, S., Cho, N., Choi, S., Suh, M., Jun, K., Lee, S., Lee, J., Yoon, H., Lim, J., Choi, I., Choi, H., Lee, J., Song, M., and Ki, J. (2016). 50 years of Korean population policy: From antinatalist to pronatalist [in Korean]. Sejong City: Ministry of Health and Welfare and Korea Institute for Health and Social Affairs.
Tan, P.L., Morgan, S.P., and Zagheni, E. (2016). A case for reverse one-child policies in Japan and South Korea? Examining the link between education costs and lowest-low fertility. Population Research and Policy Review 35: 327‒350. doi:10.1007/s11113-016-9390-4.
Thomson, E. (2014). Family complexity in Europe. The Annals of the American Academy of Political and Social Science 654(1): 245‒258.doi:10.1177/000271 6214531384.
United Nations (2017). World population prospects: The 2017 revision [custom data acquired via website]. New York: United Nations, Department of Economic and Social Affairs, Population Division.https://esa.un.org/unpd/wpp/DataQuery/. Woo, H. (2012). Birth cohort and educational differences in the marital and fertility life
course in South Korea [in Korean]. Korea Journal of Population Studies 35(1): 151‒179.
Yamaguchi, K. and Beppu, M. (2004). Survival probability indices of period total fertility rate. Chicago: The Population Research Centre, NORC, and the University of Chicago (Discussion paper series 2004-01).
Yoo, S.H. (2006). On regional fertility differentials: Understanding the causal mechanisms of low fertility in Korea [in Korean]. Population and Society 2(2): 53‒76.
Yoo, S.H. (2014). Educational differentials in cohort fertility during the fertility transition in South Korea. Demographic Research 30(53): 1463‒1494. doi:10.4054/DemRes.2014.30.53.
Yoo, S.H. (2016). Postponement and recuperation in cohort marriage: The experience of South Korea. Demographic Research 35(35): 1045‒1078. doi:10.4054/ DemRes.2016.35.35.
Zeng, Y. and Land, K.C. (2001). A sensitivity analysis of the Bongaarts‒Feeney method for adjusting bias in observed period total fertility rates. Demography
Appendixes
Table A-1: TFR, ACF, lagged CTFR, TFRp*, tempo effect, and women’s mean age at first birth (MAFB), 1981–2015
Year TFR ACF Lag.
CTFR TFRp*
Tempo effect
(TFR–TFRp*) MAFB
1981 2.566 2.182 2.192 2.550 0.016 24.7
1982 2.383 2.115 2.130 2.472 ‒0.089 24.7
1983 2.057 2.054 2.057 2.315 ‒0.259 24.8
1984 1.738 2.006 1.958 2.125 ‒0.387 24.9
1985 1.654 1.975 1.922 2.085 ‒0.431 25.1
1986 1.581 1.954 1.922 2.026 ‒0.445 25.2
1987 1.531 1.935 1.908 1.950 ‒0.419 25.4
1988 1.544 1.922 1.899 1.938 ‒0.394 25.6
1989 1.557 1.911 1.887 1.924 ‒0.367 25.8
1990 1.571 1.902 1.892 1.907 ‒0.335 26.0
1991 1.712 1.893 1.886 1.925 ‒0.213 26.1
1992 1.759 1.884 1.886 1.952 ‒0.192 26.2
1993 1.718 1.874 1.888 1.934 ‒0.215 26.4
1994 1.725 1.863 1.889 1.926 ‒0.201 26.5
1995 1.703 1.849 1.873 1.907 ‒0.204 26.6
1996 1.645 1.833 1.864 1.894 ‒0.249 26.7
1997 1.587 1.815 1.856 1.873 ‒0.286 26.9
1998 1.510 1.796 1.809 1.851 ‒0.341 27.1
1999 1.465 1.776 1.809 1.844 ‒0.379 27.3
2000 1.521 1.758 1.808 1.902 ‒0.381 27.5
2001 1.342 1.737 1.762 1.823 ‒0.482 27.8
2002 1.197 1.717 1.733 1.737 ‒0.540 28.1
2003 1.204 1.733 1.720 ‒0.517 28.4
2004 1.177 1.722 1.686 ‒0.509 28.7
2005 1.099 1.669 1.585 ‒0.486 28.9
2006 1.143 1.624 1.562 ‒0.419 29.1
2007 1.270 1.609 1.609 ‒0.339 29.2
2008 1.206 1.609 1.552 ‒0.346 29.4
2009 1.159 1.581 1.520 ‒0.361 29.6
2010 1.232 1.563 ‒0.332 29.9
2011 1.249 1.544 ‒0.296 30.0
2012 1.300 1.584 ‒0.284 30.2
2013 1.188 1.509 ‒0.320 30.4
2014 1.204 1.500 ‒0.295 30.7
Table A-2: Contribution of tempo and quantum components of period fertility to changes in period TFR in Korea by birth order in three periods (1981–1991, 1991‒2001, and 2001‒2015)
Period TFR at the start of the period
TFR at the end of the period
Difference Birth order Total
birth orders
1st 2nd 3rd+
1981‒1991 2.566 1.712 ‒0.854 Tempo ‒0.012 ‒0.104 ‒0.113 ‒0.229
1% 12% 13% 27%
Quantum ‒0.023 ‒0.062 ‒0.540 ‒0.625
3% 7% 63% 73%
1991‒2001 1.712 1.342 ‒0.370 Tempo ‒0.222 ‒0.041 ‒0.006 ‒0.269
60% 11% 2% 73%
Quantum ‒0.038 ‒0.080 0.017 ‒0.101
10% 22% ‒5% 27%
2001‒2015 1.342 1.234 ‒0.107 Tempo 0.097 0.078 0.025 0.200
‒90% ‒72% ‒24% ‒186%
Quantum ‒0.084 ‒0.179 ‒0.044 ‒0.307