The University of San Francisco
USF Scholarship: a digital repository @ Gleeson Library |
Geschke Center
Master's Theses Theses, Dissertations, Capstones and Projects
Fall 5-22-2015
Transcriptional Regulation by DAX-1 in
Pluripotent and Differentiated Cells
Alexandra C. Maramba
University of San Francisco, [email protected]
Follow this and additional works at:https://repository.usfca.edu/thes
Part of theBioinformatics Commons,Biology Commons, and theLaboratory and Basic Science
Research Commons
This Thesis is brought to you for free and open access by the Theses, Dissertations, Capstones and Projects at USF Scholarship: a digital repository @ Gleeson Library | Geschke Center. It has been accepted for inclusion in Master's Theses by an authorized administrator of USF Scholarship: a digital repository @ Gleeson Library | Geschke Center. For more information, please [email protected].
Recommended Citation
Abstract
DAX-1, an orphan nuclear hormone receptor, acts mainly as a repressor through transcriptional protein complexes. Its unique structure and specific expression raises questions as to what its precise interactions are and how it mediates its repressive function. While it is known to play a role in sexual development and adrenal insufficiency, expression in certain types of cancer suggests additional functions and interactions. Knock in of DAX-1 into a low-DAX-1 expressing cancer cell line has been previously observed to increase apoptosis, while, inversely, down in a high-DAX-1 expressing cancer cell line shows a decrease in apoptosis. Target genes that belong to the TNFα and BCL-2 families have shown changes in expression correlating to the modified levels of DAX-1 in knock-down experiments. Direct regulation of BCL-2, one of the target genes of interest, was investigated further based on mirrored expression changes of DAX-1 in knock-down and knock in experiments through ChIP experiments. These findings emphasize a significant role of DAX-1 in moderating apoptosis in a breast cancer cell line.
In the context of undifferentiated mouse embryonic stem cells, Dax-1 is highly expressed and has been shown to be an important contributor to the
pluripotent state. Potential downstream targets of Dax-1 were previously identified based on significant changes in expression when Dax-1 expression was down
seq data. Ultimately, while Dax-1 is not a master regulator, its transcriptional control of specific genes that are key in the maintenance of pluripotency is an
important component of stem cell growth and differentiation. Bioinformatic analysis of ChIP-seq experiments brought to light general patterns as to how Dax-1
Table of Contents
Page Number
Abstract ... 1
Table of Contents ... 3
Acknowledgements ... 4
List of Figures ... 5
List of Tables ... 8
List of Abbreviations ... 10
Chapter 1 Nuclear Hormone Receptors and DAX-1 Introduction ... 13
Chapter 2 Manipulation of DAX-1 Expression in a Range of Model Systems Introduction ... 19
Methods ... 29
Results ... 38
Discussion ... 46
Chapter 3 DAX-1 Mediates Expression of Apoptosis-Inducing Genes in Human Breast Cancer Introduction ... 47
Materials and Methods ... 61
Results ... 70
Discussion ... 87
Chapter 4 Dax-1 Knock-down Effects on Pluripotent Gene Network in Mouse Embryonic Stem Cells Introduction ... 89
Materials and Methods ... 94
Results ... 97
Discussion ... 106
Chapter 5 Functional enrichment analysis of Dax-1 ChIP-seq high-throughput data Introduction ... 108
Materials and Methods ... 113
Results ... 116
Discussion ... 123
End Summary ... 125
Acknowledgements
Principal Investigator
Dr. Christina Tzagarakis-Foster
Thesis Committee Members
Dr. James Sikes Dr. Cary Lai
Tzagarakis-Foster Laboratory
Hai Nguyen Amy Scandurra Michael Heskett Victor Gavallos
University of San Francisco Biology Graduate Students
Carolyn Tu
Cendy Valleoseguera Vivian Young
University of San Francisco Biology Department Faculty and Staff
Words cannot fully express how grateful I am for the support of my PI Dr.
Tzagarakis-Foster and labmates. This is sepecially dedicated to my late father, who couldn’t see this to completion but continues to be a source of strength and
List of Figures
Figure 1-1. Functional domain structures of a general nuclear hormone receptor and
DAX-1...17
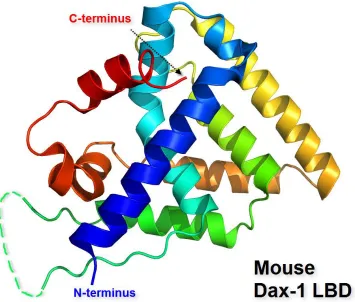
Figure 1-2. X-Ray Crystallography Illustration of Mouse Dax-1 Ligand Binding Domain...18
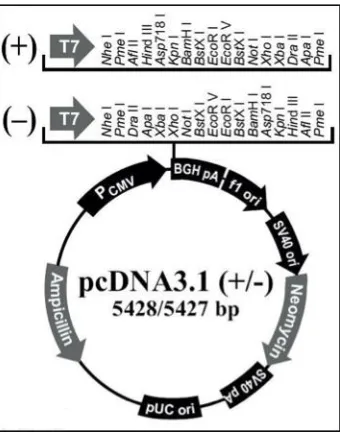
Figure 2-1. pcDNA3.1 vector (Life Technologies)...21
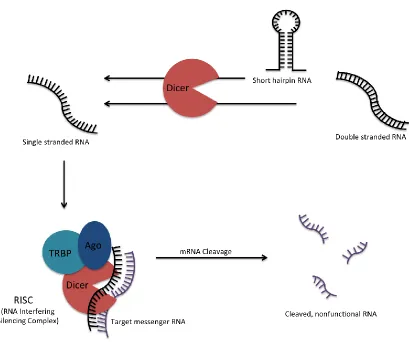
Figure 2-2. RNA interference mechanism...24
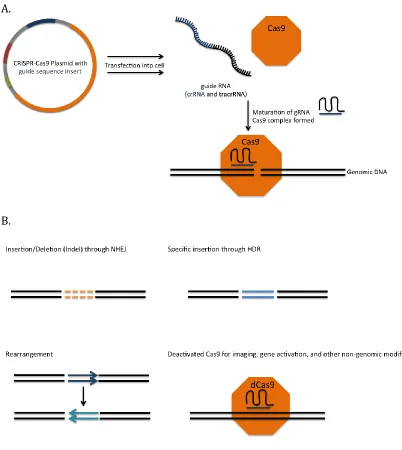
Figure 2-3. CRISPR-Cas9 knock-down mechanism...28
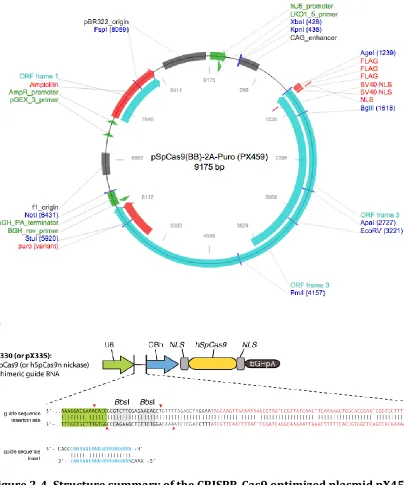
Figure 2-4. Structure summary of the CRISPR-Cas9 optimized plasmid pX459...34
Figure 2-5. CRISPR targets within the Dax-1 gene (first exon)...36
Figure 2-6. CRISPR targets within the Dax-1 gene (second exon)...37
Figure 2-7. Introduction of DAX-1 expression in MCF7 cells by transient transfection with pCDNA DAX-1...40
Figure 2-8. siRNA DAX-1 knock-down in MCF10A...41
Figure 2-9. siRNA Dax-1 knock-down in mESC...42
Figure 2-10. Dax-1 specific CRISPR-Cas9 plasmid development...43
Figure 2-11. CRISPR Dax-1 knock-down in mESC...45
Figure 3-1. Estimated Cancer Deaths in the US...49
Figure 3-2. Workflow of PCR Array...50
Figure 3-3. TNFα pathway, with the major interactions leading to either cell proliferation or apoptosis through the triggering of the caspase cascade...53
Figure 3-4. BCL-2 family apoptosis pathway...55
Figure 3-6. Workflow of X-ChIP Assay (AbCam)...60
Figure 3-7. Targeted regions of the BCL-2 and BAX promoter...68
Figure 3-8. Cell flow cytometry of Annevin V and propidium iodide stained MCF7 cells untreated and treated with pcDNA-DAX1...71
Figure 3-9. qPCR results of the anti-apoptotic genes tested in the MCF10A knock-down total mRNA samples...74
Figure 3-10. qPCR results of the pro-apoptotic genes tested in the MCF10A knock-down total mRNA samples...76
Figure 3-11. qPCR results of the anti-apoptotic genes tested in the MCF7 knock-down total mRNA samples...79
Figure 3-12. qPCR results of the pro-apoptotic genes tested in the MCF7 knock-down total mRNA samples...80
Figure 3-13. Western blot of candidate DAX-1 targets BCL-XL and BAX...84
Figure 3-14. Chromatin immunoprecipitation (ChIP) experiments targeting DAX-1 binding to the BCL-2 promoter...86
Figure 4-1. Stem cell origins in the mammalian embryo...91
Figure 4-2. qPCR results of siRNA Dax-1 knock-down mESC...98
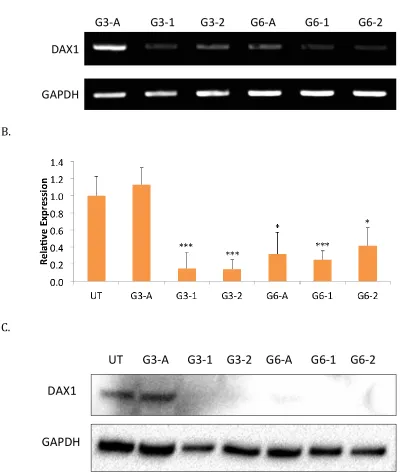
Figure 4-3. qPCR results of CRISPR Dax-1 knock-down mESC...102
Figure 5-1. Statistical analysis of ChIP-seq data using the GREAT online annotation software...112
List of Tables
Table 2-1. siRNA sequences for MCF10A treatment...32
Table 2-2. siRNA sequences for mESC treatment...32
Table 2-3. Sense and anti-sense sequences for oligonucleotides constructed using the online CRISPR Design web program to target the Dax-1 gene...35
Table 3-1. Anti-apoptotic candidate target genes...56
Table 3-2. Pro-apoptotic candidate target genes...57
Table 3-3. Thermocycler conditions and steps for standard PCR...62
Table 3-4. Thermocycler conditions and steps in the two-step amplification program for qPCR...63
Table 3-5. Primers for apoptosis qPCR analysis...65
Table 3-6. Monoclonal Antibodies used for Western Blotting...66
Table 3-7. Antibodies used for ChIP assay...69
Table 3-8. Primer sets corresponding to promoter regions of BCL-2 and BAX...69
Table 3-9. Comparison of candidate genes in MCF10A and MCF7 cells...83
Table 4-1. Dax-1 candidate target genes in mESC and their roles in mediating pluripotency and differentiation...93
Table 4-2. Pluripotency Candidate gene primers...95
Table 4-3. Comparison of siRNA and CRISPR Dax-1 candidate gene results...105
Table 5-1. Parameters for GREAT Version 3.0.0 online analysis...114
Table 5-2. Top Five Interactions in Dax-1 ChIP-seq interactions...118
List of Abbreviations
AHC: Adrenal Hypoplasia Congenita Ago2: Argonaute-2
AR: Androgen Receptor
BADGE: Bisphenol A diglycidyl ether; 2,2'-[(1-Methylethylidene)bis(4,1-phenyleneoxymethylene)]bis-oxirane
BAX: Bcl-2-associated X Protein
BAK: Bcl-2 Homologous Antagonist Killer BCL-2: B-cell lymphoma 2
BCL-XL: B-cell lymphoma extra large BCL-XS: B-cell lymphoma extra small
BH1-4: Bcl-2 homology domain 1 through 4 Cas: CRISPR Associated Proteins
Caspases: Cysteine-aspartic Proteases; Cysteine-dependent aspartate-directed proteases
cDNA: Complimentary DNA
ChIP: Chromatin Immunoprecipitation
ChIP-seq: Direct High-throughput Chromatin Immunopreciptation Sequencing CRISPR: Clustered Regularly Interspaced Short Palindromic Repeats
crRNA: CRISPR repeat-spacer RNA
DAX-1: Dosage Sensitive Sex Reversal Adrenal Hypoplasia Congenita, critical region on the X Chromosome, Gene 1
DMEM: Dulbecco’s Modified Eagle Medium DNA: Deoxyribonucleic Acid
DSS: Dosage Sensitive Sex Reversal ER: Estrogen Receptor
ERα: Estrogen Receptor alpha FBS: Fetal Bovine Serum
FITC: Fluorescein Isothiocyanate
GAPDH: Glyceraldehyde 3-Phosphate Dehydrogenase GRTH: Gonadotropin-regulated Testicular Helicase H: The amino acid histidine
HDR: Homology Directed Repair I: The amino acid isoleucine IgG: Immunoglobulin G
Indel: Insertion/deletion mutation LBD: Ligand Binding Doman L: The amino acid leucine mESC: Mouse Embryonic Stem Cell
MOMP: Mitochondrial Outer Membrane Permeabilization mRNA: Messenger RNA
NC: Negative Control
NR: Nuclear Receptor
RBS: Phosphate Buffered Saline PCR: Polymerase Chain Reaction PI: Propidium Iodide
PS: Phosphatidylserine PVDF: Polyvinylidene Fluoride
qPCR: Quantitative Polymerase Chain Reaction RNA: Ribonucleic Acid
RNAi: RNA Interference
RISC: RNA Interference Silencing Complex RT-PCR: Real Time Polymerase Chain Reaction SF-1: Steroidogenic Factor-1
siRNA: Short Interfering RNA shRNA: Short-hairpin RNA TBS: Tris Buffered Saline
TNFα: Tumor Necrosis Factor alpha
TRADD: TNFRSF1A-associated via death domain TSS: Transcription Start Site
UT: Untreated WT: Wild-type
Chapter 1
Nuclear Hormone Receptors and DAX-1
Introduction
Nuclear hormone receptors (NHRs) are a superfamily of eukaryotic
transcription factors that are involved in the regulation of specific target genes for various biological processes through the response to hormones and other metabolic ligands [1]. These various proteins share a conserved general domain structure, as illustrated in Figure 1-1A: an N-terminal domain (A/B), a DNA binding domain, or DBD (C), a flexible hinge region (D), a ligand binding domain, or LBD (E), and a C-terminal domain (F). There are seven subfamilies, identified as NR0 through NR6, based on sequence similarity in the conserved DBD and LBD regions of the genes [2]. This sub-categorization helps dictate the gene nomenclature rules.
These proteins generally have an effect on gene transcription upon binding of a ligand [3]. In general, once these transcription factors bind ligand and are activated, they can bind to specific sequences, also known as hormone response elements (HREs), present within the regulator regions of target genes. Typically, NHRs carry out their activity by forming dimers on these response element sequences. The combination of NHRs may either be as homodimers, composed of two identical receptors, or as heterodimers, composed of different receptors [4].
In contrast, NHRs that generally act as repressors or corepressors have a consensus motif known as a CoRNR box, consisting of an Lxx H/I xxx I/L motif that is
manifested as an extended helix, and interacts with similar residues such as the LxxLL motif. The variance in the length of the helical interface allows for a difference in the transcription factor complexes [7].
In humans, there have been 48 different NHRs identified to date. Mice, with 47 known NHRs, share a similar number of this group of proteins encoded in their genome. This conservation of nuclear receptors is reflected in only members of the animal kingdom [8], and is not observed in any other relatives of metazoans [9]. NHRs have been studied in great detail in numerous model systems because of their involvement with key signaling pathways and the potential for targeting in diseases.
Proteins within the NHR family can be further categorized into three groups: steroid hormone receptors, non-steroid hormone receptors, and orphan receptors. Steroid hormone receptors respond to steroids, while non-steroid hormone
receptors interact with other ligands such as thyroid hormone, retinoic acid, and vitamin D2. Lastly, the remaining NHRs that have no known ligand interaction are classified as orphan nuclear hormone receptors. [10]
DAX-1 is a unique orphan nuclear hormone receptor that is encoded by the
NR0B1 gene. The protein name stands for dosage sensitive sex reversal, adrenal hypoplasia congenital on the X chromosome, gene 1; for humans, it is written out as DAX-1, while for mice it is noted as Dax-1 [11]. The protein product of the human
alanine/glycine rich repeats that each are about 65 to 70 amino acids long in place of the DNA binding domain, as shown in Figure 1-1B. It shares this unusual domain with a close cousin within the NHR family called SHP (small heterodimer partner), encoded by the NR0B2 gene [12] [13].
While the ligand-binding domain is conserved, DAX-1 is identified as an orphan due to no known ligand interaction. The lack of the DNA binding domain, no known ligand interaction, and LxxLL sites strongly implies that DAX-1 primarily functions within the cell through interactions with other proteins, such as Wilm’s tumor 1 (WT1) and steroidogenic factor 1 (SF-1) [14] rather than direct binding to DNA as a transcriptional factor. And despite having LxxLL sites, which is typical of coactivators, DAX-1 has been shown to act as a corepressor [15]. X-ray
crystallographic data has provided some insight as to how DAX-1 mediates its repressive function through binding directly to other NHR proteins. The entire protein has yet to be isolated and crystallized, but the LBD region of DAX-1 has been successfully crystallized in complex with the protein LRH-1, as illustrated in Figure 1-2. The site of interaction with LRH-1 is at an extended surface, therefore occluding binding of other co-activators to LRH-1 [16]. This type of protein-protein interaction is a likely explanation of why DAX-1 is a strong transcriptional repressor.
diseases, DAX-1 has a restricted expression pattern. It is highly expressed in stem cells before differentiation, and is noted to contribute to early embryogenesis [11]. In an adult organism, expression is limited to select steroidogenic organs, especially within the hypothalamus-pituitary-adrenalgonadal axis [19].
More recently, there has been a proposed role of DAX-1 in various cancers, in addition to its role in normal cells. Numerous NHRs have been linked to the
A.
B.
Figure 1-1. Functional domain structures of a general nuclear hormone receptor and DAX-1. A. The general nuclear hormone receptor gene regions with the following labeled structures: an N-terminal domain (A/B), a DNA binding domain, or DBD (C), a hinge region (D), a ligand binding domain (E), and a C-terminal domain (F), and B. the DAX-1 protein structure, with the 3.5
Chapter 2
Manipulation of DAX-1 Expression in a Range of Model Systems
Introduction
As previously mentioned, DAX-1 expression is restricted to stem cells and a number of organs within a mature organism. The research detailed in this thesis examines the role of DAX-1 in human breast cancer cells as well as mouse
embryonic stem cells. Both these research projects required a means to study and manipulate DAX-1 expression in order to explore the outcome of this change. For these experiments, the human cell lines MCF7 (epithelial breast cancer cells) and MCF10A (mammary epithelial cells) and the mouse embryonic stem cell line E14 were used. MCF7 cells are typically used as a triple positive cell culture model, because these cells express estrogen receptor, progesterone receptor, and HER2 [22]. Transient transfection assays were used to exogenously express DAX-1 in the cell types with little to no DAX-1 expression, while RNAi and CRISPR methods were utilized to reduce or eliminate DAX-1 expression in cell lines with endogenous expression of DAX-1. Once these models had been established, we could explore the outcome of changes in DAX-1 expression in both human cancer cells (Chapter 3) and mouse embryonic stem cells (Chapter 4).
pcDNA expression vector
enzyme target sites in both directions for sequence insertion (Figure 2-1). Other key features of the plasmid include the genes for ampicillin and neomycin resistance, which aid in the selection process after transformation into competent E. coli. The entire human DAX-1 coding sequence was amplified by PCR and cloned into the plasmid using the BamHI and XhoI restriction enzyme sites. Confirmation of correct insertion of DAX-1 into pcDNA3.1 was confirmed by DNA sequencing. This
Figure 2-1. pcDNA3.1 vector (Life Technologies) utilized in transient
RNA interference
RNA interference is a gene silencing technique that utilizes non-coding RNAs to target messenger RNA present in an organism and affect gene expression before translation into protein [23]. Numerous forms of RNA can be utilized, ranging from double stranded RNA to short hairpin RNA, with different structures and stability. While this phenomenon is conserved across most complex organisms, it was not exploited until the discovery of sequence-specific short interfering RNAs (siRNAs). These are 21 nucleotide long sequences, with 19 of those nucleotides specific to the target sequence to form a duplex, and the remaining 2 unpaired at the 3’ ends [24].
The pathway of RNA interference, illustrated in Figure 2-2, starts in the cytoplasm when Dicer, an RNAse III endonuclease, processes siRNA precursors such as dsRNA or shRNAs. Certain kinds of optimized techniques in research skip this processing step and may allow for the transfection of the shortened siRNA from the start. A “mature” siRNA molecule then enters into a multi-protein RNA-induced silencing complex, or RISC. The completed complex pairs the siRNA with the target mRNA at the complementary region, and the protein Argonaut-2 (Ago2) mediates the cleavage of the siRNA-mRNA pair within the complex. Other notable proteins involved in RISC include a transactivating response RNA-binding protein, or TRBP, that helps facilitate the transfer of Dicer-generated fragments to Ago2 for RNA degradation. While there are cleavage independent mechanisms to block translation of the targeted mRNA, the formation of the complex allows for the target to be broken up several times. The resulting smaller RNA fragments are ultimately
CRISPR-Cas
A recent technique utilizing an endogenous mechanism called CRISPR-Cas has been propelled as a more permanent modification to protein expression. The name is short for “clustered regularly interspaced short palindromic repeats – CRISPR associated proteins.” In contrast to commonly used techniques, such as RNAi that targets a gene at the RNA level in order to reduce its expression, CRISPR affects cell functions through genomic editing [26].
The technique was developed based on microbial immune systems, where RNA-guided endonucleases can interact with specific targets, typically exogenous DNA from viruses or other bacteria, and allows the organism to both eliminate the invading genomic information as well as acquire immunity against similar viruses and plasmids [27]. Optimized plasmids have been developed to contain core
elements of the CRISPR-Cas system, selection genes for transformation and cloning, and specific restriction enzymes sites for the insertion of a target guide sequence.
One of the main elements of the most commonly used optimized system is Cas9, part of the Cas protein family. This family, whose name is short for “CRISPR-associated genes,” consists of microbial endonucleases than can utilize short RNA sequences as guides to cause damage to genomic DNA [28]. Cas9 is specifically used for research applications because while other systems may require a complex of multiple Cas proteins, Cas9 is large protein that alone is sufficient for generating a mature guide RNA and cleaving the target DNA [29].
conserved repeat fragments and a variable spacer sequence that is complementary to a target region [30]. While the length of this sequence varies in size depending on the type of Cas protein used, the Cas9 protein is able to create and use a guide with a target sequence as short as 21 nucleotides long. Together with a trans-activating crRNA (tracrRNA), an RNA duplex is formed and matured to form a hybrid, acting as a complete guide for Cas9 [31]. This allows for Cas9 to situate itself at the target location with base-pair matching of the guide RNA and cause DNA damage (Figure 2-3).
The damage caused by the Cas9 endonuclease is a double-stranded break that can be repaired in two ways. Nonhomologous end joining, or NHEJ, is an imprecise type of repair that through immediate ligation to close the break introduces insertion and deletion (or indel) mutations that vary in length [32]. When applied to damage within a gene, this disrupts the translational reading frame; if applied in a noncoding region, this can potentially disrupt a binding site of transcriptional factors. Another type of DNA repair is homology-directed repair, or HDR, which utilizes a template to repair the site of damage. Through the use of the of a donor template, more precise point mutations or insertions can occur at the site of damage [33].
A.
B.
Methods
Cell Culture
MCF7 epithelial breast cancer cells were obtained from American Type Culture Collection. The cells were cultured and passaged in a 5% carbon dioxide tissue culture incubator at 37°C. Cells were maintained in Dulbecco’s Modified Eagle Medium (DMEM) with L-glutamine and without phenol red, supplemented with 10% charcoal-stripped fetal bovine serum (American Type Culture Collection, treated with dextran coated charcoal from Sigma-Aldrich) and 1% penicillin/streptomycin (Gibco).
MCF10A human mammary epithelial cells were obtained from American Type Culture Collection. The cells were cultured in the same incubator
conditions as MCF7 cells. Complete MCF10A media used Dulbecco’s Modified Eagle Medium (DMEM) with phenol red and additional supplements of 10% fetal bovine serum (American Type Culture Collection), 1%
penicillin/streptomycin (Gibco), 100 ng/mL of cholera toxin (Sigma-Aldrich), and mammary epithelial growth medium (MEGM) SingleQuot additives [hydrocortisone (05 μg/mL, human EGF (10ng/mL), insulin (10 μg/mL)] (Lonza Corporation).
(DMEM) with phenol red, GlutaMax, and 4.5 g/L D-glucose. For the complete media, additional supplements of 15% fetal bovine serum (American Type Culture Collection), 1% penicillin/streptomycin (Gibco), 1% non-essential amino acids (Gibco), 1,000 U/mL Leukemia Inhibitory Factor (Sigma-Aldrich), and 0.1mM β-mercaptoethanol (Promega) were added through a sterile filter. This combination is modified from those outlined by the Cho Lab [39].
To passage cells, flasks were washed with phosphate buffered saline (PBS) and treated with Trypsin-EDTA (0.05%) with phenol red (Gibco) at 37°C until cells lifted from the flask. Cells were then re-suspended and passaged, ranging from 1:5 to a 1:10 ratio.
DAX1 knock-in into MCF7 cells
A pcDNA3.1-DAX1 construct was provided by Dr. Christina
Tzagarakis-Foster, and transfected into the MCF7 cells using Lafectine RU50 according to protocol, using 50uL for every μg of plasmid. Treated cells were initially seeded in “low” media, composed of DMEM without phenol red
DAX1 knock-down in MCF10A and E14 cells with siRNA
A set of three synthetic double stranded stealth siRNA oligonucleotides designed to target the human DAX-1 gene were obtained from Life
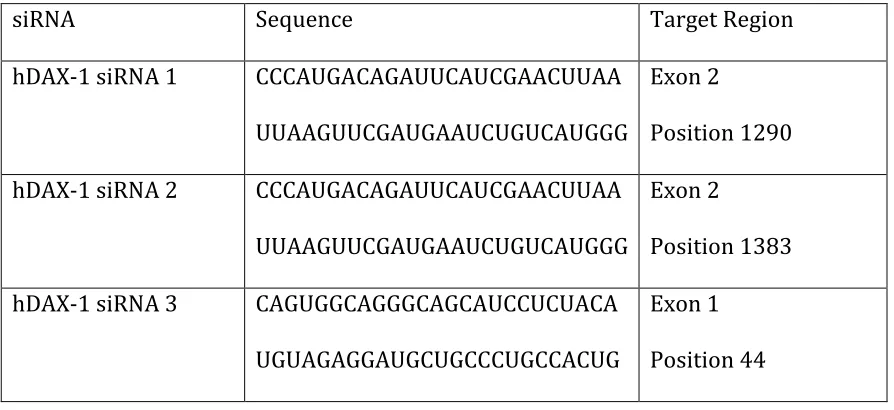
Technologies. The three siRNAs, which targeted human DAX-1 in different regions of the gene, were used for transfection into MCF10A cells, as shown in Table 2-1. Three synthetic Silencer pre-designed small interfering RNA (siRNA) oligonucleotides targeting mouse Nr0b1 (Life Technologies) were utilized for Dax-1 knock-down, with sequences and targeting sites listed in Table 2-2. Ambion Silencer Negative Control #1 was used as the
non-targeting siRNA sample. Six-well plates were seeded with 500,000 MCF10A cells per well in complete media and reverse transfected using Lafectine RU50 (MednaBio). The total concentration of the siRNA for MCF10A cells was 300pmol for each well, while two concentrations of 20pmol and 80pmol of each individual siRNA was used for the mouse embryonic stem cells. Mouse cells were treated a second time with a change of media after 24 hours. Collections for mRNA and protein lysate analysis were carried out after 48 hours.
Statistical Anaylsis
p<0.05, a double asterisk (**) represents samples that were p<0.005, and a triple asterisk (***) represents samples that were p<0.001.
Table 2-1. siRNA sequences for MCF10A treatment.
siRNA Sequence Target Region hDAX-1 siRNA 1 CCCAUGACAGAUUCAUCGAACUUAA
UUAAGUUCGAUGAAUCUGUCAUGGG
Exon 2
Position 1290 hDAX-1 siRNA 2 CCCAUGACAGAUUCAUCGAACUUAA
UUAAGUUCGAUGAAUCUGUCAUGGG
Exon 2
Position 1383 hDAX-1 siRNA 3 CAGUGGCAGGGCAGCAUCCUCUACA
UGUAGAGGAUGCUGCCCUGCCACUG
Exon 1 Position 44
Table 2-2. siRNA sequences for mESC treatment. Sequences were not made available with purchase.
siRNA Target Region mDax-1 siRNA 1 Exon 1, Position 981 mDax-1 siRNA 2 Exon 1, Position 1187 mDax-1 siRNA 3 Exon 1, Position 987
CRISPR-mediated knock-down in E14 mESC
vector backbone to target mouse DAX1 were designed using the online CRISPR Design web program (http://crispr.mit.edu/). Target areas for each guide are shown in Figures 2-5 and 2-6, with sense and antisense sequences listed in Table 2-3. Annealed oligonucleotides were inserted into the pX459 plasmid using BbsI as the restriction enzyme to cut the insertion site and T4 DNA ligase (New England Biolabs). Proper insertion of the guide sequences into the plasmid backbone was verified through both a BbsI/AgeI double digest, based on the restriction enzyme target sites illustrated in Figure 2-4B, as well as DNA sequencing using a U6 primer (MCLAB, Molecular Cloning Laboratories). Modified plasmids with successful insertions were
transformed into competent DH5E. coli (New England Biolabs) and plasmid DNA was extracted using the Plasmid Plus Maxi kit (Qiagen). Complete pX459 with oligonucleotide insertions were transfected into mESCs using Lafectine RU50 1000ng/μL according to the product protocol using reduced media (Dulbecco’s Modified Eagle Medium (DMEM) with phenol red; 10% FBS, LIF, β-mercaptoethanol). Cells were treated for 48 hours before
A.
B.
Table 2-3. Sense and anti-sense sequences for oligonucleotides constructed using the online CRISPR Design web program to target the Dax-1 gene. Guid
e Nam e
Sense Anti-sense Targ
et Exon
Color Code
G3 caccGGGTGAGGACCACCCGT
GGC aaacGCCACGGGTGGTCCTCACCC Exon 1 green
G6 caccGCTGAGATTCATCAATA
agtttataaagctgtcatagaaatggactttttgccatttaagcatttctttccccaataaaggaaataagttagaggtcaga gtctaagttaatggcaagagttggaacagagccctaactagctgcctggggttcactgctagctcttctcttccccaggtag aggcaggaggggtggagtgaagaaggaaaggtggtatgtggtatgctagttccagtgctgagactctcccttggatttcc agcttctagggagtgtttgcccctttgagctttcgaggtcatggccacacacattcaagcacaaaggcgcgtccccctctgc gcccttgtccaagaggaggaggcggacgcgcttgcgtgcgcattcagtataaataagtcccaagcggcggccactgggc AGAACGAGCTACAGGAGCCTCAGGCCATGGCGGGTGAGGACCACCCGTGGCAGGGCAG CATCCTCTACAATCTACTGATGAGCGCGAAGCAGAAGCACGCGTCTCAGGAAGAGCG AGAGGTGCGCTTGGGGGCTCAGTGCTGGGGTTGCGCCTGCGGTGCTCAGCCCGTCCT GGGTGGGGAGAGACTGTCCGGCGGGCAAGCCAGGTCCCTCTTGTACCGCTGCTGCTT TTGTGGGGAGAATCACCCGCGCCAGGGTGGCATCCTCTACTCTATGCTCACCAACGC CAGGCAGCCAAGCGTGGCGACCCAGGCGCCGAGGGCACGATTCGGAGCACCTTGCTG GGGCTGCGCCTGCGGCAGCGCAGAGCCCCTGGTGGGCAGAGAGGGGCTGCCGGCTGG CCAGGCCCCCTCGCTCCTGTACCGCTGCTGCTTCTGCGGAGAAGAGCACCCGAGGCAG GGCAGCATCTTATACAGCTTGCTCACTAGCGCTCAGCAAACGCACGTGTCTCGGGAA GCACCCGAGGCACATCGCAGAGGCGAGTGGTGGCAGCTGTCCTACTGTACCCAGAGT GTGGGTGGCCCAGAGGGGCTGCAGAGCACACAGGCCATGGCGTTCCTGTACCGCAGC TATGTGTGCGGTGAAGAGCAGCCCCAGCAGATCAGCGTTGCCTCTGGCACGCCCGTG AGCGCAGACCAAACACCAGCGACCCCGCAAGAGCAGCCGAGGGCTCCCTGGTGGGAC GCCTCACCTGGTGTGCAGCGTCTGATCACACTCAAGGATCCACAGGTGGTGTGCGAG GCAGCGTCCGCTGGCCTGTTGAAGACCCTGCGCTTTGTCAAGTACTTGCCCTGCTTCC AGATCCTGCCCCTAGATCAGCAGCTGGTGCTGGTGCGGAGCTGTTGGGCGCCCCTAC TCATGCTTGAGTTGGCCCAAGATCACCTGCACTTCGAGATGATGGAGATCCCGGAGA CCAACACGACGCAGGAAATGCTTACCACCAGGCGGCAGGAGACCGAAGGTCCAGAGC CTGCAGAGCCCCAGGCCACAGAGCAGCCACAGATGGTGTCCGCGGAGGCTGGGCACT TGCTCCCAGCTGCTGCGGTCCAGGCCATCAAGAGTTTCTTTTTCAAGTGCTGGAGTC TGAACATTGACACCAAAGAGTATGCCTATCTGAAAGGGACCGTGCTCTTTAACCCAG gtaagcattgtcaaccttgtgcactgtctcttcaggtcagaaaagcaccactacagacatttatgagtttttagtaggggttt tggagcccacttgactgtgactgactctgcaaatctgctgcacacatcaggaataccctgtcaagtggtcaaatgggtgag cttctgccagaaacttggcactggattggtggtgatagtgtgtgtgtgtggggggggggggggcaggggttggggggag ggtggggaacgaaccagtaagctttgtacctggctctctattatctgctgctacagaagtttctgtcttcataggacctggct aactcttc
tattaagtgtgccagtgtttgtgcacactttagtgtgtccagtgtatgtgcacacatcctttcatccttagaagtgttgcttctg aaaacttagaacttatttcagtccattattttaggccccagaaaacccttttaatcaagaagctagggttctttttaatcggg atgggactaaaaaaaatgagtttggcctaaaccataaagatcctgtggtgagctgttttaaaataaagttttctcctttcag
ACCTGCCTGGCCTGCAGTGCGTGAAATACATTGAGGGTCTTCAGTGGAGAACCCAGC AGATCCTTACTGAGCACATCCGGATGATGCAGAGAGAGTACCAGATCAGATCCGCTG AACTGAACAGTGCCCTTTTCCTGCTGAGATTCATCAATAGCGATGTCGTCACTGAACT CTTTTTCAGGCCCATCATTGGTGCAGTCAGCATGGATGATATGATGCTGGAGATGCT CTGTGCAAAGCTGTGAAGGCATATGTCCACTCAAGTGCATTTTACTATAGATGGAG AAAGCGGTCGTAGCTGTAGGCAGAAGAGTGCTAAAATTTGTGAAACCAAACTTTCT TGTATTTTTACATGCATAGTATATTTGTATTCAATTGAAGAAATACTTTAGTTACA ATGTAAAAATCCCTCTGCTCCATACTGGCTTCTTGTGAAGGAAAGCATTTGCAAACA AATCACTATTTCTGTATATCTCTAAGAGTGTGGTACTAGGCTAACAAGCTAATTTC ATAAAAATAACATCTCTTTCCATTAACCCCGCCAAATAAAATTTATAATATTAACTT TTAATAAAATTTAAGGTACTAACCGTTaaacggactggagagttttcttggggtttacagcttcaaata ctttcaaatctagctaaaataactgaagatacaatcgtgagtaacttcatggaatttaatgctacagtatgtcactggttaa aaaaaaaaaaaggttattttgcctggcttcactgcttccattaacagtataaaagattgtcttcattcctgcctggaactcaa
Results
MCF7 breast cancer cells were successfully treated to express DAX-1, as verified by both standard PCR run through an agarose gel (Figure 2-7A) and
quantitative PCR analysis (Figure 2-7B). Knock-in expression was nearly four times the relative untreated expression when normalized with GAPDH using delta Cq calculations, and was considered to be statistically significant with a p-value less then 0.001. These samples were used for further analysis in Chapter 3.
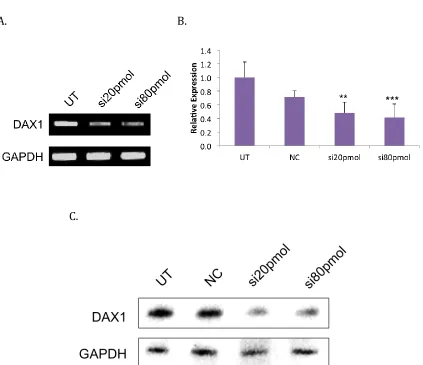
MCF10A cells experienced a reduction in DAX-1 mRNA expression with siRNA treatment using the three transcripts listed in Table 2-1, as verified by standard PCR in agarose gel (Figure 2-8A) and quantitative PCR (Figure 2-8B). Relative expression was reduced to negligible amounts through delta Cq
calculations and was statistically significant with a p-value of less than 0.005. These samples were used for further analysis in Chapter 3.
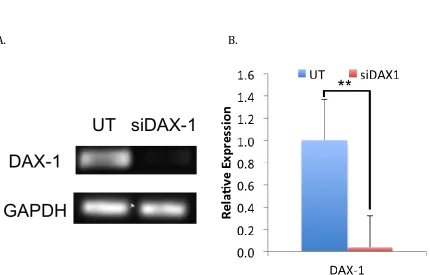
having a p-value less than 0.001. These samples were used for further analysis in Chapter 4.
Development of a pX459 plasmid complete with an inserted guide for Dax-1 CRISPR-Cas9 knock-down in mESC is shown in Figure 2-10. Based on the design of the insertion site (Figure 2-4B), successful insertion of a guide sequence results in the loss of the BbsI restriction enzyme target site. Comparison of a complete plasmid with insertion and one with no insertion is shown in Figure 2-10A. Loss of the BbsI site results in a single linear product when digested with both BbsI and AgeI. However, lack of an insertion preserves the BbsI site resulting in two fragments, including a 1,000 base pair fragment (detectable in Figure 2-10A).
A. B.
Figure 2-7. Introduction of DAX-1 expression in MCF7 cells by transient transfection with pCDNA DAX-1. A. Agarose gel electrophoresis of PCR samples comparing DAX-1 expression in untreated and transfected samples (GAPDH is shown as a positive control). B. qPCR results comparing the relative expression of DAX-1 mRNA in untreated and transfected cells. Error bars on qPCR results
A. B.
A. B.
C.
A.
B.
Figure 2-10. Dax-1 specific CRISPR-Cas9 construct design. A. Screen cloned samples for proper insertion through a double digest with restriction enzymes AgeI and BbsI. The guide insertion site has BbsI target sites, so without an insert, a double digest will show a 1kb fragment. With guide sequence insertion, loss of the BbsI target site will lead to a single cut at the AgeI site and result in a linear product around 9kb length. B. Sequencing results verifying guide sequence insertion
A.
B.
C.
Discussion
The successful treatment of the human cell lines MCF7, with the introduction of DAX-1 expression through a pcDNA3.1 vector, and MCF10A , with the knock-down of DAX-1 expression through siRNA, was carried out to see the effect of mirrored DAX-1 modification in the same cellular background yet with different endogenous DAX-1 expression levels. This system allows for subsequent analysis of downstream targets within specific pathways in Chapter 3.
The treatment of E14 mESC with both siRNA and CRISPR-Cas9 allowed for two different methods with the same outcome – knock-down expression of endogenous Dax-1. Unlike the human mammary epithelial cell model, there is no variation in wild-type stem cells and Dax-1 is endogenously expressed in relatively high amounts. Each method uses different mechanisms for knocking down gene
Chapter 3
DAX-1 Mediates Expression of Apoptosis-Inducing Genes in Human Breast
Cancer
Introduction
Amongst the various human diseases, cancer poses a great threat to the human population. As the life expectancy rises, so does the risk of cells functioning
abnormally within the human body. The umbrella term of cancer mistakenly simplifies the complexity of the disease as a whole, which affects nearly every type of cell. It is expected that there will be about 1.5 million new diagnosed cases in the United States in 2015. Estimates for 2015 in the United States alone put breast cancer as the second leading cause of cancer death for women, with about 40,000 expected cancer deaths (Figure 3-1). Research of specific types of cancer is made possible with cell culturing of commercially available cell lines, such as MCF7 [41], that are well characterized and give great insight into the mechanisms and changes that contribute to onset and persistence of cancer.
unpublished), indicating that cell death is another cause of the decline of survival as well. If DAX-1 was to be involved as a transcription factor with this cellular process, it is likely that it contributes to apoptosis, or programmed cell death.
Results observed in MCF7 cells prompted further investigation in an opposing model system with DAX-1 highly and endogenously expressed. The lung
Apoptosis is an efficient way for an organism to maintain tissue homeostasis and to clear old or aberrant cells. [44]. Evading apoptosis is one of the chief hallmarks of cancer [45]. Altering major apoptotic pathways gives cancerous cells an advantage over natural and artificial stressors that typically activate a cell death cascade. The cellular pathways that lead to cell death can be described as either extrinsic or intrinsic. Extrinsic programming is caused by extracellular death ligands interactions with transmembrane protein receptors. Intrinsic programming is triggered by intracellular signals, such as elevated oncogene signaling and DNA damage, or upstream activity from extrinsic signaling pathways. While these
pathways differ in their different specific molecular targets, they converge and lead to morphological changes within the cell as it begins to die. Cells going through early apoptosis can be identified through light microscopy by their characteristic
shrinkage and visible chromatin condensation. When going through the later stages of apoptosis, the plasma membrane separates from the cytoskeleton causing the cell to start blebbing, organelles get fragmented into apoptotic bodies, and the dead cell is then consumed by macrophages through phagocytosis [44].
are initiators while caspases 3, 6, and 7 are executioners [48]. Once activated, these enzymes cleave proteins at aspartic acid residues, with each one specific depending on the neighboring amino acids [49] [50]. The inactivation and degradation of key proteins leads to the breakdown of internal components, and eventual breakdown of DNA through CAD, or caspase-activated DNase [51].
The results from the knock-down of DAX-1 saw a change in expression of genes that fell within two major apoptotic, caspase-dependent pathways. The first
category fell under the TNFα pathway, an extrinsic pathway that influences both cell proliferation and apoptosis. The TNFα ligand interacts with two receptors: TNFR-1, also known as p55, and TNFR-2, also known as p75. TNFR-1 mediates most
The second general category of genes that saw a change in expression in
response to reduced DAX-1 was the BCL-2 family. This is a major intrinsic pathway, illustrated in Figure 3-4, that is strongly linked to programmed cell death, and is a major target for therapy due to its sole involvement with apoptosis alone [54]. There are three categories of proteins based on function and structure. Four distinct domains within the BCL-2 family, ranging from BH1 to 4, relate to their interactions with one another [55]. The first, most upstream members of the BCL-2 family are the BH3-only domain proteins. These proteins, such as BNIP3 and BID, are only able to interact with isoforms of BCL-2 [56]. By inhibiting anti-apoptotic members of BCL-2 and activating pro-apoptotic members, BH3-only proteins cause
mitochondrial outer membrane permeabilization (MOMP), which releases internal proteins of the mitochondria and leads to the caspase cascade described earlier [57].
Figure 3-4. BCL-2 family apoptosis pathway. BH3-only proteins like BNIP3 and BID are able to activate BAX and BAK proteins to cause membrane
Table 3-1. Anti-apoptotic candidate target genes.
Gene Name Function
TNFα Encodes a protein that is a death receptor ligand; when it binds to TNFR2, activates both cell proliferation and apoptotic pathways
downstream [52]
TRADD Encodes a death domain containing protein that suppresses TRAF2 recruitment of inhibitor-of-apoptosis proteins (IAPs) [58], but also has anti-apoptotic function because of influence on NFκB
[59]
TRAF1 Encodes a protein that associates with TRAF2 to form a complex needed to activate NFκB and activate IAPs [58]
BCL-XL Large isoform of BCL-2, encodes a transmembrane protein that is present in the mitochondria, prevents the release of cytochrome c
[56]
Table 3-2. Pro-apoptotic candidate target genes.
Gene Name Function
BCL-XS The shorter isoform of BCL-2 that acts as an apoptotic activator by allowing for the release of cytochrome c [56]
BCL2-L1 One of the smaller isoforms of BCL-2 that allows for the release of cytochrome c [56]
BAX A BH1 through 3 domain containing protein that associated with the membrane to release cytochrome c [56]
BAD A BH3-only protein that forms a heterodimer with anti-apoptotic proteins to prevent the inhibition of apoptosis [56]
TRAF3 Activates the immune response and contributes to the lymphotoxin-beta receptor signaling complex, which induces
Methodology
While the changes in the gene expression in the mentioned pathways were significant enough to suggest some influence, some sort of measurement of the actual occurrence of apoptosis with DAX-1 presence is required to confidently associate DAX-1 with apoptosis. Annexin V and propidium iodide staining can be used to quantify cells undergoing apoptosis through cell flow cytometry. During early apoptosis, the membrane protein phosphatidylserine is flipped to the exterior of the cell, which allows for Annexin V to bind and tag a cell. As a cell progresses through the breakdown of internal components, DNA is more readily accessible and stained by propidium iodide (Figure 3-5A). Cell flow cytometry allows for the comparison of the degree of staining with these two reagents to identify and characterize cells within a population sample (Figure 3-5B).
A.
B.
Materials and Methods
RNA and cDNA extraction
MCF7 human breast cancer cells and MCF10A human normal breast cells, untreated and treated as stated in Chapter 2, were lysed and messenger RNA was collected using QIAGEN RNeasy Kit according to the manufacturer’s protocol. Nucleic acid concentrations were measured using the GE Nanovue Plus Spectrophotometer. Complementary DNA (cDNA) was then synthesized from 1 μg of collected mRNA using various kits (High Capacity cDNA Reverse Transcription Kit from Applied Biosystems; M-MuLV Reverse Transcriptase from New England Biolabs; QuantiTect Reverse Transcription Kit from QIAGEN) according to the corresponding protocol.
Small Molecule Inhibitor
BADGE (Bisphenol A diglycidyl ether; 2,2'-[(1-Methylethylidene)bis(4,1-phenyleneoxymethylene)]bis-oxirane), a TNFα inhibitor that is known to induce apoptosis in tumor cells, was prepared to a working concentration of 1 mM in 100% ethanol from the stock (Santa Cruz Biotech, cat no.
sc-202487). 100 μL was used in each well of a twelve-well plate. Cells were treated for 48 hours before collection and flow cytometry analysis.
Flow Cytometry
MCF7 cells were plated in twelve-well dishes and either untreated,
alone, or BADGE and pcDNA-DAX-1. After collection, each treatment of cells was left unstained, stained with Annexin V alone, stained with PI alone, or stained with the combination of Annexin V and PI. Cells were quantified using the BD Accuri C6 Cytometer and its provided computer program, with a sample size of 10,000 cells per reading.
Polymerase Chain Reaction (PCR)
Annealing temperatures were optimized using Promega GoTaq Green Master Mix. Primers listed in Table 3-5 and any subsequent primers used were all ordered from Integrated DNA Technologies. Conditions in Table 3-3 were used, with optimized annealing temperatures for specific primer pairs used for step 3. Upon completion, samples were removed from the 4°C hold and stored until further analysis.
Table 3-3. Thermocycler conditions and steps for standard PCR.
Step Temperature Time
1 95°C 5 minutes
2 95°C 30 seconds
3 53-60°C 30 seconds
4 72°C 30 seconds
5 Repeat steps 2 to 4 x thirty times
Real-Time PCR (qPCR)
Quantitative PCR analysis was performed on untreated and treated cDNA collected from MCF7 and MCF10A cells to analyze the relative gene
expressions of target genes, normalized with GAPDH expression. SYBR green master mixes (BioRad and QIAGEN) and the respective primer pairs for the genes listed in Table 3-5 were used for apoptotic gene analysis. Primers with a source as “construct” were designed using NCBI Primer-BLAST using the available cDNA sequences online. Each sample was prepared using 10 μL of SYBR green master mix, 0.25 μL of the forward primer, 0.25 μL of the reverse primer, 7.5 μL nuclease free water, and 2 μL of cDNA. All samples were run in triplicate for 40 cycles using the two-step amplification program, outlined in Table 3-4, with the BioRad CFX96 Touch Real-Time PCR Detection System. Results were analyzed using the BioRad CFX Manager™ software and Microsoft Excel.
Table 3-4. Thermocycler conditions and steps in the two-step amplification
program for qPCR. Fluorescent dye detection occurred at step 3.
Step Temperature Time
1 95°C 5 minutes
2 95°C 30 seconds
3 55-60°C 15 seconds
Statistical Anaylsis
Data from the qPCR analysis are presented with the mean + standard
deviation of triplicate experiments. Statistical significance is calculated in the same manner described in Chapter 2.
Table 3-5. Primers used for apoptosis qPCR analysis.
Gene FWD REV Source
TNFα GGAGAAGGGTGACCGACTCA CTGCCCAGACTCGGCAA Construct TRAF2 TGGCTGGCCGCATACC TGTAGCCGTACCTGCTGGTG
TA Construct
TNFR1 TACATTGCAGCCTCTGCCTC AGAGCTTGGACTTCCACCGT Construct TNFR2 ACATCAGACGTGGTGGTGCA
A CCAACTGGAAGAGCCAAGTC [59] TRADD AGCTCATAGTGAACCGGCCA TCCCTCAGTGCTCGACAGC Construct BCL-XS CTGCACCTGACGCCCTTCAC
C CACATGACCCCACCGAACTCAAAGA Construct BCL-XL GATCCCCATGGCAGCAGTAA
AGCAAG CCCCATCCCGGAAGAGTTCATTCACT Construct BAX ATGGAGCTGCAGAGGATGAT
T TGAAGTTGCCATCAGCAAACA Construct BCL2-L10 GCCTTCATTTATCTCTGGAC
ACG GAAGGTGCTTTCCCTCAGTTCTT Construct BCL2A1 CCCGGATGTGGATACCTATA
Western Blot
Table 3-6. Monoclonal Antibodies used for Western Blotting.
Protein Target Host Organism Cat. No, Company
Beta-Actin Mouse sc-82278, Santa Cruz GAPDH Rabbit 3683, Cell Signaling
DAX-1 Mouse 39983, ActiveMotif BCL-2 (XL isoform) Rabbit GTX127958, GeneTex
Chromatin Immunoprecipitation (ChIP)
A.
B.
Table 3-7. Antibodies used for ChIP assay.
Protein Target Host Organism Cat. No, Company
Histone H3 Rabbit (polyclonal) 1791, AbCam DAX-1 Mouse (monoclonal) 39983, ActiveMotif
ERα Rabbit (polyclonal) GTX100634, GeneTex
Table 3-8. Primer sets corresponding to promoter regions of BCL-2 and BAX.
Gene Region FWD REV
BCL-2 Region 3 CCCCTCGTCCAAGAATGCAA CATCTCCCGCATCCCACTC Region 4 ACGCCCCATCCAGCCG CCCGCGCGGTGAAGG
Results
Introduction of DAX-1 increases number of apoptotic cells in population
A.
Changes in candidate genes within MCF10A DAX-1 knock-down cells
A. B.
E. F.
G.
A. B.
E.
Changes in candidate genes within MCF7 pcDNA-DAX-1 cells
The cDNA synthesized from collected mRNA of MCF7 cells, treated as described in Chapter 2 to express DAX-1, was analyzed by qPCR to compare gene expression changes of specific candidate genes. The gene expression of
A. B.
C. D.
A. B.
E. F.
Selected genes further analyzed for expression changes reflected in protein expression
Table 3-9. Comparison of candidate genes in MCF10A and MCF7 cells. Relative increase in expression is indicated by an up arrow (), a decrease is indicated by a down arrow (), and degree of significance is noted in parentheses. Significance is either noted with a number of asterisks or labeled (n.s.) for not significant. A single asterisk (*) represents samples that were p<0.05, a double asterisk (**) represents samples that were p<0.005, and a triple asterisk (***) represents samples that were
p<0.001. Not all treated samples were tested for each candidate genes.
Type Gene MCF10A
(siDAX-1)
MCF7
(pcDNA-DAX-1)
Anti-apoptotic
BCL-L2 (*) (n.s.) BCL-XL (**) (***) BCL2-A1 (***)
TNFα (*)
TRAF1 (**) (***) BCL-L10 (***)
TRADD (*) (**)
Pro-apoptotic
BAX (*) (**) BAD (**) (n.s.) BCL-XS (***) (**) BCL-L1 (***) (n.s.)
TRAF3 (***) (n.s.)
ChIP analysis of BCL-2 and BAX promoter regions
The promoter regions of BCL-2 and BAX were broken up into five regions, with each region having a length of about 200-300 base pairs (Figure 3-7). Among the regions tested, the presence of DAX-1 was detected in region 4 for BCL-2, that corresponds to a section that spans a range of 442 to 225 base pairs upstream of the BCL-2 transcription start site. This is shown in both a detectable band in agarose gel electrophoresis of PCR samples using primers for region 4 (Figure 3-14A) and a significant qPCR value when compared to both negative and positive controls (Figure 3-14B). Results from region 3 were used in comparison as a section with no detectable DAX-1 binding. Additionally, ERα is known to bind to the BCL2 promoter based on a response to estradiol [60], and was similarly detected with significant qPCR values.
A.
B.
Discussion
After verifying the success of DAX-1 expression modification in Chapter 2, the influence of DAX-1 on apoptosis was tested through cell flow cytometry of cells stained with Annexin V and PI (Figure 3-8). The increase in the number of apoptotic cells in the entire population was comparable to a known apoptotic inducer BADGE, confirming the association of DAX-1 with programmed cell death overall. There was no additive effect of the combination of DAX-1 knock-in with BADGE treatment. The treatment with both DAX-1 and BADGE appears to affect the same pathway, rather than through different and alternate pathways. The BADGE reagent affects
apoptosis through TNFα very far upstream, therefore the DAX-1 target(s) would likely lie downstream of the affected members of the pathway.
The MCF7 and MCF10A cells, treated as described in Chapter 2, served as the opposing DAX-1 expression models. Genes that clearly showed mirrored expression changes with the opposing models would be selected for further analysis, as these changes strongly suggest a direct interaction as caused by varied DAX-1 expression, rather than by the changes in the balance of apoptotic pathways. Among the
some more recent research into post-transcriptional regulation [63]. For these reasons, BCL-2 (interchangeably referred to as BCL-XL because of the large, anti-apoptotic isoform) and BAX were selected for further analysis. The changes in gene expression were reflected in the changes of the protein level (Figure 3-13). This not only confirms that DAX-1 affects the protein level at the gene level, but also
reaffirms the idea that with DAX-1 apoptosis is promoted, while removing DAX-1 shifts away from an apoptotic profile.
Chapter 4
Dax-1 Knock-down Effects on Pluripotent Gene Network in Mouse Embryonic
Stem Cells
Introduction
Stem cells are characterized by two defining properties: self-renewal and pluripotency [65]. Self-renewal is the continued replication of a cell lineage,
allowing for preservation of population of cells, while pluripotency is the capacity of a cell to differentiate into a variety of cell types, more notably into all three germ layers: the ectoderm, mesoderm, or endoderm [66]. There are distinct pluripotent stem cell types, distinguished by when the cells are harvested from an embryo. As illustrated in figure 4-1, embryonic stem cells (ESCs) are harvested from the inner cell mass (ICM) of a blastocyst after embryo day 5, while the outer cells can be cultured into trophoblast stem cell (TSC) lines. As the blastocyst matures and the ICM begins to divide into distinct layers by the fifth and sixth embryonic day, embryonal carcinoma cells (ECCs) can be harvested from the embryo [67].
state [70]. These cell lines can be implanted in a developing embryo and still differentiate into all three types of germ cells, allowing for genetic modification of entire organisms.
Established ES cell lines are maintained by complex protein networks [71, 72], with distinct key transcription factors such as Oct3/4 [73], Sox2 [74], and Nanog [75] that strongly drive the maintenance of pluripotency, and additional factors such as Stat3 [76] and c-Myc [77] that contribute to self-renewal. These connections were made through various knock-down studies, both of individual and a combination of candidate factors [78, 79]. Through these studies, no one single gene was the sole factor for maintaining the pluripotent state. Likewise, since the maintenance of a pluripotent state has a number of factors centered in the complex interactions, it was found that reversing differentiated adult mouse fibroblasts needed a combination of some of these key factors (OCT3/4, Sox2, c-Myc, and Klf4) to return stem cell-like state [80]. Untangling the network of transcription factors that keeps pluripotency in check therefore opens up a range of therapeutic
possibilities in the medical world.
When Dax-1 was knocked down in mouse stem cells, it was found that the loss of Dax-1 alone was not sufficient to change the phenotype of the population of cells, just like the other key factors. However, there were interactions with many key pluripotency genes that brought Dax-1 into the spotlight as an important
Target Genes
Research carried out previously in the Tzagarakis-Foster lab identified a number of notable genes that Dax-1 appears to interact with, based on changes in gene expression between wild-type mESCs and Dax-1 knocked-down mESCs [82]. Candidate genes were selected based on observations of a significant fold change in expression through tests in a pluripotency PCR array. The known roles and
Table 4-1. Dax-1 candidate target genes in mESC and their role in mediating pluripotency and differentiation.
Target Gene Description
Nanog Key player in maintenance of pluripotency and self-renewal [83] Pou5f1;
OCT3/4 Key player in maintenance of pluripotency and self-renewal [73, 84] GATA6 Drives differentiation and organogenesis [85]
SOX2 protein SOXB1. Key play Key player in maintenance of pluripotency Known to interact with Oct3/4; together with SOX3, encodes the and self-renewal [86]
SOX9 Known to interact with DAX1 in male sexual development through the expression of SRY from the Y chromosome [87] SOX17 Drives differentiation and cell fate determination [86]
T contributes to the formation and organization of the mesoderm Brachyury is part of the family of T-box transcription factors; layer during embryogenesis; also refered to as T-Brachyury [88] Lefty2 growth, cell differentiation, apoptosis, homeostasis; required for the Part of the TGFbeta family, which as a whole is involved in cell
left-right asymmetry determination of organogenesis [89]
AMH
Anti-Mullerian hormone, also known as MIS (Mullerian inhibiting substance), is part of the TGFbeta family as well. It is known primarily for its role in male sexual development through inhibition
Materials and Methods
RNA and cDNA extraction
mESC were treated using siRNA and CRISPR experiments as described in Chapter 2. The mRNA of these cells were extracted and isolated as described in Chapter 3.
Target Genes
Table 4-2. Pluripotency candidate gene primers.
Gene FWD REV Source
Dax-1 TCCTGTACCGCAG
CTATGTG TGCAAGTGCAGGTGATCTTG [82, 91] GAPDH (1) ACAGCCGCATCTT
CTTGTGCA GGCCTTGACTGTGCCGTTGAA [82] GAPDH (2) CCATCACCATCTT
CCAGGAGCG AGAGATGATGACCCTTTTGGC Construct Nanog TTCTTGCTTACAA
GGGTCTGC AGAGGAAGGGCGAGGAGA [91] GATA6 ATGCTGTCCGGCC
TGCCCTA GTTCACGCACTCGCGGCTCT [82] T-Brachyury CTGCGCTTCAAGG
AGCTAAC CCAGGCCTGACACATTTACC [81] Oct3/4 CTCCCGAGGAGTC
CCAGGACAT GATGGTGGTCTGGCTGAACACCT [81] SOX2 ACAAGAGAATTGG
GAGGGGT AAAGCGTTAATTTGGATGGG mouseprimerdepot SOX9 AGGAAGCTGGCAG
ACCAGTA TCCACGAAGGGTCTCTTCTC mouseprimerdepot SOX17 TGGAACCTCCAGT
AAGCCAG TCAGATGTCTGGAGGTGCTG mouseprimerdepot AMH GGGAGACTGGAGA
ACAGCAG GGTGGAGGCTCTTGGAACTT mouseprimerdepot Lefty2 CATGAAGTCCCTG
TGGCTTT
TGCAGTAGACTGCTCA GGACC
Polymerase Chain Reaction (PCR)
Annealing temperatures were optimized using GoTaq Green Master Mix (Promega), Taq 2X Master Mix (New England Biolabs), and FailSafe PCR System (Epicentre) kits. Reactions were run with the same protocol listed in Table 3-3.
Real-Time PCR (qPCR) and Statistical Analysis
Results
Gene expression changes with siRNA Dax-1 knock-down
After treating the mouse embryonic stem cells with siRNA transcripts in order to modify high Dax-1 expression, as described in Chapter 2, collected cDNA was used for qPCR analysis of candidate target pluripotency genes (Figure 4-2). Among the genes tested, Nanog and lefty2 saw a significant increase in relative expression after siDax-1 treatment. Expression of the genes SOX2, SOX17, GATA6, and T-Brachyury saw a significant decrease (Figure 4-2 B, C, F, and G), while OCT3/4 and SOX9 (Figure 4-2 H and I) saw a non-significant decrease in expression. The expression of AMH (Figure 4-2D) did not change. These changes are also
A. B.
C. D.
E. F.
I.
Gene expression changes with CRISPR-Cas9 treatment
Following the CRISPR-Cas9 treatment described in Chapter 2, stable cells that were treated with CRISPR guide 3 that targeted an early section of exon 1 and showed Dax-1 knockout were harvested and used for analysis of the candidate genes (Figure 4-3). Nanog (A), Lefty2 (E), and T-Brachyury (G) saw a significant increase in expression with the disruption of Dax-1 expression. SOX2 (B), SOX17 (C), GATA6 (F), OCT3/4 (H), and SOX9 (I) saw significant decreases in expression.
A. B.
C. D.
E. F.
G. H.
I.
Table 4-3. Comparison of siRNA and CRISPR Dax-1 candidate gene results.
Relative increase in expression is indicated by an up arrow (), a decrease is
indicated by a down arrow (), no change indicated by an x-symbol (), and degree of significance is noted in parentheses. Significance is either noted with a number of asterisks or labeled (n.s.) for not significant. A single asterisk (*) represents samples that were p<0.05, a double asterisk (**) represents samples that were p<0.005, and a triple asterisk (***) represents samples that were p<0.001.
Gene siRNA CRISPR-Cas9
Nanog (**) (***) SOX2 (***) (***) SOX17 (***) (***) AMH (n.s.) (n.s.) Lefty2 (***) (***) GATA6 (***) (***) T-Brachyury (***) (***) OCT3/4 (n.s.) (*)
Discussion
Using the mESC samples that were treated as outlined in Chapter 2, selected candidate genes were examined for changes in gene expression. In order to further validate the expression changes, two different methods were used to knock-down Dax-1 expression. The comparison using the cDNA of both methods to observed gene expression changes are shown in Table 4-3.
Overall, both methods were successfully able to knock-down Dax-1
expression, both transiently through siRNA and permanently through CRISPR-Cas9. It is very clear that Dax-1 is not a master regulator, since expression of key markers such as Nanog surprisingly increased, while others such as OCT3/4 experienced only a slight decrease in expression. However, changes in particular genes involved with specific cell fates suggest that Dax-1 is not a key regulator because it appears to only be involved with certain pathways towards differentiation. For example, the knockdown of Dax-1 appears to have strong effect on the expression of Lefty2, a gene involved in proper asymmetric development of cells that differentiate to be part of the mesoderm [89]. Another gene that was especially affected with the long-term removal of Dax-1 was T-Brachyury, which is required for mesoderm formation [92].
The increase in expression in these genes involved with mesoderm
Chapter 5
Functional enrichment analysis of Dax-1 ChIP-seq high-throughput data
Introduction
As described in Chapter 3, chromatin immunoprecipitation assays are often employed to investigate whether a protein of interest is present in complex to specific promoter regions of select target genes. The samples resulting from X-ChIP are typically used for analysis of a small number of regulatory regions, often with primers flanking a region designated by the user. On a slightly larger scale, ChIP-chip allows one to analyze the resulting DNA fragments on a ChIP-chip array with a pre-selected set of primers for known regulatory regions. When scaled up even more and paired with massive parallel sequencing, conventional ChIP becomes ChIP-seq, and allows for genome wide functional analysis. Using this final method, binding sites of the protein of interest are sequenced and are associated with genes from numerous gene ontology databases using computer annotation tools. The wealth of these data is greatly untapped, and to repeat experiments when there is information available would prove to be wasteful and costly.
A well-known repository for data sets from published papers is the National Center for Biotechnology Information’s Gene Expression Omnibus (GEO), online at
http://www.ncbi.nlm.nih.gov/geo/, where array and sequenced based data are collected and can be searched for with keywords or an assigned accession number. New resources such as NURSA (Nuclear Receptor Signaling Atlas), online at
information pertaining to specific nuclear hormone receptors, with raw information organized by target rather than a massive repository to comb through.
In relation to Dax-1, a search through GEO yielded both chip and ChIP-seq experiment results in mESC, the latter of which was obtained for further analysis [93]. The outcome of this analysis can be used not just to validate earlier studies in pluripotency, which were limited to a small set of genes in a PCR array, but also allows for new characterization of Dax-1 in mouse embryonic stem cells. The raw ChIP-seq data and other types of sequence data can be mapped onto the mouse genome through the use of computer annotation tools. These tools associate given sequences (also referred henceforth as peaks) where the protein of interest was bound to the regulatory regions of genes and calculate how accurate the enrichment of a set of genomic regions is. There are numerous gene annotation tools that use different types of statistical methods, genome databases, and gene ontology databases to map provided sequence data.
Statistical Analysis
The hypergeometric method is a standard gene enrichment test used by annotation tools such as DAVID and GO Term Finder. The formula, as shown in Figure 5-1A, tests if a gene with a number of peaks in an associated region is
enriched with annotations out of a full set of genes in a genome. The values from the formula are as follows: N for the number of genes in the genome, n for the number of genes in a test gene set, Kπ for the number of genes in the genome with the
annotation π, and kπ for the number of genes in a test gene set with annotation π.
The p-value calculated by this method, using the formula in Figure 5-1A, is the probability of choosing kπ or more genes with annotation π when n genes are
randomly selected from the genome. There is a heavy bias in this method to only associate peaks with genes if it falls in a proximal region, so many distal association are missed.
The binomial method is another means of statistical analysis. Genes are assigned various regulatory region size, and the p value calculated in the formula in Figure 5-1B accounts for the probability of given peaks to fall within the range of numerous regulatory regions. This can provide novel gene associations, but this bias towards distal binding peaks can lead to false links.
ideal p-value among results. These corrected values account for false reads from a single method and give a more accurate ranking of the strength of gene association.
A. B.
C.
Figure 5-1. Statistical analysis of ChIP-seq data using the GREAT online annotation software. This software utilizes the formula of two tests, A.