University of South Carolina
Scholar Commons
Theses and Dissertations
2017
The Relation between Quantitative EEG
Coherence and Self-Report ADHD Behavior Scale
Responses
Tayllor Vetter
University of South Carolina
Follow this and additional works at:https://scholarcommons.sc.edu/etd
Part of theSchool Psychology Commons
This Open Access Thesis is brought to you by Scholar Commons. It has been accepted for inclusion in Theses and Dissertations by an authorized administrator of Scholar Commons. For more information, please [email protected].
Recommended Citation
THE RELATION BETWEEN QUANTITATIVE EEGCOHERENCE AND SELF-REPORT ADHD
BEHAVIOR SCALE RESPONSES
by Tayllor Vetter Bachelor of Science Centre College, 2013
Submitted in Partial Fulfillment of the Requirements For the Degree of Master of Arts in
School Psychology College of Arts and Sciences University of South Carolina
2017 Accepted by:
Scott Decker, Director of Thesis Kate Flory, Reader
ABSTRACT
TABLE OF CONTENTS
ABSTRACT ... iii
LIST OF ABBREVIATIONS ...v
CHAPTER 1:INTRODUCTION ...1
CHAPTER 2:METHOD ...24
CHAPTER 3:RESULTS ...34
CHAPTER 4:DISCUSSION ...43
LIST OF ABBREVIATIONS
CHAPTER1 INTRODUCTION
ADHD is a common neurodevelopmental disorder among children and adults that is well understood from a behavioral perspective (Centers for Disease Control and
Determining the relation between behavior rating scale scores for ADHD and brainwave activity has never been investigated before. Therefore, the purpose of the present study was to determine whether a relation exists between EEG coherence and CSS scores of inattentiveness and hyperactivity in male and female college students.
ADHD in College Students
ADHD is a neurodevelopmental disorder categorized by a persistent pattern of hyperactivity-impulsivity and/or inattention that negatively impacts social and
academic/occupational activities in both children and adults, including those within the young adult age range who attend college (American Psychiatric Association, 2013; CDC, 2005). Impairments related to ADHD symptoms often exist across the lifespan. Specifically, several studies have found that ADHD in college students is associated with increased risk for academic problems, lower GPA, poor academic coping skills, illicit substance use, poor interpersonal relationships, and higher psychological distress compared to students without ADHD (Weyandt & Dupaul, 2006; Dupaul et al., 2009; Upadhyaya et al., 2005; American Academy of Pediatrics, 2000; American Psychiatric Association, 2013; Johnston, Mash, Miller, & Ninowski, 2012; Resnick, 2005).
For decades, it was thought that children who were diagnosed with ADHD would develop out of their symptoms as they matured and began puberty (DuPaul, Guevremont, & Barkley, 1991; Barkley & Murphy, 2006; Weyandt & DuPaul, 2008; Green & Rabiner, 2012). By the 1990s, researchers had determined that this was inaccurate. Recent
Faraone, 1994; Biederman, Mick, & Faraone, 2000; Goldstein, 2002; Barkley, Fischer, Smallish, & Fletcher, 2002; Resnick, 2005; Green & Rabiner, 2012). According to a recent literature review, approximately 2 to 8% of college students self-report clinically significant amounts of ADHD symptoms (Dupaul, Weyandt, O’Dell, & Varejao, 2009). Even though children with ADHD are less likely than peers to achieve academic success in high school and decide to attend college, researchers estimate that about 25% of college students who receive disability services are diagnosed with ADHD. Furthermore, this percentage appears to be on the rise, specifically in college populations (Wilens et al., 2008 for review; Dupaul et al., 2009; Green & Rabiner, 2012; Advokat, Lane, & Luo, 2011). These statistics exhibit the importance of understanding ADHD within the young adult population in order to promote social and academic success within the university setting (Green & Rabiner, 2012).
of symptomology from college students, potentially resulting in inappropriate ADHD diagnosis. Furthermore, studies have indicated that while 2 to 8% of college students self-report clinically significant ADHD symptoms, it is estimated that closer to 1% of students meet criteria for ADHD when there is also a parent report of symptoms (Dupaul et al., 2009).
Research suggests that the high rate of college students self-reporting clinically significant amounts of ADHD symptoms may be influenced by the nature of the university setting. First, the high achieving environment of this setting may encourage previously unidentified students who meet ADHD diagnostic criteria to seek out a
(Glutting, Youngstrom, & Watkins, 2005; Murphy & Schacar, 2000; Katz et al., 2009). These studies’ findings reveal that, regardless of whether the adult client has ADHD symptoms, few differences exist between the amount of symptoms self-reported by adults with and without ADHD (Katz et al., 2009). While self-report behavioral scales for ADHD are valuable in that they are time-efficient and easy to administer, research suggests that self-reports of ADHD symptoms should not be the sole determining factor of ADHD diagnosis in adults.
Unlike students who are seeking ADHD assessment in college due to struggling with true attention problems, there are also college students who desire an ADHD diagnosis in order to obtain a prescription for ADHD medication (Sullivan, May, & Galbally, 2007; Green & Rabiner, 2012). First, students may malinger in order to obtain these medications for academic purposes (Green & Rabiner, 2012; Rabiner et al., 2009). College students may be motivated to malinger their ADHD symptoms with the belief that ADHD medication enhances their ability to perform academically and improve concentration and focus (Thomas et al., 2015; Dupaul et al., 2009; Rabiner et al., 2009). While there has been debate about whether ADHD medications are truly effective as long-term “cognitive enhancers”, this has not impacted the amount of individuals without ADHD whom still turn to medication to help them complete their academic tasks
(Advokat, 2009; Advokat et al., 2011).
for “fun”, and that 53% of students reported that they had known a student who had taken methylphenidate for “fun”, even though less than 2% of the student population had been prescribed this methylphenidate (2000). However, it is currently unclear whether students have obtained ADHD medication to personally use it illicitly or to sell/distribute it to other students (Dupaul et al., 2009). Furthermore, a recent meta-analysis found that the prevalence of students who have misused ADHD medication is estimated at 17% (Benson, Flory, Humphreys, & Lee, 2015). Therefore, regardless of the motivation to misuse ADHD stimulant medication, there is reason to suggest that ADHD assessments in university settings require improvement in order to potentially decrease prevalence of ADHD medication abuse.
Dimensional Approach to ADHD
In children and adults, the categorical approach to ADHD has been traditionally used to determine who meets diagnostic criteria for ADHD and who does not in order to determine who receives access to services and medication. While the categorical
approach to ADHD has its strengths in dichotomizing individuals as ADHD or not-ADHD, the debate of changing the approach to ADHD to a dimensional perspective from a purely categorical view has been present and growing in support in the literature for several decades (Balázs, & Keresztény, 2014; Marcus & Barry, 2011; Bell, 2011; Hudziak, Achenbach, Althoff, & Pine, 2007). For example, several researchers have conceptualized ADHD as one end of the spectrum of the attention and behavior inhibition ability continuum with no impairment at the opposite end (Barkley, 2014; Barkley, 1997; Levy, Hay, McStephen, Wood, & Waldman, 1997). Also, research studies examining the latent structure of ADHD have supported the dimensional structure of ADHD over the categorical structure in children, adolescents, and adults (Marcus, Norris, & Coccaro, 2012; Carragher et al., 2014). Furthermore, research has supported that viewing ADHD from a dimensional approach helps account for multiple sources of variance including gender, age, informants, and comorbidities by considering symptomology per the individual. For example, the dimensional approach helps explain why ADHD may not look the same behaviorally and neurologically in an adult woman as a 6-year old male, due to developmental and gender differences (Hudziak et al., 2007; Balázs, &
Keresztény, 2014).
both behavior rating scales and neurological assessment tools adhere to the dimensional perspective (Hudziak et al., 2007; Barkley, 2014). First, self-report behavior rating scales for ADHD are inherently structured to apply to the dimensional perspective of ADHD (Barkley, 2014; Spitzer, Davies, & Barkley, 1990). Informant and self-report behavioral rating scales and screeners that were created to measure inattention and hyperactivity, such as the Conners’ Adult ADHD Rating Scale (CAARS; Conners, Erhardt, & Sparrow, 1999) and the Current Symptoms Scales (CSS; Barkley, 1998) are dimensional measures based on DSM criteria for ADHD by viewing symptoms on a continuous scale as
opposed to categorizing individuals as having ADHD or not (Hudziak et al., 2007; Barkley, 2014; Spitzer et al., 1990).
Second, neurological studies of ADHD have also supported the dimensional perspective by showing continuous correlations between brain images and activity and ADHD symptoms across time. For example, Shaw and colleagues (2011) found that changes in the frontal cortex of the brain from imaging data are associated with decreased symptoms of inattention and hyperactivity across development in typical children.
Another study by Hoogman and colleagues (2012) found that total brain volume had a dimensional relation with adult self-report symptoms of ADHD. The current study aims to incorporate the dimensional perspective of ADHD symptomology by using
dimensional methods, including self-reports of ADHD symptoms and EEG, to provide support for viewing inattention and hyperactivity on a continuum.
Behavior Rating Scales for Adults with ADHD
symptoms in subclinical and clinical ADHD populations (Murphy & Adler, 2004). For example, Rodriguez and Simon-Dack (2013) found that five self-report scales (Current Symptoms Scale, Brown Attention Deficit Disorder Scales, Conners’ Adult ADHD Rating Scale, Attention Deficit Disorder Evaluation Scale, and the Wender Utah Rating Scale) were highly correlated with, and predicted significantly, higher self-report scores from participants who reported a previous diagnosis of ADHD. Additionally, Kooji and colleagues (2008) determined that the ADHD Rating Scale and Brown Attention-Deficit Disorder Scale (BADDS) were two self-report ADHD rating scales for adults that accurately predicted a clinical diagnosis of ADHD. Taylor and colleagues (2011) conducted a systematic review of behavior scales used for the identification of adults with ADHD in which they summarized the validity and usefulness of 14 separate scales. Of the scales included, the authors determined that the Conners’ Adult ADHD Rating Scale (CAARs) and Wender Utah Rating Scale-short version (WURS) had the most robust psychometric statistics and content validity, while other scales such as the Adult Self Report Scale, Symptom Inventory, Adult Rating Scale, Caterino Scale, and Adult Problems Questionnaire were deemed useful, but in need of inclusion in more good quality studies in order to be independently validated (see Taylor et al., 2011 for review). These studies demonstrate the utility of self-response ADHD adult rating scales in predicting ADHD symptoms.
Scale—IV predicted substantial problems related to executive functioning and externalizing behaviors associated with the symptoms, despite failing to reach the diagnostic cut-off for ADHD. In a study conducted by Overbey and colleagues (2011), they found that increased symptoms of ADHD from a behavior rating self-report measure in a subclinical population predicted greater stress levels and more difficulty maintaining romantic relationships.
Also, one item response theory (IRT) analysis study has been conducted to determine the psychometric properties of one of the self-report ADHD behavior rating scales for adults, the Current Symptoms Scale (CSS). Gomez (2011) used the graded response model, which is based on item response theory, to determine that the symptoms included in the CSS have appropriate discrimination parameters that generally
discriminated their respective latent traits of inattention, hyperactivity, and
impulsiveness. This finding indicated that the items in the CSS reliably measure the traits of inattentiveness, hyperactivity, and impulsivity. While this study gleans important information about the psychometric properties of the CSS, it is the only of its kind to evaluate a self-report ADHD behavior rating scale with the IRT method. The current study utilized the CSS to measure symptoms of inattentiveness and hyperactivity appropriately in the participants.
Neurological Approach to ADHD
While the assessment of behavioral symptoms of ADHD is required for
diagnostic criteria, it is also important to consider the neurodevelopmental aspect of the disorder in order to get a full picture of ADHD. ADHD is considered a
by atypical developments, both structurally and functionally, in the central nervous system (Ellison-Wright, Ellison Wright, & Bullmore, 2008; Kobel et al., 2010; Vaidya, 2012; Lubar, 1991). Specifically, results of neuroimaging studies have indicated that individuals with ADHD have reduced volumes of intrahemispheric and interhemispheric white matter (Hynd et al., 1991; Giedd et al., 1991; Semrud-Clikeman et al., 1994; Baumgadner et al., 1996; Filipek et al., 1997, Castellanos et al., 2002; Durston et al., 2004; Murias, Swanson, & Srinivasan, 2007), and have less gray matter, which begins in childhood and lasts into adulthood (Vaidya, 2012; Nakao, Radua, Rubia, & Mataix-Cols, 2011; Cortese et al., 2012). Several meta-analyses utilizing an array of neuroimaging techniques with magnetic resonance imaging (MRI), electroencephalography (EEG), and diffusion tensor imaging (DTI) have most consistently detected hypoactivation of
prefrontal and striatal areas (Cortese et al., 2012; Snyder & Hall, 2006; Valera, Faraone, Murray, & Seidman, 2007). Furthermore, several studies have linked this frontal
hypoactivation to impaired cognitive tasks common in ADHD, such as inattention, decision-making, and executive control (Niendam et al., 2012; Cortese et al., 2012; Bush, 2011)
these executive control areas in the frontal lobe of the brain (Arnsten, 2006; Berridge et al, 2006; Spencer, Klein, & Berridge, 2012). Because several behaviors that require executive control, such as working memory and self regulation, are often impaired in individuals with ADHD, it is not surprising that these impairments are reflected
neurologically as well (Barkley, 1997; American Psychiatric Association, 2013; Willcutt, Doyle, Nigg, Faraone, & Pennington, 2005). The current study aims to include a
neurological approach by utilizing EEG factors as the independent variables that reflect neurological abnormalities observed in individuals with ADHD in the analyses
examining the relation between brain wave activity and ADHD self-report scores from the CSS.
EEG Studies of Individuals with ADHD
Utility and Brief Background of EEG. EEG is a useful neurological tool within
the study of ADHD. Not only is it relatively inexpensive, transportable, and non-invasive (Green et al., 1985), but also a large amount of literature exists supporting that EEG can be used to detect neural differences electrophysiologically between individuals with and without ADHD (Arns, Conners, & Kraemer, 2013; Snyder & Hall, 2006; Loo & Makeig, 2012). Furthermore, other studies have found that similar patterns of brain wave activity within individuals with ADHD reflect activity of specific neurotransmitter patterns (Gunkelman, 2014; Steriade et al., 1990). The link between electrophysiology and neurochemistry is important to consider within EEG research because it provides physiological evidence of why certain medications may work well for some people, but not others due to individual differences in underlying neurotransmitter systems
EEG has been utilized to study ADHD in male and female children and adults (Loo & Makeig, 2012; Barry, Clarke, McCarthy, & Selikowitz, 2002; Arns, Conners, & Kraemer, 2013). Quantitative EEG (qEEG) is one method of EEG that has been used to examine differences between individuals with and without ADHD by comparing brain wave frequency activity (Arns et al., 2013; Snyder & Hall, 2006). For analyses, EEG is separated into different frequency bands (alpha 8-13 Hz, beta 13.5-30 Hz, theta 4-7.5 Hz, and delta 0.5-3.5 Hz). The dominant EEG frequency band varies depending on the activity state of the individual. For example, EEGs of typical adults often exhibit alpha activity in parietal and occipital brain areas during an eyes-closed resting state (Baehne & Fallgatter, 2009). QEEG can be used to study frequency band activity in several ways, including absolute power, coherence, peak frequency, phase relationships, and amplitude asymmetry (Baehne & Fallgatter, 2010). Differences in frequencies including the
theta/beta absolute power ratio and alpha coherence activity are two examples of brain wave activity differences that have been observed in individuals with ADHD when compared to those without ADHD (Barry et al, 2002; Clarke, et al., 2008a; Clarke et al., 2008b).
1998; Nunez & Srinivasan, 2006). Coherence is a squared correlation coefficient that measures the linear relation between two EEG electrode sites at a specific frequency (Pivik et al., 1993; Murias, Swanson, & Srinivasan, 2007). High coherence indicates synchronized brain wave activity between two electrodes at a particular frequency, while low coherence suggests that electrical activity between electrodes are not correlated (Tyner & Knott, 1983; Murias, Swanson, & Srinivasan, 2007). While researchers have found that differences between electrophysiological activity of individuals with and without ADHD exist, these differences are also specific to the age and sex of the participants. Thus, the present study will include only participants falling in the 18-27 year old age range, and sex will be included as a covariate in analyses to account for differences in EEG specific to age and sex.
EEG Studies of Children with ADHD. EEG differences have been studied
throughout the past several decades between children with and without ADHD.
Compared to children without ADHD, studies have found that children with ADHD have higher posterior delta activity (Matousek Rasmussen, & Gillberg, 1984; Clarke, Barry, McCarthy, & Selikowitz, 1998; Clarke, Barry, McCarthy, & Selikowitz, 2001a; Clarke, Barry, McCarthy, & Selikowitz, 2001b; Clarke, Barry, McCarthy, & Selikowitz 2002), decreased global alpha and beta activity (Dykman, Holcomb, Oglesby, & Ackerman, 1982; Callaway, Halliday, & Naylor, 1983; Mann, Norris, & Coccaro, 1992; Clarke et al., 1998; Clarke et al., 2001a; Clarke et al., 2001b; Clarke et al., 2002; Lazzaro et al., 1998), and more frontal theta activity (Satterfield, Cantwell, Lesser, & Podosin, 1972; Mann et al., 1992; Janzen, Graap, Stephanson, Marshall, & Fitzsimmons, 1995; Chabot &
al., 2001b; Clarke et al., 2002). However, the most commonly reported EEG pattern in literature that differentiates between children with and without ADHD is the theta/beta ratio (Barry, Clarke, McCarthy, & Selikowitz 2009; Clarke et al., 2001a; Janzen et al., 1995; Lubar, 1991; Kuperman, Johnson, Arndt, Lindgren, & Wolraich, 1996; Loo & Makeig, 2012; Monastra, Lubar, & Linden, 2001; Ogrim Kropotov, & Hestad, 2012; Snyder & Hall, 2006; Boutros, Fraenkel, & Feingold, 2005; Arns et al., 2013). This claim has face validity in that research has corroborated that the presence of increased, slow, theta wave power is associated with inattentiveness and hyperactivity; while decreased, fast, beta wave power is associated with less focus (Lubar, 1991; Arns, Gunkelman, Breteler, & Spronk, 2008). However, a recent meta-analysis conducted by Arns and colleagues (2013) found that the theta/beta ratio (when recorded in a standardized way at the central electrode in an eyes open, resting condition) was not a reliable diagnostic marker of ADHD. Additionally, Poil and colleagues (2014) found small effect sizes for the theta/beta ratio differences between children with and without ADHD, furthermore supporting claims that the theta/beta ratio is not a reliable definitive EEG marker pattern marker between children with and without. Despite these studies’ findings, research has continued to predominately focus on analyses of the theta/beta ratio with analyses of other absolute power frequencies.
theta frequencies than in the Inattentive presentation (Barry et al., 2009; Clarke et al., 2001a). Additionally, Clarke and colleagues (2001b) conducted a study that found that children with the combined presentation of ADHD had larger theta/beta ratios and
smaller theta/alpha ratios than the Inattentive presentation group of children with ADHD. These differences in EEG between children with the combined presentation of ADHD and the inattentive presentation of ADHD suggest that differences in behavior are
reflected electrophysiologically. Therefore, the current study aims to examine the relation between qEEG and inattentive and hyperactive symptoms separately.
Recent literature also suggests that sex differences in EEG exist between males and females with ADHD. Specifically, while literature has determined that EEG in boys with ADHD consistently differs when compared to boys without ADHD (Dupuy, Clarke, Barry, McCarthy, & Selikowitz, 2011; Clarke et al., 2001a), researchers have not found the same differences in EEG between girls with ADHD and without ADHD (Dupuy et al., 2013; Clarke et al., 2001a), while ADHD is reportedly less common in females than males, EEG research should still encompass females with ADHD due to evidence that significant behavioral gender differences in ADHD symptoms exist (Gaub & Carlson, 1997; Gershon, 2002). For example, a meta-analysis determined that girls with ADHD received lower ratings on hyperactivity, inattention, impulsivity, and externalizing problems, but they had greater intellectual impairments and more internalizing problems than boys with ADHD (Gershon, 2002). Although behavioral differences between males and females are known, the degree to which these differences are reflected
The few EEG studies comparing male and female children with ADHD have found inconsistent results. First, some studies have found that female children with ADHD have EEG patterns that are more comparable to control children than EEG profiles typical of males with ADHD (Clarke et al., 2001a; Clarke et al., 2003). Second, some studies have found that there are no gender differences in EEGs of individuals with ADHD, and that females with ADHD exhibit similar theta/beta ratios as males with ADHD (Hermens et al., 2004; Hermens, et al. 2005). Third, the most recent research has found that there are marked differences in EEG between girls with ADHD and boys with ADHD that indicate that it is not appropriate to apply male-based literature to all
findings will contribute to the clarification of how EEG differs between individuals with and without ADHD by including sex as a covariate in the statistical analyses.
A growing body of research has also implicated that differences between qEEG coherence of children with and without ADHD exist. Typically, children with ADHD have increased frontal and central coherences, specifically in short-medium
inter-electrode brain wave differences in theta and beta coherences in males, as well as reduced left lateralization in theta and alpha frequencies of short-medium inter electrode distances (Barry et al., 2002; Clarke et al, 2008a). Male children also typically have less
interhemispheric alpha coherence in the temporal region and more interhemispheric theta coherence in the central/parietal/ occipital region (Barry et al., 2002; Clarke et al., 2005; Barry et al., 2011). Conversely, females do not show these patterns in EEG coherence consistently (Barry, Clarke, McCarthy, & Selikowitz, 2006; Dupuy, Clarke, Barry, McCarthy, & Selikowitz, 2008). Barry and colleagues (2005) found that females with ADHD showed higher coherence values in the frontal and temporal regions within the theta band compared to controls. Additionally, female children with the combined
and without ADHD, males and females with ADHD, and the combined and inattentive presentations of ADHD.
EEG Studies with Adults with ADHD. EEG studies are not limited to children
with and without ADHD. Specifically, the literature examining EEG differences that exist between adults with ADHD and adults without ADHD has been growing in recent years. Studies have also shown that the electrophysiological differences between children with ADHD and those without ADHD are not the same as the differences observed between EEGs of adults with ADHD compared to adults without ADHD, which is likely attributed to neurodevelopmental changes with age (Bresnahan, Anderson, & Barry, 1999; Bresnahan & Barry, 2002; Barry, Clarke, & Johnstone, 2003). Despite brain development, the research has shown that adults with ADHD still exhibit differences in their brain wave activity when compared to adults without ADHD (Bresnahan & Barry, 2002; Koehler et al., 2009, Barry et al., 2003). Specifically, researchers have found that while elevated theta activity is still observed in adolescents and adults with ADHD, beta activity seems to normalize with age in both males and females (Breshnahan, Anderson, & Barry, 1999; Koehler et al., 2009; Bresnahan & Barry, 2002; Skirrow et al., 2013). Furthermore, as the brain develops and individuals with ADHD age, their inattentive and impulsive symptoms tend to remain, while their symptoms of hyperactivity decrease (Breshnahan, Anderson, & Barry, 1999; Wender, 1998). This finding has led researchers to hypothesize that the increased theta activity is related to impulsivity, while abnormal beta activity is associated with hyperactivity, explaining why hyperactivity may
children with ADHD and adults with ADHD due to brain development, the current study focuses only on the 18 to 27 year old age range.
While there have been studies including adults with ADHD, prior literature has not examined EEG patterns of young adults with ADHD in the college setting separately from older adults with ADHD. This distinction is important considering that during the developmental period of adolescence and young adulthood, dramatic neural
transformations occur through synaptic pruning and a reduction in gray matter in typical individuals. This has been reflected in previous EEG studies by an overall reduction of slow-wave (theta and beta) EEG activity (Whitford et al., 2007). Specifically, evidence exists that suggests the overall reduction of slow wave EEG activity is not observed in adolescents with ADHD like it is in adults without ADHD, which may account for the remaining inattentive symptoms (Loo & Barkle, 2005). Arguably, this population of individuals should not be neglected in research considering the increasing number of college students with ADHD, as well as the potential for differences in EEG patterns at the unique maturational time point of adolescence/young adulthood in both ADHD and non-ADHD individuals (Weyandt & DuPaul, 2008; Whitford et al., 2007).
There is room for growth within EEG research of adults with ADHD. Currently, only one existing study that examines EEG power differences specifically between college students with and without ADHD. In this study, Woltering and colleagues (2012) found that college students with ADHD exhibited less alpha absolute power than those without ADHD. Also, only one study exists that examined the EEG coherence
reduced hemispheric differences in delta coherence and lower coherences in the alpha band compared to adult males without ADHD. This finding contrasts with the literature on children with ADHD that suggests increased frontal and central coherence activity is correlated with ADHD (Barry et al., 2002; Clarke et al, 2008a). This led the authors to tentatively suggest that many coherence abnormalities observed in children with ADHD tend to disappear in adults with the disorder, and that the reduced alpha coherence may be associated with inattention (Clarke et al., 2008b). However, because this is the only study that has examined coherence in adults with ADHD, more research is needed.
Furthermore, the study only included males so the findings cannot be generalized to females. Therefore, the current study aims to examine coherence in male and female college students within the same age range in relation to ADHD symptoms.
Purpose of Present Study
No studies exist examining the dimensional relation between ADHD
wave activity on a continuum. Therefore, determining the relation between continuous measures of ADHD symptoms and brain wave activity would provide more evidence supporting the shift of conceptualizing ADHD categorically to dimensionally, which would more effectively account for individual differences in presentations of
symptomology (Hudziak et al., 2007). Third, while the most recent literature has
determined that EEG differences exist in absolute power and coherence between children with and without the Combined and Inattentive presentations of ADHD (Matousek et al., 1984; Clarke et al., 1998, 2001a,b, 2002; Dykman et al., 1982; Callaway et al., 1983; Mann et al., 1992; Lazzaro et al., 1998; Satterfield et al., 1972; Janzen et al., 1995; Chabot and Serfontein, 1996), EEG differences between male and female individuals with and without ADHD have not been firmly established (Woltering et al., 2012). There is a need within research to examine differences between qEEGs of males and females with ADHD because findings have vastly differed across studies (Hermens et al., 2004; Hermens, et al. 2005; Dupuy et al., 2013; Barry et al., 2006; Dupuy et al., 2008;
Breshnahan, Anderson, & Barry, 1999; Koehler et al., 2009; Bresnahan & Barry, 2002; Skirrow et al., 2013). Fourth, only one study exists examining differences in qEEG coherence between adults with and without ADHD, which only consisted of male participants (Clarke et al., 2008b). Clarke and colleagues (2008) found that while some markers of atypical coherence still existed in adults with ADHD, most atypical coherence patterns diminished in this age group. Therefore, there is a need for more research
correlation between coherence and ADHD symptoms has never been studied with female adult participants before.
The purpose of this study is to determine whether a relation exists between qEEG coherence and symptoms of inattentiveness and hyperactivity in male and female college students. The study asks the following questions:
(1) Do atypical qEEG coherence values predict more symptoms of inattentiveness in college students when sex is included in the model?
(2) Do atypical qEEG coherence values predict more symptoms of hyperactivity in college students when sex is included in the model?
In regards to the first research question, it is hypothesized that atypical EEG
coherence values will predict increased scores of inattentiveness. In regards to the second research question, it is hypothesized that atypical qEEG coherence values will not predict increased scores of hyperactivity. Both of these hypotheses are based on previous
CHAPTER 2 METHOD
Participants
Participant data from the first session of two research studies directed by the Applied Cognitive Neuropsychology lab at the University of South Carolina were initially included in the study, resulting in data from 44 undergraduate participants who attended a public university in the southeast of the United States. To be included in the study, participants had to be within the 18-27 age range, complete the ADHD self-report Current Symptoms Scale Measure (Barkley & Murphy, 2006), and have at least one minute of artifact-free, analyzable EEG coherence data. Two participants were excluded from analyses due to incomplete CSS measures. Thus, 42 participants (28 females, 14 males) between the ages of 18 and 27 were chosen for analysis. Twenty-seven (16 females, 11 males) of the participants reported that they had been previously diagnosed with ADHD by a physician. Of these 27 participants, 19 (10 females, 9 males) of them reported that they had taken their stimulant ADHD medication the day they participated in the study. Because time when the medication was taken was not recorded, and
Participants in both studies were recruited from undergraduate psychology classes, as well as through word of mouth advertising for studies utilizing EEG. For one study, students were compensated monetarily for their participation in the 26-session study. For the second study, participants received extra credit in their psychology course(s) as compensation for their participation in the study. Upon arriving to the session, each participant signed a letter of informed consent that summarized any potential health risks of the EEG, the approximated time of the session, the voluntary nature of the study, and their compensation. The University of South Carolina
Institutional Review Board (IRB) approved both research studies under P.I. Scott Decker, Ph.D.
Measures
The primary instruments utilized in the study include the CSS and EEG. The CSS was used to determine the amount of inattentive and hyperactive symptoms present. The EEG was used to record the eyes closed-resting state EEG of each participant.
Current Symptoms Scale—Self Report form (CSS). The CSS consists of 18
DSM-IV symptom items to assess inattentive and hyperactive-impulsive behaviors. Individuals rated their behavior throughout the past six months on each item on a 4 point Likert scale (Never or Rarely, Sometimes, Often, or Very Often) scored 0-3. For
by the amount of symptoms that were reported as “often” or “very often”. The second method is traditionally used to determine whether an individual meets ADHD diagnostic criteria by symptom count. The first method of using total scores was selected for the current study because it is more sensitive to the severity of reflects of inattentive and hyperactive symptoms reported by the individual, thus reflecting the dimensional approach to the symptoms. While determining CSS score by the amount of symptoms reported as “often” or “very often” is the recommended method for determining whether an individual meets diagnostic criteria for ADHD, previous research has also used the total score method for ADHD assessment when the research question is primarily concerned with ADHD severity of symptoms and when the study includes non-clinical participants (Upadhyaya et al., 2005; Knouse & Safren, 2009; Lerman et al., 2001).
The CSS has high internal consistency with reliability coefficients ranging from .84 to .95 in adult populations (Katz et al., 2009; Zucker, Morris, Ingram, Morris, & Bakeman, 2002). In the current study, the CSS has an internal consistency reliability coeffiecient of 0.81 according to a Cronbach coefficient alpha computation, which is only slightly lower that what has been reported in literature. Also, the CSS has high criterion validity scores that are established with a significant association with educational status (Barkley, 1998; Katz et al., 2009). Overall, this measure was chosen because it is a dimensional measurement, it has been reliably used as a screener for ADHD in multiple previous studies, it is quick to administer, easy for the participants to complete, and it was free to use.
EEG. Dell laptop computers were used in the administration, data collection, and
Discovery 24E amplifier was used with Neuroguide 6.6.4 program to record raw EEG data between 0.43 and 80 Hz, and an A/D conversion of 24 bits (Wigton & Krigbaum, 2015). While the amplifier has the capacity to sample at 1024 samples per second, the data rate of the computer is much slower (256 samples per second). The BrainMaster Discovery 24E amplifier was selected due to its compatibility with Neuroguide, which was used to collect and analyze the raw EEG data and create the quantitative EEGs (qEEG). This amplifier has been used in several similar studies with Neuroguide (i.e., Donaldson, Rozell, Moran, & Harlow, 2012; Luangboriboon, Tantayanon, &
Wongsawat, 2013), and this combination of software was recommended in a recent textbook chapter, Optimal Procedures in Z-Score Neurofeedback (Lubar, 2014). The
Neuroguide acquisition module employs a high-pass filter at 0.5 Hz and a low-pass filter at 50Hz in order to filter out noise due to other electronic devices in the laboratory (e.g., other computers, cell phones, building generators) (Wigton & Krigbaum, 2015).
Reliability coefficients for QEEG are >.85. MATLAB 2007b (Mathworks, Inc.),
Microsoft Office 2007, and SAS 9.4 was used for the final data organization and analysis.
Procedure
Data included in the study were from two research studies. Both studies used comparable procedures. Before arriving to the session, participants completed
(Below 5 KΩ for most participants) for each of the electrodes and ground leads placed on
the participants’ ears. Baseline recordings for resting conditions with three minutes eyes open and three minutes eyes closed were taken.
Data Analysis
to extract the relevant coherence data from the full dataset. Coherence between an
electrode pair for a certain band was defined as the cross-spectral power between the sites normalized by dividing the square root of the product of the power at each site within the band following John et al., (1987). This data was then exported to Microsoft Excel and SAS 9.4 for final analysis. G*Power 3.1 was used for a priori power analyses of the regression models.
Data Inspection
A review of regression diagnostics was conducted to ensure that regression assumptions were not violated, which could lead to biased parameter estimates and/or bias in standard errors of regression coefficients (Cohen et al., 2003). The data were inspected for linearity, normal distribution, independent error terms, homoscedasticity, out-of-range values, outliers, missing data, and multicollinearity. Linearity and
homoscedasticity were assessed by plotting the residuals against the predicted values of the dependent variables. Outliers were examined by calculating leverage and Cook’s d coefficients (Chatterjee & Hadi, 1996). Independence of errors and normality was assessed visually with a residual plot and histograms, respectively. Multicollinearity was assessed with variance inflation factors. Values less than 10 were deemed acceptable (Belsey, Kuh, & Welsch, 2005).
Statistical Analyses
Prior to analysis, the coherence values were transformed using Fisher’s
coherences were grouped into four intrahemispheric and three interhemispheric regions of interest. Several studies have used this same method of dividing coherence analyses into the same four intrahemispheric groups and three interhemispheric groups to analyze coherence differences between individuals with and without ADHD (Barry et al., 2004; Clarke et al., 2005; Clarke et al., 2008b; Dupuy et al., 2008; Barry et al., 2009; Barry et al., 2011) The intrahemispheric coherences were compared separately by using the within hemisphere means for each frequency band for the short/ medium inter-electrode
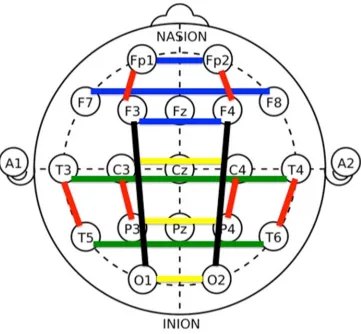
distances (left: Fp1-F3, T3-T5, C3-P3 and right: FP2-F4, T4-T6, C4-P4) and long inter-electrode distances (left: F3-O1 and right: F4-O2), resulting in two intrahemispheric groups for the right hemisphere and two intrahemipsheric groups for the left hemisphere. Then, the interhemispheric coherences were separately examined within the frontal (Fp1-Fp2, F7-F8, F3-F4), temporal (T3-T4, T5-T6), and central/parietal/occipital regions (C3-C4, P3-P4, O1-O2) for each frequency band (Barry et al., 2002; Clarke et al., 2008b) (See Figure 2.2).
Separate regression analyses were conducted for each of the 7 coherence groups with sex included as a covariate for each frequency band, resulting in 56 total planned regressions (Dupuy et al., 2013; Clarke et al., 2001a). The independent variables for each regression model included sex as the covariate and each coherence electrode pair for the specified region, and these were conducted for the alpha, beta, theta, and delta
frequencies. The regressions were conducted with the CSS inattention symptoms and CSS hyperactivity symptoms separately due to high multicollinearity between the
regressions for the inattentive and hyperactive symptoms were also conducted due to previous research that suggests that different brain wave activity is responsible for each of these cognitive processes (Koehler et al., 2009; Bresnahan & Barry, 2002; Skirrow et al., 2013). The total number of planned regression analyses was 28 analyses with CSS inattention scores as the dependent variable and 28 regression analyses with CSS hyperactivity scores as the dependent variable. Post-hoc regression analyses were also run separately for males and females for exploratory purposes resulting in 28 regressions conducted for male region coherences and CSS inattention symptoms, 28 regressions conducted for male region coherences and CSS hyperactivity symptoms, 28 regressions conducted for female region coherences and CSS inattention symptoms, and 28
regressions conducted for female region coherences and CSS hyperactivity symptoms. Because these regressions were ran for exploratory purposes with no explicit prespecified hypotheses, multiplicity corrections for α, such as Bonferroni corrections, were not
Figure 2.2 Intrahemispheric and interhemisperic coherence regions of interest.
Region Key Color Electrode Pairs
Intrahemispheric coherences
Short/medium distance Red Fp1-F3, C3-P3, T3-T5, Fp2-F4, C4-P4, T4-T6
Long distance Black F3-O1, F4-O2
Interhemispheric coherences
Frontal Blue Fp1-Fp2, F7-F8, F3-F4 Temporal Green T3-T4, T5-T6
CHAPTER 3 RESULTS
Data Inspection
No out-of range values or missing data were detected during the data inspection, and all means and standard deviations were within reasonable limits. Influential
univariate outliers were detected according to Cook’s d and leverage values, but they were not removed because they fell within the appropriate range. All cases were included in the analyses. The results revealed a linear trend in the models. Slight differences from normality were detected in the data; however, it was not deemed non-normal enough for transformations. No problems with independence were detected. Some evidence of multicollinearity was detected, however, all VIF values were less than 10 supporting that the multicollinearity was not problematic.
Descriptive Data
Mean age and CSS screener score data for males and females are presented in Table 1. No significant differences existed between male and female scores of
inattentiveness (t(20.2)=0.86, p=0.40) and hyperactivity on the screeners (t(20.1)=0.75, p=0.46). Means and standard deviations of coherences for each frequency at each
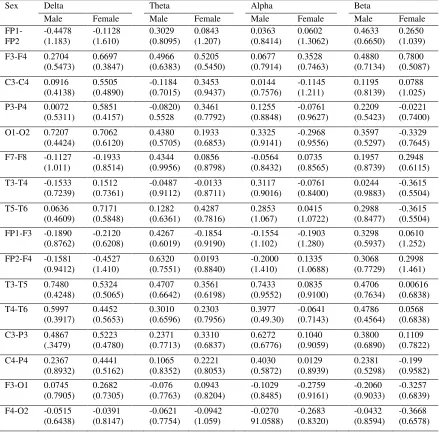
electrode pair are presented in Table 2.
Power Analysis
obtaining a statistically significant result is due to a true relation between the independent and dependent variables. A priori power analyses were conducted for the regression models with two, three, and four independent variables to represent the independent variables included in the seven regression analyses conducted for each frequency band. In G*Power, effect size was set to f2= 0.35 for a large effect size (Cohen, 1992), α error
probability was set to 0.05, and power (1-β error probability) was set to 0.95. In order to
have adequate power, a total sample size of 40 participants was recommended for models with two, three, and four independent variables. Because the current study included 42 participants, there is adequate power to draw inferences from significance test results of the planned regression analyses. However, because the exploratory analyses included 14 males and 28 females in separate regressions, the results from these analyses do not have enough power to support claims of significant results. Since the inclusion of separate regression analyses for males and females was exploratory, the results are still included.
Coherence Data
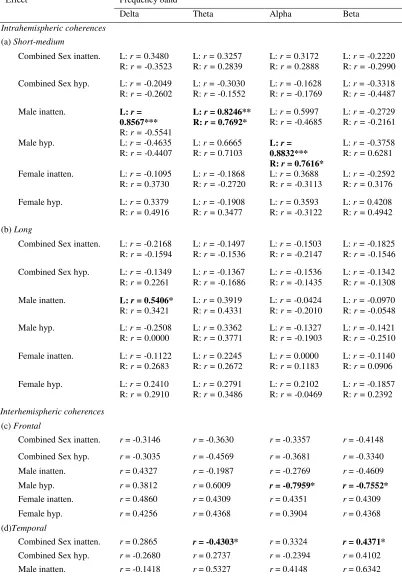
Only significant results were reported below. The planned regression analyses with sex as a covariate are reported first, followed by the exploratory regression analyses that are separated for each sex. See Table 3 for full summary with inclusion of non-significant results.
Coherence data: Sex as Covariate.Within the beta coherence, lower temporal
interhemispheric coherence significantly predicted higher CSS scores for inattentiveness (F(3,38)=2.99, p = 0.0428, R2=0.1911). Also, within theta coherence, lower temporal
interhemisphic coherence scores significantly predicted higher CSS scores for
found when examining the relation between coherence with sex as a covariate and CSS measures of inattentiveness and hyperactivity.
Exploratory Analyses of Coherence data: Males.
Intrahemispheric coherence. Within the alpha coherence frequencies, both the
left and right short/medium intrahemispheric coherences were significantly correlated with CSS scores for hyperactivity in males. Specifically, higher left alpha short/medium intrahemispheric coherences significantly predicted higher scores of hyperactivity (F
(3,10)=11.78, p = 0.0013, R2=0.7800) and higher right alpha short/medium
intrahemispheric coherences significantly predicted higher scores of hyperactivity (F
(3,10)=4.60, p = 0.0286, R2=0.5800) in males.
Within the theta coherence frequencies, the left and right short/medium
intrahemispheric coherences were significantly correlated with CSS scores for inattention in males. Specifically, higher left theta short/medium intrahemispheric coherences
significantly predicted higher scores of inattention (F (3,10)=7.08, p = 0.0078, R2=0.6800) and higher right theta short/medium intrahemispheric coherences
significantly predicted higher scores of inattention (F (3,10)=4.83, p = 0.0250, R2=0.5917).
In the delta coherence frequencies, the left short/medium intrahemispheric coherences and left long intrahemispheric coherence was significantly correlated with CSS scores for inattention in males. Specifically, higher left delta short/medium
coherence significantly predicted higher scores of inattention in males (F (1,12)=4.95, p=0.0460, R2=0.2922).
Beta coherence frequencies did not have significant relations between CSS inattention and hyperactivity scores for the intrahemispheric coherences. The right long intrahemispheric coherences did not have significant relations between CSS scores of inattention and hyperactivity for any of the frequency bands.
Interhemispheric coherence. In males, lower frontal beta interhemispheric
coherences significantly predicted higher scores of CSS hyperactivity (F (3,10)=4.43, p=0.0317, R2=0.5704). Lower central/parietal/occipital beta interhemispheric coherences
significantly predicted higher CSS inattention scores in males (F (3,10)=4.53, p=0.0300, R2=0.5760).
Lower frontal alpha interhemispheric coherences significantly predicted higher CSS hyperactivity scores in males (F (3,10)=5.76, p=0.0149, R2=0.6334).
There were no significant relations between theta interhemispheric coherences and symptoms of inattention and hyperactivity, and there were no significant relations between delta interhemispheric coherences and symptoms of inattention and
hyperactivity.
Exploratory Analyses of Coherence Data: Females. No statistically significant
hyperactivity (F (3, 24)=3.04, p=0.0483, R2=0.2760). Coherence frequencies in the alpha,
39
Table 3.1 Means of Age and CSS Scores of Participants
Note. Standard deviations appear in parentheses below means.
Sex N Age
CSS Inattention Score
CSS Hyperactivity Score
Male 14 21.57
(4.783)
9.714 (9.000)
9.357 (7.929)
Female 28 20.43
(1.730)
7.393 (6.545)
Table 3.2 Mean coherence level across participants for each electrode pair (SD in brackets)
Sex Delta Theta Alpha Beta
Male Female Male Female Male Female Male Female
FP1-FP2 -0.4478 (1.183) -0.1128 (1.610) 0.3029 (0.8095) 0.0843 (1.207) 0.0363 (0.8414) 0.0602 (1.3062) 0.4633 (0.6650) 0.2650 (1.039) F3-F4 0.2704
(0.5473) 0.6697 (0.3847) 0.4966 (0.6383) 0.5205 (0.5450) 0.0677 (0.7914) 0.3528 (0.7463) 0.4880 (0.7134) 0.7800 (0.5087) C3-C4 0.0916
(0.4138) 0.5505 (0.4890) -0.1184 (0.7015) 0.3453 (0.9437) 0.0144 (0.7576) -0.1145 (1.211) 0.1195 (0.8139) 0.0788 (1.025) P3-P4 0.0072
(0.5311) 0.5851 (0.4157) -0.0820) 0.5528 0.3461 (0.7792) 0.1255 (0.8848) -0.0761 (0.9627) 0.2209 (0.5423) -0.0221 (0.7400) O1-O2 0.7207
(0.4424) 0.7062 (0.6120) 0.4380 (0.5705) 0.1933 (0.6853) 0.3325 (0.9141) -0.2968 (0.9556) 0.3597 (0.5297) -0.3329 (0.7645) F7-F8 -0.1127
(1.011) -0.1933 (0.8514) 0.4344 (0.9956) 0.0856 (0.8798) -0.0564 (0.8432) 0.0735 (0.8565) 0.1957 (0.8739) 0.2948 (0.6115) T3-T4 -0.1533
(0.7239) 0.1512 (0.7361) -0.0487 (0.9112) -0.0133 (0.8711) 0.3117 (0.9016) -0.0761 (0.8400) 0.0244 (0.9883) -0.3615 (0.5504) T5-T6 0.0636
(0.4609) 0.7171 (0.5848) 0.1282 (0.6361) 0.4287 (0.7816) 0.2853 (1.067) 0.0415 (1.0722) 0.2988 (0.8477) -0.3615 (0.5504) FP1-F3 -0.1890
(0.8762) -0.2120 (0.6208) 0.4267 (0.6019) -0.1854 (0.9190) -0.1554 (1.102) -0.1903 (1.280) 0.3298 (0.5937) 0.0610 (1.252) FP2-F4 -0.1581
(0.9412) -0.4527 (1.410) 0.6320 (0.7551) 0.0193 (0.8840) -0.2000 (1.410) 0.1335 (1.0688) 0.3068 (0.7729) 0.2998 (1.461) T3-T5 0.7480
(0.4248) 0.5324 (0.5065) 0.4707 (0.6642) 0.3561 (0.6198) 0.7433 (0.9552) 0.0835 (0.9100) 0.4706 (0.7634) 0.00616 (0.6838) T4-T6 0.5997
(0.3917) 0.4452 (0.5653) 0.3010 (0.6596) 0.2303 (0.7956) 0.3977 (0.49.30) -0.0641 (0.7143) 0.4786 (0.4564) 0.0568 (0.6838) C3-P3 0.4867
(.3479) 0.5223 (0.4780) 0.2371 (0.7713) 0.3310 (0.6837) 0.6272 (0.6776) 0.1040 (0.9059) 0.3800 (0.6890) 0.1109 (0.7822) C4-P4 0.2367
(0.8932) 0.4441 (0.5162) 0.1065 (0.8352) 0.2221 (0.8053) 0.4030 (0.5872) 0.0129 (0.8939) 0.2381 (0.5298) -0.199 (0.9582) F3-O1 0.0745
(0.7905) 0.2682 (0.7305) -0.076 (0.7763) 0.0943 (0.8204) -0.1029 (0.8485) -0.2759 (0.9161) -0.2060 (0.9033) -0.3257 (0.6839) F4-O2 -0.0515
Table 3.3 Summary of correlation coefficients and obtained effects
Effect Frequency band
Delta Theta Alpha Beta
Intrahemispheric coherences (a) Short-medium
Combined Sex inatten. L: r = 0.3480 R: r = -0.3523
L: r = 0.3257 R: r = 0.2839
L: r = 0.3172 R: r = 0.2888
L: r = -0.2220 R: r = -0.2990 Combined Sex hyp. L: r = -0.2049
R: r = -0.2602
L: r = -0.3030 R: r = -0.1552
L: r = -0.1628 R: r = -0.1769
L: r = -0.3318 R: r = -0.4487
Male inatten. L: r=
0.8567*** R: r = -0.5541
L: r = 0.8246** R: r = 0.7692*
L: r = 0.5997 R: r = -0.4685
L: r = -0.2729 R: r = -0.2161
Male hyp. L: r = -0.4635
R: r = -0.4407
L: r = 0.6665 R: r = 0.7103
L: r = 0.8832*** R: r = 0.7616*
L: r = -0.3758 R: r = 0.6281 Female inatten. L: r = -0.1095
R: r = 0.3730
L: r = -0.1868 R: r = -0.2720
L: r = 0.3688 R: r = -0.3113
L: r = -0.2592 R: r = 0.3176 Female hyp. L: r = 0.3379
R: r = 0.4916
L: r = -0.1908 R: r = 0.3477
L: r = 0.3593 R: r = -0.3122
L: r = 0.4208 R: r = 0.4942 (b) Long
Combined Sex inatten. L: r = -0.2168 R: r = -0.1594
L: r = -0.1497 R: r = -0.1536
L: r = -0.1503 R: r = -0.2147
L: r = -0.1825 R: r = -0.1546 Combined Sex hyp. L: r = -0.1349
R: r = 0.2261
L: r = -0.1367 R: r = -0.1686
L: r = -0.1536 R: r = -0.1435
L: r = -0.1342 R: r = -0.1308 Male inatten. L: r = 0.5406*
R: r = 0.3421
L: r = 0.3919 R: r = 0.4331
L: r = -0.0424 R: r = -0.2010
L: r = -0.0970 R: r = -0.0548
Male hyp. L: r = -0.2508
R: r = 0.0000
L: r = 0.3362 R: r = 0.3771
L: r = -0.1327 R: r = -0.1903
L: r = -0.1421 R: r = -0.2510 Female inatten. L: r = -0.1122
R: r = 0.2683
L: r = 0.2245 R: r = 0.2672
L: r = 0.0000 R: r = 0.1183
L: r = -0.1140 R: r = 0.0906 Female hyp. L: r = 0.2410
R: r = 0.2910
L: r = 0.2791 R: r = 0.3486
L: r = 0.2102 R: r = -0.0469
L: r = -0.1857 R: r = 0.2392 Interhemispheric coherences
(c) Frontal
Combined Sex inatten. r = -0.3146 r = -0.3630 r = -0.3357 r = -0.4148 Combined Sex hyp. r = -0.3035 r = -0.4569 r = -0.3681 r = -0.3340 Male inatten. r = 0.4327 r = -0.1987 r = -0.2769 r = -0.4609
Male hyp. r = 0.3812 r = 0.6009 r = -0.7959* r = -0.7552*
Female inatten. r = 0.4860 r = 0.4309 r = 0.4351 r = 0.4309
Female hyp. r = 0.4256 r = 0.4368 r = 0.3904 r = 0.4368
(d)Temporal
Male hyp. r = -0.3407 r = -0.1127 r = -0.1778 r = 0.5455 Female inatten. r = 0.4584 r = 0.3397 r = 0.2138 r = 0.3715
Female hyp. r = 0.4061 r = 0.3697 r = 0.3219 r = 0.3846
(e)Central/parietal/occipital
Combined Sex inatten. r = 0.3989 r = 0.3894 r = 0.3947 r = 0.3904 Combined Sex hyp. r = 0.4082 r = 0.3848 r = -0.2298 r = -0.3022 Male inatten. r = 0.5962 r = 0.5857 r = 0.6065 r = -0.7589*
Male hyp. r = 0.5541 r = 0.5812 r = 0.5407 r = 0.4830
Female inatten. r = -0.5292* r = 0.4516 r = 0.4102 r = 0.3504
Female hyp. r = 0.5254* r = 0.4082 r = -0.3306 r = 0.3360
Inatten.: Inattentive CSS symptoms; Hyp: hyperactive CSS symptoms; L; left; R: right; r:
CHAPTER 4 DISCUSSION
This study investigated the relation between symptoms of inattentiveness and hyperactivity based on the CSS self-report behavioral rating scale scores with EEG coherence values across all frequencies in male and female college students. The study was designed to contribute to current literature by examining the relation between ADHD symptoms and EEG from a dimensional approach via multivariate regression. The current study also investigated whether the relation between ADHD symptoms and EEG
coherence was affected by sex. Based on prior literature, it was hypothesized that atypical coherence would predict higher scores of inattentiveness and hyperactivity, and that this relation would differ when considering sex.
without ADHD (Barry et al., 2005; Barry et al., 2002; Clarke et al., 2005). Also, the research has shown that interhemispheric coherences in the alpha band are lower in children with ADHD when compared to children without ADHD (Clarke et al., 2005). In the only existing study on coherence in adults with ADHD, adults with ADHD had lower alpha coherence in the short-medium, inter-electrode distances (Clarke et al., 2008b). However, no studies have exclusively looked at the correlation of ADHD
symptomatology and EEG coherence in college students while considering sex as a covariate.
Overall, the findings of the current study support both hypotheses that atypical EEG coherence values predict more symptoms of inattentiveness and hyperactivity in college students with sex as a covariate. Specifically, the results indicate that significant associations exist between both EEG coherence and hyperactive symptoms, and EEG coherence and inattentive symptoms according to the CSS behavior rating scale.
However, this claim is limited to particular regions and frequencies because not all of the relations between coherence and ADHD symptoms were significant. Also, because the present study is the first of its kind to compare ADHD symptoms to EEG from a
dimensional approach, it is not possible to directly generalize findings to previous studies that separated groups into ADHD and non-ADHD. Therefore, interpretations were made with caution, and the CSS self-reports of high symptoms of inattentiveness and
hyperactivity were tentatively compared with ADHD diagnoses in previous studies to draw some parallels between the current study’s findings and previous research.
When including sex in the model as a covariate, lower temporal beta
and lower temporal theta interhemisphic coherence scores significantly predicted higher CSS scores for inattentiveness. This finding supports the theory that beta coherence typically decreases with age due to the typical reduction in hyperactivity with development (Bellak & Black, 1991; Clarke et al., 2008b). Also, prior studies have indicated that high theta power is associated with higher symptoms of adult
inattentiveness in ADHD (Loo & Barkley, 2005), but this has not been considered in terms of coherence. Therefore, the finding of the current study that inattentive ADHD symptoms negatively predict temporal interhemispheric theta coherence needs to be replicated in future studies. Both of these significant findings in the multivariate
regression model with sex as a covariate provide support for the hypothesis that atypical coherence is associated with higher CSS inattentiveness scores.
The exploratory analyses examining the association between coherence and inattentiveness and hyperactivity in males and females in separate models led to additional significant associations between ADHD symptoms and EEG coherence.
predicted higher scores of hyperactivity, and higher right alpha short/medium intrahemispheric coherences (FP2-F4, T4-T6, C4-P 4) significantly predicted higher scores of hyperactivity in males. This relation has not been reported in prior literature; however, Clarke and colleagues (2008b) interpreted reduced alpha coherence as an association with inattention. The current study’s results support that higher central, temporal, and frontal alpha coherences in both the left and right hemispheres are associated with hyperactive symptoms, suggesting that more research is needed to determine the relation between alpha coherence and ADHD symptoms. Due to the current study’s approach to ADHD symptoms dimensionally, it is possible that these analyses captured a unique association between central, temporal, and frontal alpha coherence and strictly hyperactive behaviors that could be overshadowed by a diagnosis of ADHD, which is typically represented by reduced hyperactive behaviors with older age. This association needs to be replicated in future studies.
In terms of the association between coherence and inattentive symptoms, higher left and right theta short/medium intrahemispheric coherences significantly predicted higher scores of inattention. The finding that more theta coherence in both the left and right central, temporal, and frontal regions is associated with more inattentive symptoms, which is consistent with the prior finding that adults with ADHD typically show more theta power activity than adults without ADHD (Koehler et al., 2009; Bresnahan, 2002; Bresnahan & Barry, 2002; Skirrow et al., 2013). While these studies have claimed that higher theta activity in adults with ADHD may represent impulsivity, the current findings suggest that specifically higher theta coherence may contribute to symptoms of
The results also indicated that higher left delta short/medium intrahemispheric coherences significantly predicted higher scores of inattention; and higher left delta long (F3-O1) intrahemispheric coherence significantly predicted higher scores of inattention. These findings that more delta coherence within the left hemisphere predict higher inattentive symptoms differ from Clarke and colleagues (2008) findings that that adult males with ADHD exhibited reduced hemispheric differences in delta coherence.
Therefore, the findings of the current study could be specific to age or strictly inattentive behaviors instead of ADHD. More research is needed to support this claim.
Significant relations between interhemispheric coherences and ADHD symptoms also were found. First, lower frontal beta interhemispheric (Fp1-Fp2, F7-F8, F3-F4) coherences significantly predicted higher scores of CSS hyperactivity, and lower central/parietal/occipital beta interhemispheric coherences (C3-C4, P3-P4, O1-O2) significantly predicted higher CSS inattention scores in males. These findings suggest that less beta coherence activity across hemispheres predicts atypical scores of
hyperactivity and inattention, depending on the region of the brain. These findings differ from previous literature that has found that beta coherence typically normalizes with age (Koehler et al., 2009; Bresnahan, 2002; Bresnahan & Barry, 2002; Skirrow et al., 2013). Because the sample consisted of young adults, the participants’ brains had not reached the maturational time point in which beta coherence normalizes. However, in children, more interhemispheric beta coherence is typically associated with ADHD symptoms, not less (Barry et al., 2002, 2005; Clarke et al, 2007; Barry et al., 2011). Therefore, a
Also, lower frontal alpha interhemispheric coherences (Fp1-Fp2, F7-F8, F3-F4) significantly predicted higher CSS hyperactivity scores in males. This is supported by Clarke and colleagues’ (2008) findings that individuals with ADHD had less alpha coherence than those without ADHD. However, the researchers claimed that this was due to reduced hyperactive symptoms and the presence of strictly inattentive symptoms. Therefore, the current findings should be replicated to determine whether the relation in the Clarke and colleagues (2008b) study is due to their claim.
Fewer significant relations were found between ADHD symptoms and EEG coherence in females than were found in males. This is consistent with previous literature suggesting that EEG differences between female participants with and without ADHD are subtler and less consistent in female participants than in males (Barry et al., 2006; Dupuy et al., 2008; Dupuy et al., 2012). Additionally, because 28 females were included in the study compared to the 14 males, their associations between ADHD symptoms and EEG coherence may have overshadowed the influence from the males, seemingly reducing the number of significant relations between ADHD symptoms and EEG coherence when sex was included in the model as a variable.
Two significant results were found between EEG coherence and ADHD symptoms within females. Specifically, lower delta central/parietal/occipital interhemispheric coherences predicted higher scores of inattention, and lower delta central/parietal/occipital interhemispheric coherences predicted higher scores of
hypothesis that atypical coherence predicts ADHD symptoms differently in males and females.
Limitations
Despite the significant findings, there are several limitations to the current study. First, factors such as previous diagnoses, medication, and cognitive abilities were not controlled for, despite the fact that all of these have neurological origins. The sample size was also relatively small, especially for the male participants. In order to achieve a more accurate picture of the relation between coherence and ADHD symptoms, future studies should attempt to age match equal number of male to female participants in order to increase control. Also, only the CSS self-report was used to measure the ADHD symptoms in the participants. While this measure is supported empirically, other measures like the CAARS are often preferred as self-report screeners. Furthermore, because this is the first study of its kind to examine the dimensional relation between EEG coherence and ADHD symptoms according to a self-report in both males and females, there is a need to replicate these findings. Additionally, employing a moderated multiple regression approach in future studies instead of separating analyses for males and females would provide more statistical power.
Implications
The results of the current study suggest that EEG coherence can predict some differences in ADHD symptoms from a dimensional perspective in male and female young adults, thus providing tentative evidence that EEG may be useful as a
REFERENCES
American Academy of Pediatrics (AAP) (2000). Clinical practice guideline: diagnosis and evaluation of the child with attention-deficit/hyperactivity disorder.
Pediatrics, 105(5), 1158–1170.
Advokat, C. (2009). What exactly are the benefits of stimulants for ADHD?. Journal of Attention Disorders, 12(6), 495-498.
Advokat, C., Lane, S. M., & Luo, C. (2011). College students with and without ADHD: Comparison of self-report of medication usage, study habits, and academic achievement. Journal of Attention Disorders, 15(8), 656-666.
Alexander, L., & Liljequist, L. (2016). Determining the accuracy of self-report versus informant-report using the Conners’ Adult ADHD rating scale. Journal of Attention Disorders, 20(4), 346-352.
American Psychiatric Association (2013). Diagnostic and statistical manual of mental disorders (5th ed.). Arlington, VA: American Psychiatric Publishing.
Arns, M., Conners, C. K., & Kraemer, H. C. (2013). A decade of EEG theta/beta ratio research in ADHD: a meta-analysis. Journal of Attention Disorders, 17 (5), 374–
383.
Arnsten, A. F. (2006). Stimulants: Therapeutic actions in ADHD.
Neuropsychopharmacology, 31(11), 2376-2383.
Baehne, C. G., & Fallgatter, A. J. (2009). Neurophysiology of adult attention-deficit hyperactivity disorder. Attention-Deficit Hyperactivity Disorder (ADHD) in Adults,176(1), 78-87.
Balázs, J., & Keresztény, Á. (2014). Subthreshold attention deficit hyperactivity in children and adolescents: a systematic review. European Child & Adolescent Psychiatry, 23(6), 393-408.
Barkley, R. A. (1997). Behavioral inhibition, sustained attention, and executive functions: constructing a unifying theory of ADHD. Psychological Bulletin, 121(1), 65.
Barkley, R.A. (1998). Attention Deficit Hyperactivity Disorder: A handbook for diagnosis and treatment (2nd Ed.).New York: Guilford Press.
Barkley, R. A. (Ed.). (2014). Attention-deficit hyperactivity disorder: A handbook for diagnosis and treatment. Guilford Publications. P 62.
Barkley, R. A., Fischer, M., Smallish, L., & Fletcher, K. (2002). The persistence of attention-deficit/hyperactivity disorder into young adulthood as a function of reporting source and definition of disorder. Journal of Abnormal
Psychology, 111(2), 279.
Barkley, R.A., & Murphy, K.R. (2006). Attention-Deficit Hyperactivity Disorder: A Clinical Workbook. New York: Guilford Press.
Barry, R. J., Clarke, A. R., & Johnstone, S. J. (2003). A review of electrophysiology in attention-deficit/hyperactivity disorder: I. Qualitative and quantitative
electroencephalography. Clinical Neurophysiology, 114(2), 171-183.
Barry, R. J., Clarke, A. R., Johnstone, S. J., McCarthy, R., & Selikowitz, M. (2009). Electroencephalogram θ/β ratio and arousal in attention-deficit/hyperactivity
disorder: Evidence of independent processes. Biological Psychiatry, 66(4),
398-401.
Barry, R. J., Clarke, A. R., McCarthy, R., & Selikowitz, M. (2002). EEG coherence in attention-deficit/hyperactivity disorder: a comparative study of two DSM-IV types. Clinical Neurophysiology, 113(4), 579-585.
Barry, R. J., Clarke, A. R., McCarthy, R., & Selikowitz, M. (2006). Age and gender effects in EEG coherence: III. Girls with attention-deficit/hyperactivity disorder. Clinical Neurophysiology, 117(2), 243-251.
Barry, R. J., Clarke, A. R., McCarthy, R., Selikowitz, M., Johnstone, S. J., Hsu, C. I., ... & Magee, C. A. (2005). Age and gender effects in EEG coherence: II. Boys with attention deficit/hyperactivity disorder. Clinical Neurophysiology, 116(4),
977-984.
Barry, R., Clarke, A., McCarthy, R., Selikowitz, M., Johnstone, S., Rushby, J., 2004. Age and gender effects in EEG coherence: I. Developmental trends in normal children.
Clinical Neurophysiology.115(10), 2252–2258.