A Quantitative Evaluation of the Nighttime Visual
Sign Inspection Method
William J. Rasdorf, Ph.D., P.E., F.ASCE
Professor
Department of Civil, Construction and Environmental
Engineering
North Carolina State University
Raleigh, NC 27695-7908
Phone: (919) 515-7637
Fax: (919) 515-7908
Email: [email protected]
Joseph E. Hummer, Ph.D., P.E., M.ASCE
Professor
Department of Civil, Construction and Environmental
Engineering
North Carolina State University
Raleigh, NC 27695-7908
Phone: (919) 515-7733
Fax: (919) 515-7908
Email: [email protected]
Stephanie C. Vereen
CDM Contractors
Maitland, FL 32751
Phone: (407) 660-6448
Fax: (407) 660-8912
Email: [email protected]
Hubo Cai
GIS Analyst
URS
Moorisville, NC 27560
Phone: (919) 461-1210
Email: [email protected]
Key Words: Visual Inspection, Sign Inventory, Sign Management,
Sign Inspection, Retroreflectivity, Retroreflectometer, Inspection
Frequency
Number of Words: 5900 + 4 figures + 7 tables
ABSTRACT
A research project focusing on determining the appropriate sign inspection and replacement procedure was conducted at North Carolina State University, sponsored by the North Carolina DOT. The purpose of this project was to determine the optimum strategy for sign inspection and replacement under different conditions to respond to the pending retroreflectivity requirements. This paper reports on a spreadsheet tool developed during the project to quantitatively evaluate the effectiveness of different sign inspection and replacement scenarios. The spreadsheet was designed for yellow and red engineer grade sign sheetings, and takes into account sign vandalism and knock-downs as well as normal sign aging. The spreadsheet provides estimates of the number of signs in place that would not meet the minimum retroreflectivity standard, and the cost of the sign inspection and replacement program.
INTRODUCTION
Transportation agencies such as state Departments of Transportation (DOTs) are responsible for managing roads and signs across the United States. One of the concerns of state DOTs is sign inventory and management. Statistics from the National Highway Traffic Safety Administration reveal that in 1999, there were 286,000 crashes due to stop sign issues nationwide (Congressional Information Service 1999). The Institute of Transportation Engineers (ITE)
Traffic Sign Handbook states, “if signing is done improperly, longer driver response times, inappropriate responses, or errors will result, all of which adversely affect safety” (Institute of Transportation Engineers 1997). A report by the Federal Highway Administration (FHWA) reveals that the risk of dying in a crash at night, when signs are more difficult to see, is nearly three times that of dying in the daytime (U. S. Department of Transportation 1999). It is imperative that DOTs have effective sign testing and replacement programs to significantly reduce the safety risks to motorists.
One important aspect of sign performance is retroreflectivity, measured by a coefficient of retroreflection. The coefficient of retroreflection (Ra) can be understood as the ratio of the light which the sign reflects to a driver (cd) to the light which illuminates the sign (lx) per unit area (m2). The English unit for Ra is cd/fc/sf (candelas per foot-candle per square foot). Ra has the same value in the metric system. It is often referred to as Specific Intensity per unit Area (SIA).
The effectiveness of retroreflective (light returned to the driver) sign sheeting has not been quantified. Beginning in 1984, the Center for Auto Safety petitioned FHWA to establish standards for retroreflectivity. In 1993, the Department of Transportation Appropriation Act stated that the U. S. Secretary of Transportation should revise the Manual for Uniform Traffic Control Devices (MUTCD) to include “a standard for a minimum level of retroreflectivity that must be maintained for pavement markings and signs, which shall apply to all roads open to public travel” (AASHTO 2000). FHWA formulated two related reports in 1998. One report aimed at “evaluating the applicability and practicality of the minimum-maintained levels of sign retroreflectivity proposed by FHWA and the hand-held retroreflectometer that measures sign retroreflectivity” (McGee and Taori 1998). The other report aimed at providing explanations and procedures to assist agencies in developing their own sign management systems to meet the minimum retroreflectivity requirements (McGee and Paniati 1998). Although the 2000 edition of the MUTCD did not include retroreflectivity guidelines, Section 2A.09 of the MUTCD is reserved for their future addition.
New retroreflectivity requirements in the pending standard will present several new issues to state transportation agencies responsible for sign replacement and maintenance. In the case of North Carolina, the state owns and maintains approximately 78,000 miles of roadway. Interstate and primary roads contain approximately 388,000 signs and secondary roads contain approximately 605,000 signs (Kirtley and Rasdorf 2001, Palmquist and Rasdorf 2002). The new standard poses serious implementation challenges to the North Carolina DOT. Other state DOTs face similar challenges. When these new standards are finally adopted, both compliance (for the safety and wellbeing of the public) and proof of compliance (to protect against lawsuits) will be necessary.
To meet the proposed new standard, state DOTs have to develop their own sign inspection and replacement procedures. Current procedures will have to be examined, together with alternatives, to determine the optimum sign inspection and replacement procedure.
A research project focusing on determining the appropriate sign inspection and replacement procedure was conducted at North Carolina State University, sponsored by the North Carolina DOT. The purpose of this project was to determine the optimum strategy for sign inspection and replacement under different conditions to respond to the pending retroreflectivity requirements. This paper reports on some of the findings of this research project. In particular, the paper focuses on a tool developed to investigate the effectiveness of different sign inspection and replacement scenarios.
NIGHTTIME SIGN INSPECTION
Nighttime observation of signs is currently the most commonly used procedure in the United States to determine whether signs are visually adequate. Generally, in this procedure, a two-member team (a driver and a recorder) will drive a vehicle along a road observing and measuring the conditions of road signs and determining the appropriate actions to be taken such as replacement and repair.
The North Carolina DOT Nighttime Visual Inspection Method
The North Carolina DOT inspection method is simply to follow predetermined driving path and evaluate all signs along this path to determine if they are visually adequate. Roads are driven in both directions. However, on many secondary roads, where signs are sparse, the crew will slow the car and shine a light back on signs facing the opposite direction for evaluation. Visually, signs are evaluated at posted speed limits, using the headlights of the car as the light source. If a sign is determined to be questionable, the crew will get out of the car to take a closer look at the sign sheeting and check the sticker indicating the installation date of the sign to determine the appropriate action to be taken, such as replacement, repair, or cleaning. The recorder uses a state-issued form to inventory signs needing replacement. Signs not needing replacement, but requiring repair or cleaning, are recorded on a separate form.
During the nighttime visual inspections, conditions other than retroreflectivity that affect the visibility of the signs are also evaluated. For example, signs might be placed incorrectly or be obstructed by bushes. These conditions will also lead to appropriate actions to be taken so that proper placement and visibility are achieved.
It is noted that employee performance is also an important factor in evaluating sign conditions. The same employee may work in a county for many years, may be very familiar with the roads, and may take great pride in ensuring that the signs in the area for which he/she is responsible are in excellent condition. But some employees may not be as meticulous, and new or temporary employees may not feel as great a sense of pride and responsibility for maintaining the signs. This results in a lower work standard and poor sign replacement practices.
Retroreflectivity Measurement
There are currently two main methods to assess the retroreflectivity of a sign in the field. The first is a visual assessment as is being used by the North Carolina DOT. Visual inspection can be performed at night using a bright light and the human eye. The second method to assess retroreflectivity utilizes retroreflectometers, either hand-held or mobile. Neither of the two methods is completely accurate. The accuracy of visual assessment is questionable because different individuals may have varying visual observations of the same sign, even given the same set of inspection guidelines. The use of hand-held retroreflectometers can be time-consuming, often requiring up to four readings per color. Mobile retroreflectometers are still being developed and improved. “There are currently no traceable methods in the United States to determine the accuracy of retroreflectivity measurements because national calibration standards for retroreflectivity do not exist” (AASHTO 2000).
Mobile Measurement. The Federal Highway Administration has a prototype van able to measure sign retroreflectivity while moving at normal highway speeds. It is known as SMARTS, or Sign Management and Retroreflectivity Tracking System. The van uses a calibrated strobe lamp, mounted on its top, to bounce light off highway signs. The returned light is measured and processed by computer to account for observation angle. It is then compared to guidelines (Hatzi 2001).
Vans like this may be a common future method for evaluating signs, but they are not ready for widespread use. Using the FHWA van to measure multiple signs in a row is difficult because a successive sign closer than 200 feet falls beneath the tracking range distance. Also, the software is programmed to look for the brightest signs. This is not ideal because out of a group of signs the one needing replacement is the one missed. When left, right, and overhead signs are located at the same milepost, multiple passes would be required to measure all of them, which could prove to be very costly.
The cost per mile to run the FHWA van is unknown. The initial cost of the SMARTS van and all of the equipment and software was about $210,000. This does not include continuous maintenance and upgrades. This van is several years old and to reproduce the same van today would cost much more. Data validating the accuracy and repeatability of measurements recorded in the van are not yet available.
Hand-Held Measurement. Hand-held retroreflectometers are instruments capable of measuring the retroreflectivity of signs, that is, the amount of light reflected back to the driver. They range in weight up to around five pounds, although newer units are lighter. They can be transported easily in the field. Most available units are equipped with rechargeable batteries, some of which are able to be charged in as little as 15 minutes. Currently there are several models available with varying capabilities. The underlying function and principle behind each model is the same. When pointed at, or placed directly against a sign, the instrument emits a beam of light and measures the amount of reflected light returned from the sign’s sheeting. The unit can be operated by one person but may sometimes require an extension pole to reach tall signs. The operator must be positioned in front of a sign. Some models have to be placed directly on the sign being evaluated while others operate at ranges of around 50 to 100 feet from the sign.
standard is supplied by the manufacturer in a storage case that is rarely carried to the field where it may be altered by uncontrolled conditions. “Although the use of retroreflectometers is an objective measurement method, it can be expensive and time-consuming. As many as 60 measurements may be needed to evaluate the retroreflectivity of a large sign; frequently a lane of traffic must be closed to do so” (Long 1997).
Some units are capable of data collection, storage, and download. The storage capacity varies from unit to unit. Stored measurements can later be downloaded to a computer. However, the number of measurements held by the instrument is sometimes limited to a little more than 1000 for some models. If at least four measurements are taken per sign, then only about 250 signs can be measured before the data will need to be downloaded into a computer. Retroreflectometers cost up to $9,000, although this varies among manufacturers and models.
Comparison of Measurement Methods
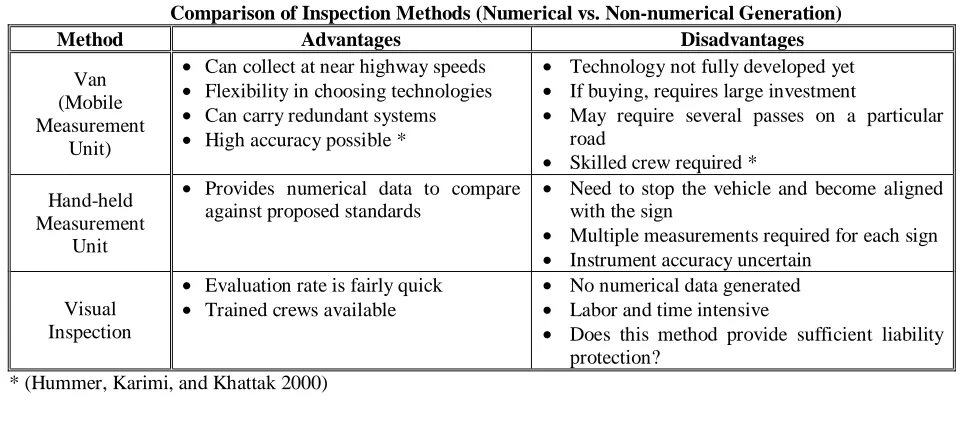
The previously-mentioned methods to inspect signs have advantages and disadvantages that are summarized in Table 1. The visual inspection method is efficient compared to the others and it can identify missing and vandalized signs. However, it does not generate numerical data about each sign (signs are evaluated either as currently acceptable or as needing attention such as replacement, repair, or cleaning). Finally, visual inspection is labor and time intensive and its reliability and accuracy are uncertain.
Hand-held retroreflectivity measurement units are capable of providing numerical data. However, state DOTs are concerned that measurements with hand-held units would be slow. The accuracy and reliability of these instruments are also questionable. “There can be significant variability among instruments measuring the same object, and the standards do not ensure the accuracy of the instruments” (NCHRP 2003). Currently, there are no national calibration standards for retroreflectivity, but NCHRP Project 5-16 is dedicated to this task (NCHRP 2003).
A mobile measurement van would be able to solve many of the problems a hand-held unit cannot, particularly faster measurement. However, vans are not yet ready to be relied on for commercial use. A mobile unit will be expensive regardless of whether it is assembled independently by the state or if a service is contracted to do the work.
In North Carolina, previous studies determined that there are approximately 1,000,000 in-place signs along state-maintained roads in North Carolina
(Kirtley and Rasdorf 2001, Palmquist and Rasdorf 2002). The North Carolina DOT does not believe that measuring all these signs using a hand-held unit is realistic because of the time required. According to a Washington State study (Lagergren 1987), a measurement rate of 10 signs per hour for ground mounted warning and stop signs located on the road shoulder was established when using the hand-held retroreflectometer. Based on this measurement rate, it would require 42,500 person-hours to measure the North Carolina DOT’s warning and stop signs.
QUANTITATIVE
EVALUATION
OF
THE
VISUAL
INSPECTION METHOD
The previous sections revealed that using retroreflectometers to measure the traffic signs along the state-maintained roads in North Carolina, either using a hand-held unit or a mobile measurement unit (van) appears infeasible and impractical. The visual inspection method currently being used in North Carolina apparently should continue to be used to evaluate sign conditions. However, the accuracy of the visual inspection method is questionable. As noted earlier, the human factor is critical when this method is used. Different observers will have different judgments about the condition of the sign being observed. Even the same observer might have different judgments on the same sign if it were evaluated several times during a short period, when the sign condition had no significant changes. There is a need to evaluate this visual inspection method while taking into considerations factors such as the observers’ accuracy in determining the signs’ conditions, the inspection frequency, and vandalism.
This section describes a quantitative evaluation of the visual inspection method. The model is based on data from the Washington State Department of Transportation Traffic Sign Retroreflectivity Measurements Using Human Observers study (Lagergren 1987).
Washington State Study
Figures 1 and 2 represent the primary results of the uncontrolled highway portion of the study using the data based on the median results of 17 observers’ ratings of 86 warning signs and 44 stop signs.
Sign sheeting type was not a factor during any portion of the study. This is congruent with North Carolina sign inspection practices because sign sheeting type is not considered during nighttime visual sign inspections, only whether the sign is sufficiently visible or not. The observers in the Washington State study rated the retroreflectivity of signs based on their visual judgments using a scale of 0 to 4. Table 2 lists each rating category, the corresponding coefficient of retroreflection (RA), which is described as “Specific Intensity per unit Area,” or SIA, and a description of the category. Any signs rated 0 or 1 would be replaced and signs receiving a rating of 2, 3, or 4 would remain in place. Although the observers in the study received only limited amounts of training the “inconsistency among observers was averaged in the median decision” (Lagergren 1987).
In Figure 1, of the 74% reported accuracy for warning signs, 50% was the correct decision not to replace a sign (correct negative) and 24% was the correct decision to replace a sign (correct positive). Of the 26% inaccuracy, 6% of the signs should have been replaced and were not (false negative) and 20% of the signs should not have been replaced and were (false positive). Thus the observers identified 44% of the signs as needing replacement (20% + 24%). Thirty percent of the warning signs, whether evaluated correctly by observers or not, were identified by a retroreflectometer as needing replacement. Thus, the observers erred on the safer side (44% vs. 30%).
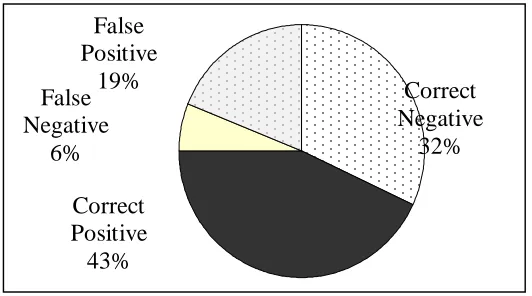
In Figure 2, of the 75% reported accuracy for stop signs, 32% was the correct decision not to replace a sign (correct negative) and 43% was the correct decision to replace a sign (correct positive). Of the 25% inaccuracy, 6% of the signs should have been replaced and were not (false negative) and 19% of the signs should not have been replaced and were (false positive). In this case the observers identified 62% of the signs as needing replacement (19% + 43%). A total of 49% of stop signs needed replacement as identified by a retroreflectometer, whether evaluated correctly by observers or not. Thus, as with warning signs these figures show a conservative approach taken by the observer (62% vs. 49%).
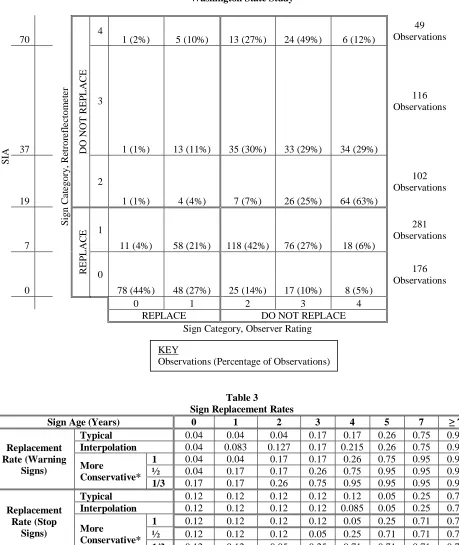
Figures 3 and 4 show the frequency distributions of the observer ratings for the warning and stop signs of the Washington State Study. The X-axis represents the sign observers’ ratings and the Y-axis represents the sign ratings as determined by a retroreflectometer. Each cell represents the number of signs and the percentage of signs corresponding to the sign observers’ ratings and the
sign ratings determined by a retroreflectometer. For example, cell (0, 0) indicates that of the 99 signs that were categorized into category 0 by the retroreflectometer, 87% were categorized into category 0 by the observers using the visual inspection method. The data in these two figures will be used in our analysis, described in the next section.
Figures 3 and 4 merit a few additional comments. The scale on the left is the SIA code indicating the retroreflectivity of the sign. SIA is correlated with sign age due to the fact that the signs toward the top of the scale are newer and those toward the bottom are older. The sign category (0, 1, 2, 3, 4) indicates the rating the sign received by the inspector, with ratings defined in Table 2. The small sample of observers in the Washington State Study limits the overall impact of the study's results. However, the Washington State Study was the only one available to use in our analysis.
Methodology
The methodology introduced here was developed to simulate the sign inspection and replacement process. The method has the following general assumptions:
• The inspectors in the agency of interest are as good as those in the Washington State study.
• In keeping with the fact that most signs installed on North Carolina public roads use engineer grade sheeting, we assume that a sign has a useful life of seven years, after which it will need replacing. This assumption is neither a stated standard nor a written North Carolina DOT policy. However, it is an appropriate conservative estimate for engineer grade sheeting, and the results from our analysis do not change greatly with moderate changes in that useful life.
• The maximum SIA (RA) value of a new engineer grade sign is 70 (as cited in the Washington State study) and it was assumed to decrease by 1/7 each year for seven years. Based on NCDOT data, this degradation assumption is very conservative considering that signs would most likely not degrade at a linear rate and would not be at an SIA value as low as 10 in year 7. However, this conservative assumption also accounts for signs that may degrade faster than anticipated due to weather or damage.
The analysis examined three key factors of an inspection program: inspection frequencies, replacement rates, and vandalism and knock-down rates. Three inspection frequencies were examined: each sign was inspected once a year, once every two years, or once every three years. These are frequencies currently used by the North Carolina DOT on various types of roadways. The replacement rates were determined based on the Washington State study: either inspectors would recommend sign replacement at the same rates as that study or more conservatively. Three different vandalism and knock-down rates were examined: no vandalism or knock downs, 5% of signs vandalized or knocked down per year, or 10% of signs vandalized or knocked-down per year. The North Carolina DOT believes that the five percent rate is appropriate for signs in urban areas while a 10% rate is appropriate for signs in rural areas. The different combinations of these factors were examined to determine their effects on the number of deficient signs (over seven years old) that would still be in place on the road.
Replacement Rate. Our analysis required a replacement rate by sign age. Some of these rates were easy to discern from the Washington State study data, which was based on warning signs and stop signs. For example, based on Figure 3, for warning signs with roughly an SIA value of 10 (which we assume to be about six years old), the replacement rate is about 20% + 55% = 75%. (Note that the value 10 does not explicitly appear on the scale, but it can be interpolated. It simply means that the sign is performing very poorly.) That is, the observer rated 20% of the signs as category 0 and 55% of the signs as category 1 meaning that they are to be replaced. Thus, the observer recommends replacing 75% of the signs that are six years old (with SIA of 7) but does not recommend replacing 25% (18% + 5% + 2%) of these signs. However, replacement rates for other sign ages were not as apparent from the data.
In the situation where the replacement rate could not be determined directly (for example, the replacement rate for warning signs with an SIA of approximately 50, which we assume to be two years old), two approaches were taken. The “typical rate” approach assumed that the replacement rate for signs at this specific age was the same as the replacement rate of the signs at the next- younger age for which there were available data. For example, the replacement rate for two-year old warning signs would be the same as the replacement rate for new warning signs (SIA = 70), which is 4% according to upper left part of Figure 3 (0% + 4%). The “interpolation” approach used a linear interpolation from the replacement rates of signs at the next-younger and next-older ages for which there were data. For example, the replacement rate for one-year old warnings signs (SIA=60) could be interpolated from the replacement rates of new (SIA=70) and three-year old (SIA=37) signs as (4% +
0%) + {[(15% + 2%) – (4% + 0%)]/3} = 8.33%. That is, the replacement rate for new signs (0 years old) is (4% + 0%) = 4% and the replacement rate for three-year old signs (use the data for SIA=37) is (15% + 2%) = 17%. Interpolate one third of the way from 4% to 17% to find the one-year old sign replacement rate.
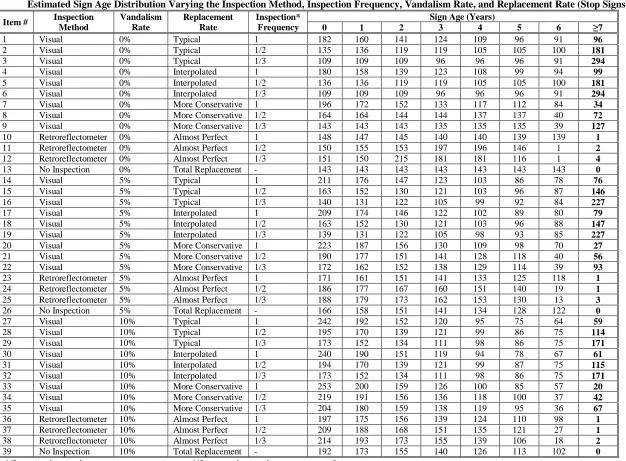
In addition, more conservative replacements were also examined. The “more conservative” replacement rates were based on the typical replacement rates, but assumed that inspectors were trained to look ahead several years and order sign replacement when they thought a sign would need to be replaced near the time of their next visit. More specifically, for the inspection frequency of once every year, the typical replacement rates were moved up one year to obtain the more conservative replacement rates. If the inspection frequency is once every two years, the typical replacement rates were moved up two years to obtain the more conservative replacement rates. If the inspection frequency is once every three years, the typical replacement rates were moved up three years to obtain the more conservative replacement rates. The more conservative replacement rates are illustrated in Table 3.
An example showing how these conservative replacement rates work follows. In Table 3, the “typical” replacement rate for three-year old signs is 0.17 (top row column 4). If we are instructing our inspectors to be conservative by one year they will reject two-year old signs at the same rate as they “typically” rejected three-year old signs, 0.17, as the third row (column 3) of Table 3 shows. If we are instructing our inspectors to be conservative by two years they will reject one-year old signs at the same rate as they “typically” rejected three-year old signs, 0.17, as the fourth row (column 2) of Table 3 shows. If we are instructing our inspectors to be conservative by three years they will reject new signs at the same rate as they “typically” rejected three-year old signs, 0.17, as the fifth row (column 1) of Table 3 shows.
In Table 4, each row represents the results at the end of that year’s sign inspection cycle. Note that Table 4 is one continuous spreadsheet illustrated in 3 parts. The rows extend over a total of 56 columns from column A to BD. Column A with the heading of “Year” indicates the year the data represents. The first group of columns (B - J) under the heading of “In place signs” represents the sign age distribution at the end of that year. Except the first year, the values in this group of columns depend on the inspection, replacement, and vandalism activities in the previous year. For example, the first row indicates that by the end of year 1, there are 143 new signs, 143 one-year old signs, etc., according to the assumption of a uniform age distribution to begin the simulation. The second row indicates the sign age distribution by the end of year 2. By the end of year 2, the number of new signs is 406, which equals the total number of signs replaced due to the year 1 inspection procedure (6 + 6 + 24 + 24 + 37 + 107+ 136 + 0 = 340 signs) plus the number of signs replaced due to vandalism in the first year (66 signs). By the end of year 2, the number of one-year old signs is 123, which equals the total number of the new signs that were either not inspected (0 signs) or not replaced (137 signs) in year 1 minus the number of new signs vandalized in year 1 (14 signs).
The second group of columns (K - S) under the heading of “Inspected signs” represents the number of signs of different ages being inspected during the inspection procedure, which was assumed to happen at the end of year 1. The values in these columns are dependent on the number of in-place signs and the inspection frequency. For example, there are 143 new signs in year 1 and the inspection frequency is once per year. In other words, all these 143 new signs will be inspected and therefore, the number of inspected new signs is 143. The third group of columns (U - AC) under the heading of “Not Inspected signs” represents the number of signs that are not inspected in that specific year. The values are obtained by subtracting the number of signs inspected in that year from the number of in-place signs in that year grouped by the sign age. Since the inspection frequency is once per year in this example, all signs will be inspected and there are zeroes in all cells of this group of columns. The fourth group of columns (AD - AK) under the heading of “Replaced signs” represents the number of signs that are replaced due to the inspection and replacement procedure in that specific year, grouped by age. The values depend on the number of signs and the corresponding replacement rate. For example, for a new sign, the replacement rate is 0.04 and there are 143 new signs in year 1. Therefore, six (143 * 0.04) new signs were replaced due to the inspection and replacement procedure in year 1.
The fifth group of columns (AM - AT) under the heading of “Not replaced signs” represents the number of signs that are not replaced as a result of that year’s inspection and replacement procedure. The values are obtained by subtracting the number of “Replaced signs” from the number of “In place signs” of the corresponding sign ages.
Column AU, under the heading of “Not inspected or not replaced,” represents the total number of signs that are either not inspected or not replaced during the specific year’s inspection and replacement procedure.
The final group of columns (AV - BD) under the heading of “Vandalized signs” represents the number of signs replaced due to vandalism, knockdown, or similar causes unrelated to the sign inspection program, from among those signs that were “Not inspected or not replaced,” again grouped by sign age. The values are obtained by applying the vandalism rate to the corresponding “Not inspected or not replaced” signs. For example, in year 1 there are 137 new signs that are either not inspected (0) or not replaced (137) during the sign inspection and replacement procedure. With a vandalism rate of 10%, the number of vandalized new signs is 14 after rounding up (137 * 10% = 13.7). Note that with a 0% vandalism rate, the number of new signs in year n is the number of signs replaced due to the year n-1 sign inspection and replacement procedure. If the vandalism rate is greater than 0%, the number of new signs in year n includes the number of signs replaced due to the year n-1 inspection and replacement procedure and the signs vandalized in year n-1. The simulation logic is provided mathematically below for those readers interested in replicating the calculation.
• Given the number of years between inspections, ybi;
• Given the proportion of signs vandalized in a year, pv;
• Given the proportion of signs of a given age, a, that inspectors will recommend to be replaced, RRa (a “replacement rate” from Table 3);
and
• Given a beginning distribution of in-place signs, P, in year y, by age, or a set of Py,a:
1. Compute the number of signs of age a to be inspected in year y, Iy,a = Py,a /
ybi;
2. Compute the number of signs of age a not to be inspected in year y, NIy,a =
Py,a – Iy,a;
3. Compute the number of signs of age a to be replaced in year y, Ry,a = Iy,a *
4. Compute the number of signs of age a not to be replaced in year y, NRy,a =
Py,a – Ry,a;
5. Compute the number of signs of age a vandalized in year y, Vy,a = NRy,a *
pv;
6. Compute the number of new signs in year y+1, Py+1,0
= ∑ Ry,a + ∑ Vy,a;
7. Compute the number of signs of ages one year and older, Py+1,a (where a ≥
1)
= NIy,a-1 + NRy,a-1 – Vy,a-1; and
8. Return to Step 1 and repeat the computation for the next year, y + 1. Keep repeating the computation until the simulation stabilizes, which is to say that Py,a≈ Py+1,a
SIMULATION RESULTS
After the simulation program was developed, several different combinations of the replacement rates, inspection frequencies, and vandalism rates were run in the program for both warning signs and stop signs. All cases assumed a sign sample of 1000 and, as noted above, started with a uniform distribution of sign ages, although that did not matter in the final results since we simulated a long enough time period for the system to stabilize.
The simulation program was applied to the hand-held retroreflectometer method for comparison and evaluation purposes. When using a hand-held retroreflectometer to measure the retroreflectivity of a sign, an almost perfect performance was assumed. In other words, it was assumed that the retroreflectometer could provide the operator with enough information to make a correct decision on replacement 99% of the time. The decision to replace a sign or not was made based on the sign age and the inspection frequency. For example, if the inspection frequency is once every two years, signs at ages of five years, six years, and seven years or older would be replaced 99% of the time. Signs at age of five years would be replaced even though these signs could last another year to make sure they would not stay in field while running out of their useful life before the next inspection.
To round out the field of contending inspection and replacement strategies, we analyzed a “total replacement” approach as well. This idealized situation assumed no inspection; each sign was simply replaced in the seventh year since the previous mass installation.
Table 5 provides simulation results for warning signs, and Table 6 provides results for stop signs. The simulation results are useful to evaluate the various
sign inspection and replacement options. The focus is on the safety risk and the cost associated with each inspection program. The safety risk is dependent on the number of grossly deficient signs in place on the roads (assumed to be signs seven years or older in this study). Generally, the more of these signs there are in the field, the higher the safety risk. The cost includes the sign replacement cost and the sign inspection cost. The cost information used in this study is from sign inventory research sponsored by the North Carolina DOT (Vereen, Hummer, and Rasdorf 2002). The sign replacement cost for warning and stop signs is $30.00/sign. The sign inspection cost of the visual inspection method is $0.17/sign based on the previous research. The inspection cost for the hand-held retroreflectometer method is estimated to be $2.33/sign when taking into consideration the labor costs (including salaries and benefits), travel costs, vehicle costs, and equipment cost (retroreflectometer). Table 7 summarizes the cost and the safety risk associated with each inspection method examined for warning signs.
Observations
Tables 5-7 provide several useful insights. Under the same conditions (inspection method, vandalism rate, replacement rate), the higher the inspection frequency, the higher the number of signs replaced every year, and the lower the number of signs that do not meet the requirements. In other words, the higher the inspection frequency, the higher the cost to inspect and replace signs, but the lower the safety risk. In addition, it is noted that that with typical or interpolated visual inspection methods, the number of deficient signs is very high, and maybe unacceptable, with every other year or every third year inspection.
For all cases, the majority of the cost comes from the replacement cost since the unit replacement cost is $30.00/sign while the unit cost of inspection is only $0.17/sign for the visual inspection method and $2.33/sign for the hand-held retroreflectometer method. It is also obvious that the difference in inspection costs is important. Using the same example as in the previous paragraph, item 33 in Table 7 shows that the more conservative visual inspection method calls for replacement of many more signs than the retroreflectometer (item 36) to produce the same number of deficient signs (one per 1000). However, the greater inspection costs for the retroreflectometer give it a higher overall cost than the more conservative visual inspection method. Ways to make retroreflectometer use faster without sacrificing reliability would be helpful to the DOTs.
With the assumptions that were made, the total replacement approach turns out to be attractive when taking into consideration the cost and the number of deficient signs. When using the total replacement approach, the number of signs that do not meet the requirements is always 0, and the total program costs are among the lowest we analyzed. However, in the real world where signs are not automatically deficient after seven years and DOTs cannot count on finding vandalized and knocked-down signs without regular inspections, the total replacement approach may not be realistic.
CONCLUSION
Organizations might have different goals in sign inventory and management. For example, some organizations might seek methods to minimize the cost while tolerating a relatively large number of signs that do not meet the retroreflectivity requirements. Some organizations might seek methods to minimize the number of signs that do not meet retroreflectivity requirements while tolerating a relatively high cost. Still other organizations might seek methods to obtain a balance, i.e., both the number of signs that do not meet the requirements and the cost are reasonable. The simple spreadsheet simulation program described in this paper appears to be a way for agencies to explore those trade-offs and arrive at informed decisions on their sign inspection and replacement efforts.
For agencies that generally conform to the key assumptions made to build the spreadsheet (such as uniformly decaying signs that become deficient after seven years in the field, inspectors with error rates similar to the Washington State study (Lagergren 1987), and virtually flawless inspections with retroreflectometers), the results in Tables 5-7 are directly applicable. Those agencies should consider replacing all signs every seven years, as that insures that at a relatively low cost no aged signs are in place, subject to the key
realism checks mentioned above. If total replacement is not possible, an inspection program using retroreflectometers every three years appears very cost competitive with a program using “typical” visual inspection rates each year at either 5 or 10% vandalism rates. The retroreflectometers appear to allow fewer deficient signs, while the “typical” visual inspection program costs are lower for a given vandalism rate. “More conservative” sign replacement rates do not appear to offer distinct advantages, while “typical” replacement rates with inspections every two or three years allow relatively high numbers of deficient signs to remain on the roads.
For other agencies, they can easily change the parameters of the simulation program to different values than those used in this study. For example, if their documented vandalism rate differs from the one we used they can simply change that one parameter and retain the use of the program to generate new values for sign replacement rates. Among the parameters that can be changed to allow a wider range of applicability of the method are the following.
• Replacement of the simple linear sign deterioration function by age with a more sophisticated function,
• Changing the overall duration of the determination cycle,
• Addition of other grades of sheeting,
• Addition of data on inspector performance from other DOTs,
• Addition of other sign colors, and
• Addition of data on the error rates from retroreflectometers.
The authors plan to pursue research along several of these lines in the near future. As more of these parameters are validated for individual uses over time the sign inspection and replacement simulation program will become an increasingly powerful tool helping DOTs save lives and money.
ACKNOWLEDGEMENTS
REFERENCES
AASHTO, Retroreflectivity Policy Resolution, Minimum Levels of Retroreflectivity for Signs, December 9, 2000.
Congressional Information Service, Inc. “Crashes By Relation to Junction, Traffic Control Devices, and Crash Severity.” Traffic Safety Facts, 1999. Hasson, P. Retroreflectivity: An Essential Tool for Improving Visibility.
http://mrc.fhwa.dot.gov/articles/ksart2.htm, U. S. Department of Transportation, Federal Highway Administration, Midwest Resource Center, 1999.
Hatzi, P., “Retroreflectivity ‘Right Back At You!’” U. S. Department of Transportation, Federal Highway Admin., http://www.library.unt.edu/gpo/OTA/featproj/fp_te29.html, June 30, 2001.
Hummer, J., A. H. Karimi, and A. Khattak. Collection and Presentation of Roadway and Inventory Data. NCHRP Report 437, Transportation Research Board, National Academy Press, Washing, D.C., 2000.
Institute of Transportation Engineers. Traffic Signing Handbook, Institute of Transportation Engineers, Washington, D.C., Chapter 2, (1997): 23 - 44. Kirtley, N. and W. Rasdorf. North Carolina Sign Count Study #1 Primary
Roads. North Carolina State University, 2001.
Lagergren, A. E. Traffic Sign Retroreflectivity Measurements Using Human Observers. Washington State Department of Transportation, WA-RD 140.1, December, 1987.
Long, D. “Michigan DOT Reflects on Signs.” TR News, 192, September/October (1997): 24 - 25.
McGee, W. H. and A. J. Paniati. An Implementation Guide for Minimum Retroreflectivity Requirements for Traffic Signs. USDOT, FHWA Research and Development, McLean, VA, 1998.
McGee, W. H. and S. Taori. “Impacts on State and Local Agencies for Maintaining Traffic Signs Within Minimum Retorreflectivity Guidelines.” BMI, Vienna, VA, 1998.
National Cooperative Highway Research Program (NCHRP), Project 5-16.
National Calibration Standards for Measuring Retroreflectivity, http://www4.nationalacademies.org/, last modified April 19, 2000, accessed May, 2003.
Palmquist, M. and W. Rasdorf. North Carolina Sign Count Study #2 Secondary Roads. North Carolina State University, Raleigh, NC, 2002.
Table 1
Comparison of Inspection Methods (Numerical vs. Non-numerical Generation)
Method Advantages Disadvantages
Van (Mobile Measurement
Unit)
• Can collect at near highway speeds
• Flexibility in choosing technologies
• Can carry redundant systems
• High accuracy possible *
• Technology not fully developed yet
• If buying, requires large investment
• May require several passes on a particular road
• Skilled crew required * Hand-held
Measurement Unit
• Provides numerical data to compare against proposed standards
• Need to stop the vehicle and become aligned with the sign
• Multiple measurements required for each sign
• Instrument accuracy uncertain Visual
Inspection
• Evaluation rate is fairly quick
• Trained crews available
• No numerical data generated
• Labor and time intensive
• Does this method provide sufficient liability protection?
* (Hummer, Karimi, and Khattak 2000)
Table 2
Sign Ratings - Washington State Study
Rating Corresponding SIA
Value (cd/sf/fc)* Description
0 0-7 Worst retroreflectivity
1 7-19 Low retroreflectivity or other defect, sign ready for replacement
2 19-37 Adequate retroreflectivity, looks okay, some defects but does not need replacement
3 37-70 Good retroreflectivity
4 >70 Brand new sign
* cd/sf/fc represents candelas per foot-candle per square foot
Figure 1
Decision Percentages for Warning Signs - Washington State Study
Figure 2
Decision Percentages for Stop Signs - Washington State Study
False
Positive
20%
False
Negative
6%
Correct
Positive
24%
Correct
Negative
Figure 3
Frequency Distribution of Observer Ratings for Warning Signs Washington State Study
70 4 0 (0%) 2 (4%) 6 (12%) 23 (45%) 20 (39%)
51 Observations
37
3
18 (2%) 124 (15%) 314 (39%) 263 (32%) 97 (12%)
816 Observations
19
D
O
N
O
T
R
E
P
L
A
C
E
2
5 (2%) 63 (24%) 125 (47%) 57 (21%) 16 (6%)
266 Observations
7
1
39 (20%) 110 (55%) 36 (18%) 10 (5%) 3 (2%)
198 Observations
S
IA
0
S
ig
n
C
a
te
g
o
ry
,
R
et
ro
re
fl
e
ct
o
m
e
te
r
R
E
P
L
A
C
E
0
86 (87%) 8 (8%) 4 (4%) 1 (1%) 0 (0%)
99 Observations
0 1 2 3 4
REPLACE DO NOT REPLACE
Sign Category, Observer Rating
False
Positive
19%
False
Negative
6%
Correct
Positive
43%
Correct
Negative
32%
KEY
Figure 4
Frequency Distribution of Observer Ratings for Stop Signs Washington State Study
70 4 1 (2%) 5 (10%) 13 (27%) 24 (49%) 6 (12%)
49 Observations
37
3
1 (1%) 13 (11%) 35 (30%) 33 (29%) 34 (29%)
116 Observations
19
D
O
N
O
T
R
E
P
L
A
C
E
2
1 (1%) 4 (4%) 7 (7%) 26 (25%) 64 (63%)
102 Observations
7
1
11 (4%) 58 (21%) 118 (42%) 76 (27%) 18 (6%)
281 Observations
S
IA
0
S
ig
n
C
a
te
g
o
ry
,
R
et
ro
re
fl
e
ct
o
m
e
te
r
R
E
P
L
A
C
E
0
78 (44%) 48 (27%) 25 (14%) 17 (10%) 8 (5%)
176 Observations
0 1 2 3 4
REPLACE DO NOT REPLACE
Sign Category, Observer Rating
Table 3
Sign Replacement Rates
Sign Age (Years) 0 1 2 3 4 5 7 ≥ 7
Typical 0.04 0.04 0.04 0.17 0.17 0.26 0.75 0.95
Interpolation 0.04 0.083 0.127 0.17 0.215 0.26 0.75 0.95
1 0.04 0.04 0.17 0.17 0.26 0.75 0.95 0.95
½ 0.04 0.17 0.17 0.26 0.75 0.95 0.95 0.95
Replacement Rate (Warning
Signs) More
Conservative*
1/3 0.17 0.17 0.26 0.75 0.95 0.95 0.95 0.95
Typical 0.12 0.12 0.12 0.12 0.12 0.05 0.25 0.71
Interpolation 0.12 0.12 0.12 0.12 0.085 0.05 0.25 0.71
1 0.12 0.12 0.12 0.12 0.05 0.25 0.71 0.71
½ 0.12 0.12 0.12 0.05 0.25 0.71 0.71 0.71
Replacement Rate (Stop
Signs) More
Conservative*
1/3 0.12 0.12 0.05 0.25 0.71 0.71 0.71 0.71
* The “more conservative” replacement rates are dependent on the inspection frequency as illustrated. 1/2 means signs inspected every other year
1.3 means signs inspected every third year
Table 4
KEY
Sample Data in the Simulation Program, Inspecting All Warning Signs Conservatively Every Year and Assuming 10% Vandalism Per Year
A B C D E F G H I J K L M N O P Q R S
In place signs Inspected signs
Year 0yr old 1yr old 2yr old 3yr old 4yr old 5yr old 6yr old ≥ 7yr old Total 0yr old 1yr old 2yr old 3yr old 4yr old 5yr old 6yr old ≥ 7yr old Total
1 143 143 143 143 143 143 143 0 1000 143 143 143 143 143 143 143 0 1000
2 406 123 123 107 107 95 32 6 1000 406 123 123 107 107 95 32 6 1000
3 276 351 107 92 80 71 21 2 1000 276 351 107 92 80 71 21 2 1000
(Continued)
T U V W X Y Z AA AB AC AD AE AF AG AH AI AJ AK
Not Inspected signs Replaced signs
Year 0yr old 1yr old 2yr old 3yr old 4yr old 5yr old 6yr old ≥ 7yr old Total 0yr old 1yr old 2yr old 3yr old 4yr old 5yr old 6yr old ≥ 7yr old
1 0 0 0 0 0 0 0 0 0 6 6 24 24 37 107 136 0
2 0 0 0 0 0 0 0 0 0 16 5 21 18 28 71 31 6
3 0 0 0 0 0 0 0 0 0 11 14 18 16 21 53 20 2
(Continued)
AL AM AN AO AP AQ AR AS AT AU AV AW AX AY AZ BA BB BC BD
Not replaced signs Vandalized signs
Year 0yr old 1yr old 2yr old 3yr old 4yr old 5yr old 6yr old ≥ 7yr old Not inspected or not replaced 0yr old 1yr old 2yr old 3yr old 4yr old 5yr old 6yr old ≥ 7yr old Total
1 137 137 119 119 106 36 7 0 660 14 14 12 12 11 3.6 0.7 0 66
2 390 118 102 89 79 24 2 0 804 39 12 10 8.9 7.9 2.4 0.2 0.03 80.4
T
able 5Estimated Sign Age Distribution Varying the Inspection Method, Inspection Frequency, Vandalism Rate, and Replacement Rate (Warning Signs)
Sign Age (Years) Item # Inspection Method Vandalism
Rate Replacement Rate
Inspection*
Frequency 0 1 2 3 4 5 6 ≥7
1 Visual 0% Typical 1 176 169 162 156 129 107 79 21
2 Visual 0% Typical 1/2 148 148 142 142 118 118 87 96
3 Visual 0% Typical 1/3 123 124 124 118 118 118 87 187
4 Visual 0% Interpolated 1 192 184 169 147 122 96 71 19
5 Visual 0% Interpolated 1/2 153 153 140 140 116 116 86 95
6 Visual 0% Interpolated 1/3 129 129 132 115 115 114 84 180
7 Visual 0% More Conservative 1 205 197 189 157 130 96 24 1
8 Visual 0% More Conservative 1/2 202 202 168 168 124 124 6 7
9 Visual 0% More Conservative 1/3 187 187 188 139 139 138 7 15
10 Retroreflectometer 0% Almost Perfect 1 148 148 147 145 140 140 139 1
11 Retroreflectometer 0% Almost Perfect 1/2 150 155 153 197 196 146 1 2
12 Retroreflectometer 0% Almost Perfect 1/3 151 150 215 181 181 116 1 4
13 No Inspection 0% Total Replacement - 143 143 143 143 143 143 143 0
14 Visual 5% Typical 1 201 183 167 152 120 95 66 17
15 Visual 5% Typical 1/2 173 163 150 141 115 106 78 74
16 Visual 5% Typical 1/3 151 143 136 125 116 108 81 140
17 Visual 5% Interpolated 1 217 198 172 143 113 84 59 15
18 Visual 5% Interpolated 1/2 179 169 149 139 112 103 76 72
19 Visual 5% Interpolated 1/3 159 150 141 121 112 104 78 134
20 Visual 5% More Conservative 1 229 209 190 150 118 83 20 1
21 Visual 5% More Conservative 1/2 226 213 172 160 117 99 8 5
22 Visual 5% More Conservative 1/3 216 203 190 140 124 108 8 11
23 Retroreflectometer 5% Almost Perfect 1 171 161 151 141 133 125 118 1
24 Retroreflectometer 5% Almost Perfect 1/2 186 177 167 160 151 140 19 1
25 Retroreflectometer 5% Almost Perfect 1/3 188 179 173 161 153 130 13 3
26 No Inspection 5% Total Replacement - 166 158 151 141 134 128 122 0
27 Visual 10% Typical 1 228 197 170 147 110 82 55 13
28 Visual 10% Typical 1/2 201 179 156 139 109 93 68 55
29 Visual 10% Typical 1/3 182 163 145 127 111 97 72 102
30 Visual 10% Interpolated 1 244 211 174 137 102 72 48 11
31 Visual 10% Interpolated 1/2 208 185 156 136 106 90 65 54
32 Visual 10% Interpolated 1/3 189 169 150 124 108 93 69 98
33 Visual 10% More Conservative 1 255 220 190 142 106 71 16 1
34 Visual 10% More Conservative 1/2 252 225 174 151 107 79 9 4
35 Visual 10% More Conservative 1/3 246 217 190 137 110 83 8 8
36 Retroreflectometer 10% Almost Perfect 1 197 175 156 139 124 110 98 1
37 Retroreflectometer 10% Almost Perfect 1/2 209 188 168 151 135 121 27 1
38 Retroreflectometer 10% Almost Perfect 1/3 214 193 173 155 139 106 18 2
39 No Inspection 10% Total Replacement - 192 173 155 140 126 113 102 0
Table 6
Estimated Sign Age Distribution Varying the Inspection Method, Inspection Frequency, Vandalism Rate, and Replacement Rate (Stop Signs)
Sign Age (Years) Item # Inspection
Method
Vandalism Rate
Replacement Rate
Inspection*
Frequency 0 1 2 3 4 5 6 ≥7
1 Visual 0% Typical 1 182 160 141 124 109 96 91 96
2 Visual 0% Typical 1/2 135 136 119 119 105 105 100 181
3 Visual 0% Typical 1/3 109 109 109 96 96 96 91 294
4 Visual 0% Interpolated 1 180 158 139 123 108 99 94 99
5 Visual 0% Interpolated 1/2 136 136 119 119 105 105 100 181
6 Visual 0% Interpolated 1/3 109 109 109 96 96 96 91 294
7 Visual 0% More Conservative 1 196 172 152 133 117 112 84 34
8 Visual 0% More Conservative 1/2 164 164 144 144 137 137 40 72
9 Visual 0% More Conservative 1/3 143 143 143 135 135 135 39 127
10 Retroreflectometer 0% Almost Perfect 1 148 147 145 140 140 139 139 1
11 Retroreflectometer 0% Almost Perfect 1/2 150 155 153 197 196 146 1 2
12 Retroreflectometer 0% Almost Perfect 1/3 151 150 215 181 181 116 1 4
13 No Inspection 0% Total Replacement - 143 143 143 143 143 143 143 0
14 Visual 5% Typical 1 211 176 147 123 103 86 78 76
15 Visual 5% Typical 1/2 163 152 130 121 103 96 87 146
16 Visual 5% Typical 1/3 140 131 122 105 99 92 84 227
17 Visual 5% Interpolated 1 209 174 146 122 102 89 80 79
18 Visual 5% Interpolated 1/2 163 152 130 121 103 96 88 147
19 Visual 5% Interpolated 1/3 139 131 122 105 98 93 85 227
20 Visual 5% More Conservative 1 223 187 156 130 109 98 70 27
21 Visual 5% More Conservative 1/2 190 177 151 141 128 118 40 56
22 Visual 5% More Conservative 1/3 172 162 152 138 129 114 39 93
23 Retroreflectometer 5% Almost Perfect 1 171 161 151 141 133 125 118 1
24 Retroreflectometer 5% Almost Perfect 1/2 186 177 167 160 151 140 19 1
25 Retroreflectometer 5% Almost Perfect 1/3 188 179 173 162 153 130 13 3
26 No Inspection 5% Total Replacement - 166 158 151 141 134 128 122 0
27 Visual 10% Typical 1 242 192 152 120 95 75 64 59
28 Visual 10% Typical 1/2 195 170 139 121 99 86 75 114
29 Visual 10% Typical 1/3 173 152 134 111 98 86 75 171
30 Visual 10% Interpolated 1 240 190 151 119 94 78 67 61
31 Visual 10% Interpolated 1/2 194 170 139 121 99 87 75 115
32 Visual 10% Interpolated 1/3 173 152 134 111 98 86 75 171
33 Visual 10% More Conservative 1 253 200 159 126 100 85 57 20
34 Visual 10% More Conservative 1/2 219 191 156 136 118 100 37 42
35 Visual 10% More Conservative 1/3 204 180 159 138 119 95 36 67
36 Retroreflectometer 10% Almost Perfect 1 197 175 156 139 124 110 98 1
37 Retroreflectometer 10% Almost Perfect 1/2 209 188 168 151 135 121 27 1 38 Retroreflectometer 10% Almost Perfect 1/3 214 193 173 155 139 106 18 2
39 No Inspection 10% Total Replacement - 192 173 155 140 126 113 102 0
Table 7
Cost and Safety Risk Analysis (Warning Signs)
Item # Inspection Method Vandalism Rate
Replacement Rate
Inspection* Frequency
≥ 7yr Signs
Signs Inspected Every Year
Inspectio n Cost ($)
Signs Replaced Every Year
Replacemen t Cost ($)
Total Cost ($)
1 Visual 0% Typical 1 21 1000 170 176 5280 5450
2 Visual 0% Typical 1/2 96 500 85 148 4440 4525
3 Visual 0% Typical 1/3 187 333 57 123 3690 3746
4 Visual 0% Interpolated 1 19 1000 170 192 5760 5930
5 Visual 0% Interpolated 1/2 95 500 85 153 4590 4675
6 Visual 0% Interpolated 1/3 180 333 57 129 3870 3927
7 Visual 0% More Conservative 1 1 1000 170 205 6150 6320
8 Visual 0% More Conservative 1/2 7 500 85 202 6060 6145
9 Visual 0% More Conservative 1/3 15 333 57 187 5610 5667
10 Retroreflectometer 0% Almost Perfect 1 1 1000 2330 148 4440 6770
11 Retroreflectometer 0% Almost Perfect 1/2 2 500 1165 150 4500 5665
12 Retroreflectometer 0% Almost Perfect 1/3 4 333 776 151 4530 5307
13 No Inspection 0% Total Replacement - 0 0 0 143 4290 4290
14 Visual 5% Typical 1 17 1000 170 201 6030 6200
15 Visual 5% Typical 1/2 74 500 85 173 5190 5275
16 Visual 5% Typical 1/3 140 333 57 151 4530 4587
17 Visual 5% Interpolated 1 15 1000 170 217 6510 6680
18 Visual 5% Interpolated 1/2 72 500 85 179 5370 5455
19 Visual 5% Interpolated 1/3 134 333 57 159 4770 4827
20 Visual 5% More Conservative 1 1 1000 170 229 6870 7040
21 Visual 5% More Conservative 1/2 5 500 85 226 6780 6865
22 Visual 5% More Conservative 1/3 11 333 57 216 6480 6537
23 Retroreflectometer 5% Almost Perfect 1 1 1000 2330 171 5130 7460
24 Retroreflectometer 5% Almost Perfect 1/2 1 500 1165 186 5580 6745
25 Retroreflectometer 5% Almost Perfect 1/3 3 333 777 188 5640 6417
26 No Inspection 5% Total Replacement - 0 0 0 166 4980 4980
27 Visual 10% Typical 1 13 1000 170 228 6840 7010
28 Visual 10% Typical 1/2 55 500 85 201 6030 6115
29 Visual 10% Typical 1/3 102 333 57 182 5460 5517
30 Visual 10% Interpolated 1 11 1000 170 244 7320 7490
31 Visual 10% Interpolated 1/2 54 500 85 208 6240 6325
32 Visual 10% Interpolated 1/3 98 333 57 189 5670 5727
33 Visual 10% More Conservative 1 1 1000 170 255 7650 7820
34 Visual 10% More Conservative 1/2 4 500 85 252 7560 7645
35 Visual 10% More Conservative 1/3 8 333 57 246 7380 7437
36 Retroreflectometer 10% Almost Perfect 1 1 1000 2330 197 5910 8240
37 Retroreflectometer 10% Almost Perfect 1/2 1 500 1165 209 6270 7435
38 Retroreflectometer 10% Almost Perfect 1/3 2 333 777 214 6420 7197
39 No Inspection 10% Total Replacement - 0 0 0 192 5760 5760