Low Specific Absorption Rate Antenna Using Electromagnetic Band
Gap Structure for Long Term Evolution Band 3 Application
Mahesh Munde*, Anil Nandgaonkar, and Shankar Deosarkar
Abstract—With the progress of technologies though the years, the extent of electromagnetic radiations has increased in our environment, so there are increased concerns about health for wireless device users. It has become a necessity to use devices with low Specific Absorption Rate (SAR) to reduce human exposure to the effects of Electromagnetic Fields (EM fields). In this article, the design of a circular microstrip antenna (CMSA) with and without an electromagnetic band gap (EBG) structure is proposed. It is evident from simulated results that CMSA with EBG gives low SAR as compared to CMSA without EBG for the proposed prototype. M-shaped unit cell structure of EBG is designed for 1812 MHz resonance frequency, and a bandwidth of 244 MHz is achieved using CMSA with EBG for LTE Band 3. SAR is reduced by 76.25% when CMSA is used with EBG in comparison to CMSA without EBG.
1. INTRODUCTION
Antennas designed for wireless communication like the ones used in mobile handsets, wearable devices, and Wi-Fi devices are used in closeness to humans. The EM waves absorbed by human body have become a vital issue as health concerns due to their increasing effects. The International Commission for Non-ionizing Radiation Protection (ICNIRP) has specified guidelines for exposure of humans by time-varying fields up to 300 GHz, in view of its adverse effects. Government organizations all over the globe strictly limit the exposure of humans to non-ionizing radiations (NIR). Due to extensive use of radio frequency devices, radiations that come under NIR category have been rapidly given increased attention [1]. Radiation is evaluated by SAR. SAR represents the time rate of microwave energy absorbed inside the human tissue and is represented by the following equation
SAR = σ
2ρE
2 (1)
whereσis the conductivity of tissue in S/m,ρthe density of tissue in kg/m3, andE the internal induced electric field in V/m [2]. There are numerous challenges in RF communication pertaining to antenna design for the hand-held devices which are used in closeness to the human beings. Several techniques are discussed in various findings to reduce SAR:
a) Auxiliary elements: In this technique reflectors are used along with the main antenna structure to reduce SAR. The limitation of this method is that it requires a different antenna element to act as a reflector which increases size and cost of the antenna [3].
b) Ferrite loading: In this method ferrite sheets are used behind the antenna to minimize surface waves in backward direction. With this method, SAR can be reduced up to 47.68%. The limitation of this method is that the ferrite sheets used require special properties that are related to permittivity () and permeability (μ) [4].
Received 21 October 2018, Accepted 16 January 2019, Scheduled 1 April 2019 * Corresponding author: Mahesh Munde ([email protected]).
c) Metamaterials: These are the materials having special resonance characteristics which produce negative permittivity or negative permeability, or both. Hence SAR can be reduced by this method up to 42.12% [4].
d) Artificial magnetic conductors (AMC) and EBG: Surfaces having high impedance are used to trap energy from surface waves. These structures incorporate typical metallic patterns that absorb surface waves to reduce SAR value [5, 6].
Out of many, a reliable solution is to design an efficient low-profile antenna with adequate gain. Surface waves must be minimized to reduce SAR. EBG has given a promising solution to the above quoted problem since EBG structures assist or prevent the propagation of EM waves in particular band of frequencies for the entire range of incident angles and all polarization conditions [9] depending on the placement of EBG structure. Many solutions have been proposed in available findings so far, to counter the effect of EM radiation on humans, but most suitable solutions reduce SAR to minimize the effect. When incident waves are surface waves and are purely imaginary, the EBG structure shows a stopband, through which surface waves cannot propagate for any angles of incidence and polarization states. When the incident wave is a plane wave and has real value number, the phase of reflection of EBG structure varies with frequency, and at certain frequency it becomes zero degree [7–9].
2. ANTENNA GEOMETRY
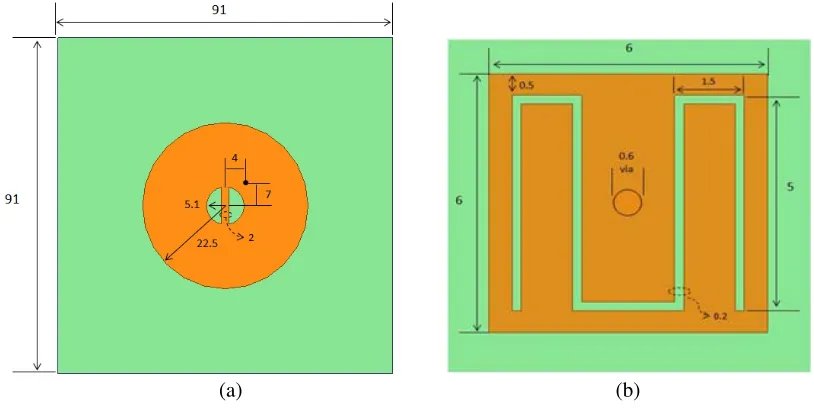
The proposed antenna comprises CMSA on one side and full ground on the other side of an FR4 substrate of relative permittivity (r) 4.4, relative permeability (μr) 1, loss tangent (δ) 0.02, and thickness of the substrate used is 1.59 mm, shown in Figure 1. M-shaped EBG unit cell which is to be used with CMSA is shown in Figure 1(b).
(b) (a)
Figure 1. (a) Proposed CMSA design. (b) M-shaped EBG unit cell.
Figure 2. Geometry of CMSA with M-shaped EBG structure [10].
(b) (a)
(d) (c)
Figure 3. (a) Front view of CMSA without EBG. (b) Back view of CMSA without EBG. (c) Front view of CMSA with EBG. (d) Back view of CMSA with EBG.
3. DESIGN METHODOLOGY AND MODEL
CMSA with a slight flat surface on circumference is used instead of exact circular shape to fine tune the results which were found to be optimal by keeping number of segments equal to fifty (50). The CMSA is fed with a coaxial cable, and coordinates for feed are (4,7) mm from the centre of CMSA, which is surrounded by an array of unit cells. The phantom head model is designed and integrated in simulation using ANSYS HFSS 15.0.
The frequency of resonance is calculated using the following equation
ω0 = 1
√
Capacitor effects result from the gaps between the unit cells and inductor from the current along the length of unit cells. At lower frequencies, the impedance is inductive and supports transverse magnetic surface waves, and at high frequencies, it becomes capacitive and supports transverse electric surface waves. At resonance frequency, the highest impedance is attained, and EBG will not support surface waves [9]. For determining stopband features, the EBG cell is kept below microstrip line, and either wave ports or Floquet ports are used as feeding techniques to achieve phase reversal property at desired frequency. The method is shown in Figure 6. The EBG structure reduces surface waves which lessens the electric field intensity, and thereby SAR is reduced. The value of capacitance is estimated by the fringing capacitance between adjacent copper plates whereas inductance is derived from the current loop. The inductance is dependent only on thickness of the substrate and the permeability [6, 8].
The following equations are used to find values of capacitance and inductance, respectively [9]
C =
wε
0(1 +εr)
π
cosh−1
w
+g
g
(3)
L = μh (4)
where w= width of unit cell, g = gap between unit cells,r = relative permittivity, 0 = permittivity of free space,μ = permeability, andh = thickness of substrate.
Parameters used for creating six-layered head phantom model are listed below in Table 1 and Table 2, and data were downloaded in September 2016 [11–13].
Table 1. Head model properties [11, 12].
Name of Tissue Thickness in [mm] Mass Density in [kg/m3]
Brain 81 1045
CSF 0.2 1007
Dura 0.5 1174
Bone 0.41 1908
Fat 0.14 911
Skin 1 1109
Table 2. Generalized dielectric properties of head model [13].
Name of Tissue Conductivity in S/m Relative Permittivity Loss Tangent
Brain 1.6714 49.247 0.27114
CSF 3.2798 66.543 0.39377
Dura 1.5540 42.293 0.29355
Bone 0.3559 11.500 0.24728
Fat 0.0959 5.301 0.14465
Skin 1.3727 38.240 0.28680
Six-layered head phantom model and antennas with and without EBG are designed and simulated, for calculating SAR value. The antenna must be united with the head phantom model, and distance between head phantom model and antenna should be at least 3 mm and can vary up to 10 mm as used in various measurements specified in available literature. Figure 4 shows the CMSA with EBG and head model representation for measuring SAR value of CMSA with EBG.
Table 3. Dielectric properties of head model at 1800 MHz [13].
Name of Tissue Conductivity in S/m Relative Permittivity
Brain 1.7089 46.11
CSF 2.9235 67.2004
Dura 1.3197 42.8936
Bone 0.2752 11.7805
Fat 0.0783 5.3493
Skin 1.1847 38.8717
Figure 4. CMSA with EBG and head model. Figure 5. SAM phantom model and CMSA with EBG.
Suspended line method is used for measuring stopband characteristics, and Floquet ports are assigned as follows. Port 1 is input port which is excited by source, and waves are transmitted. Port 2 is output port which collects the waves as represented in Figure 6. Figures 7(a) and (b) show the antennas connected to transceivers having six channels in radio frequency range from 800 MHz to 2448 MHz. Open-air tests are performed to measure range and to check voice quality. Coordinates are plotted as well, with the help of global positioning system (GPS) locating devices of CMSAs while in talking mode in half duplex way by using push to talk method and is shown in Figure 7(c). The power transmitted from the walkie talkie handset is set to 1 watt during this test. Figure 7(d) shows setup of indoor environment where the CMSAs without and with EBG are connected to digital radio transceivers operated on 12 volts for observing the performance and quality of voice obtained while using CMSAs.
(b) (a)
(d) (c)
Figure 7. (a) CMSA without EBG connected to transceiver. (b) CMSA with EBG connected to transceiver. (c) Setup of open-air test measurement with both CMSA for range and location tracking. (d) Setup for indoor measurement.
4. RESULTS AND DISCUSSION
Antenna parameters (S11, Gain, Impedance Bandwidth & SAR) for CMSA are compared for both configurations (with and without EBG structure), and the results achieved from simulations and measurements for reflection coefficients are presented in Figure 8. Measured results show impedance bandwidth of 203 MHz (1713–1916) for CMSA and 244 MHz (1685–1929) for CMSA with EBG. Consequently, by means of EBG structure with the antenna, the bandwidth is enhanced by 20.19%.
Figure 8. Reflection parameter (S11) for CMSA with and without EBG.
Figure 9. Reflection parameter (S11) of unit cell in degrees for phase reversal [6].
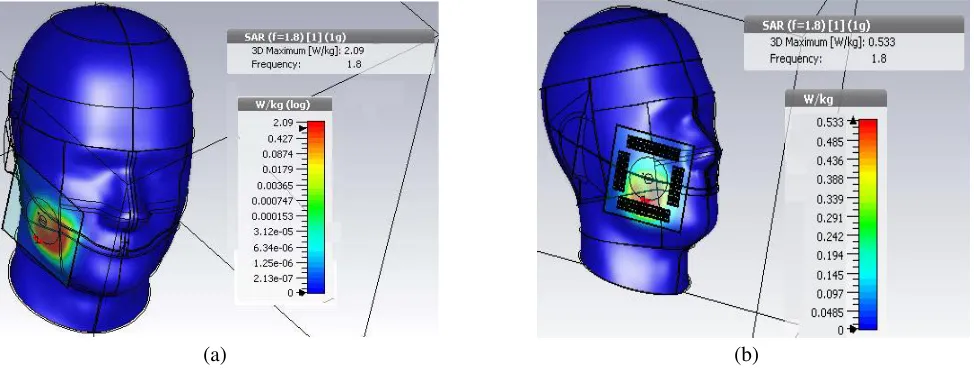
Evaluation of SAR on six-layered phantom model is done, and it is observed that SAR is effectively reduced when CMSA is used with EBG structure. From Figures 14(a) and (b) it is evident that for CMSA, SAR varies and has minimum value of 0.699 W/kg and maximum value of 2.097 W/kg in 1 gm of tissue, whereas CMSA with EBG has minimum value of 0.199 W/kg and maximum value of 0.498 W/kg. The SAR is reduced to 71.53% at lower range end and 76.25% at upper range end.
Figures 15(a) and (b) show the validation of results of SAR mentioned in Figures 14(a) and (b) using CST MW studio suite. Scales used by both the softwares tools are different, so lower range in CST MW studio is zero, and only maximum value is mentioned on the scale. Maximum value for SAR of CMSA without EBG is 2.09 W/kg which is exactly the same as simulated one using HFSS and maximum value of SAR for CMSA with EBG 0.533 W/kg which is approximately equal to the value simulated using HFSS. The reduction in SAR is about 74.50% when simulating using CST MW. Variation in some values may be attributed to computational method used by the solvers. From the results observed through simulation, as represented in Figure 16, it is determined that SAR is proportional to the electric field intensity (V/m) produced from the antenna.
1.6 1.65 1.7 1.75 1.8 1.85 1.9 1.95 2
Frequency [GHz]
8
7
6
5
4
3
2
1
0
VSWR
1.685
1.713
1.916
1.929 1.157880068
Measured CSMA with EBG Measured CSMA without EBG Simulated CSMA with EBG Simulated CSMA without EBG
Figure 10. VSWR of CSMA with and without EBG.
(b) (a)
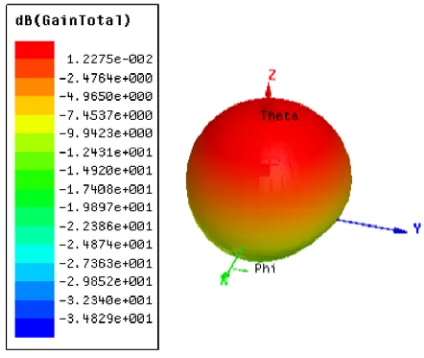
Figure 11. (a) Radiation pattern for M-shaped EBG unit cell. (b) Radiation Pattern for CSMA with EBG.
(b) (a)
Figure 13. (a) Gain plot of CMSA without EBG. (b) Gain plot of CMSA with EBG.
(b) (a)
Figure 14. (a) SAR performance of CMSA without EBG. (b) SAR performance of CMSA with EBG.
(b) (a)
Figure 16. E-field of CMSA with EBG.
(b) (a)
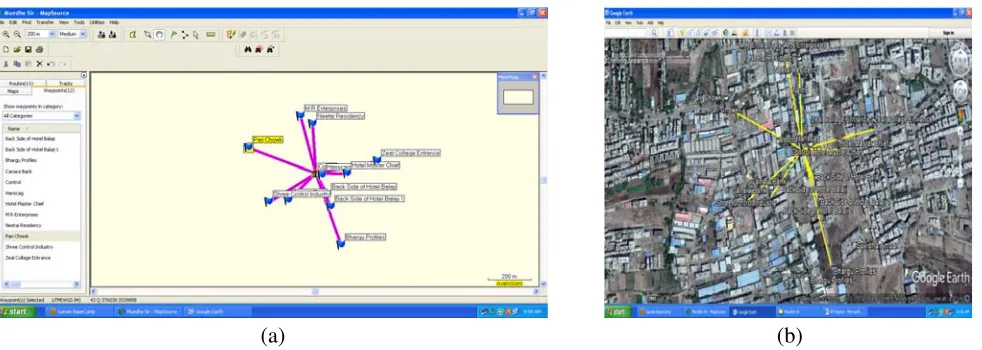
Figure 17. (a) Measurement of range of CMSA with EBG. (b) Validation of location on google earth.
from the source is 355 meters and is observed in Map Source software.
Table 4 provides comparison details of earlier works carried out using AMC, metamaterials, and EBG. The proposed antenna with surrounded EBG unit cells gives minimum SAR value for 1 gram (g) of tissue, so according to FCC standards the SAR should be assessed for 1 g and 10 g of tissue mass, whereas generally 1 g of tissue has higher SAR values than 10 g of tissue.
Table 4. Comparison with previous work for 1800 MHz.
Reference SAR without EBG in W/kg SAR with EBG in W/kg
[15] 2.4 (10 g) 1.5 (10 g)
[16] 2.2 (10 g) 0.65 (10 g)
[17] 2.848 (1 g) 2.001 (1 g)
[18] 1.56 (10 g) 0.523 (10 g)
[19] 2.05 (10 g) 1.27 (10 g)
[20] 2.05 (10 g) 0.788 (10 g)
[21] 3.62 (1 g) 2 (1 g)
5. CONCLUSION
In this article, CMSAs with EBG structure and without EBG structure are proposed for LTE band 3 (1710–1785 & 1805–1880) application. The proposed antennas are compared, and it is found that SAR is reduced drastically to 76.25% from 2.097 to 0.498 W/kg using HFSS simulation software and 74.50% from 2.09 to 0.533 W/kg using CST MW simulation software, if the EBG structure is deployed with CMSA. The CMSA’s curvature on circumference is slightly flattened to fine tune the results for required band. Due to deployment of EBG structure surface waves are reduced, and in turn SAR is reduced. SAR value of CMSA with EBG is 0.498 W/kg in 1 g of tissue which is much below 1.6 W/kg in 1 g of tissue, in adherence to the guidelines laid down by FCC to limit the same. It is found that simulated and measured results are in close agreement and meet the required specifications for SAR.
ACKNOWLEDGMENT
The authors would like to thank Mr. Anirudhda Kulkarni, Cyronics Instruments Pvt. Ltd. Pune, India for providing set-up for measurements.
REFERENCES
1. International Non-Ionizing Radiation Committee of the International Radiation Protection Association, “Guidelines on limits on exposure to radio frequency electromagnetic fields in the frequency range from 100 kHz to 300 GHz,” Health Physics, Vol. 54, No. 1, 115–123, 1988.
2. Zhao, K., S. Zhang, Z. Ying, T. Bolin, and S. He, “SAR study of different MIMO antenna designs for LTE application in smart mobile handsets,”IEEE Transactions on Antennas and Propagation, Vol. 61, No. 6, 3270–3279, June 2013.
3. G´omez-Villanueva, R., H. Jard´on-Aguilar, and R. L. Miranda, “State of the art methods for low SAR antenna implementation,” Proceedings of the Fourth European Conference on Antennas and Propagation, 1–4, Barcelona, Spain, 2010.
4. Islam, M. T., M. R. I. Faruque, and N. Misran, “Reduction of specific absorption rate (SAR) in the human head with ferrite material and metamaterial,” Progress In Electromagnetics Research C, Vol. 9, 47–58, 2009.
5. Yang, F. and Y. Rahmat-Samii, “A low profile circularly polarized curl antenna over an EBG surface,” Microwave Optical Technology Letters, Vol. 31, No. 4, 264–267, 2001.
6. Yang, F. and Y. Rahmat-Samii, “Reflection phase characterization of an Electromagnetic Band Gap (EBG) surface,” Proceedings of IEEE Antenna and Propagation Society, Vol. 3, 744–747, 2002.
7. Elsheakh, N., H. A. Elsadek, and E. A. Abdallah, “Investigated new embedded shapes of Electromagnetic Band Gap structures and via effect for improved microstrip patch antenna performance,”Progress In Electromagnetics Research B, Vol. 20, 91–107, 2010.
8. Faruque, M. R. I., M. I. Hossain, and M. T. Islam, “Low specific absorption rate microstrip patch antenna for cellular phone applications,” IET Microwaves, Antennas and Propagation, Vol. 9, No. 14, 1540–1546, 2015.
9. Yang, F. and Y. Rahmat-Samii, Electromagnetic Band Gap Structures in Antenna Engineering UK, Cambridge University Press, 2008.
10. Shinde, J. P. and P. N. Shinde, “M-shape electromagnetic-bandgap structures for enhancement in antenna performance,” Int. J. Electronics and Communications, Vol. 70, No. 6, 842–849, 2016. 11. Barnes, F. S. and B. Greenebaum. Bioengineering and Biophysical aspects of Electromagnetic
Fields, CRC Press LLC, US, 2006.
13. ITIS Foundation, “Dielectric properties of body tissues,” https://itis.swiss/virtual-population/tissue-properties/database/dielectric-properties.
14. Mohammad, E. G., A. Es-Salhi, and P. M. Mendes, “Shifting the half wave dipole antenna resonance using EBG structure,” 27th International Conference on Microelectronics (ICM), 218– 221, Casablanca, 2015.
15. Imaculate, R. and S. Raghavan, “SAR reduction using a single SRR superstrate for a dual-band antenna,” Electromagnetic Biology and Medicine, Vol. 36, No. 1, 39–44, 2016.
16. Alam, T., M. R. I. Faruque, and M. T. Islam, “Specific absorption rate analysis of broadband mobile antenna with negative index metamaterial,” Applied Physics A, Vol. 122, No. 3, 2016. 17. Faruque, M. R. I., M. I. Hossain, N. Misran, M. Singh, and M. T. Islam, “Metamaterial-embedded
low SAR PIFA for cellular phone,”PLoS ONE, Vol. 10, No. 11, 2015.
18. Alam, T., M. R. I. Faruque, and M. T. Islam, “Specific absorption rate reduction of multi-standard mobile antenna with double-negative metamaterial,”Electronics Letters, Vol. 51, No. 13, 970–971, 2015.
19. Sultan, K., H. Abdullah, E. A. Abdallah, and E. A. Hashish, “Low SAR, compact and multiband antenna,” PIERS Proceedings, 748–751, Taipei, March 25–28, 2013.
20. Sultan, K., H. Abdullah, E. A. Abdallah, and E. A. Hashish, “Low-SAR, miniaturized printed antenna for mobile, ISM, and WLAN services,” IEEE Antennas and Wireless Propagation Letters, Vol. 12, 1106–1109, 2013.
![Figure 2. Geometry of CMSA with M-shaped EBG structure [10].](https://thumb-us.123doks.com/thumbv2/123dok_us/1969364.1259849/3.612.145.471.307.559/figure-geometry-cmsa-m-shaped-ebg-structure.webp)
![Table 2. Generalized dielectric properties of head model [13].](https://thumb-us.123doks.com/thumbv2/123dok_us/1969364.1259849/4.612.149.467.360.463/table-generalized-dielectric-properties-head-model.webp)
![Figure 6. M-shaped EBG unit cell simulation using suspended line method [14].](https://thumb-us.123doks.com/thumbv2/123dok_us/1969364.1259849/5.612.151.463.116.219/figure-shaped-ebg-unit-simulation-using-suspended-method.webp)
![Figure 9. Reflection parameter (S11) of unit cell in degrees for phase reversal [6].](https://thumb-us.123doks.com/thumbv2/123dok_us/1969364.1259849/7.612.165.455.84.262/figure-reection-parameter-unit-cell-degrees-phase-reversal.webp)