Gray Level Image Threshold Using Neutrosophic Certainty1
PATRASCU, Vasile
Research Center in Electrical Engineering, Electronics and Information Technology Valahia University of Targoviste e-mail: [email protected]
Abstract
This article presents a new method of segmenting images with gray levels. The method is based on determining several thresholds for separation of gray levels. The determination of these thresholds is done using the certainty of the neutrosophic information. The concept of this method can be stated simply: to choose the local maximums for the neutrosophic certainty.
Keywords: image segmentation, gray level thresholds, neutro-sophic information, neutroneutro-sophic certainty
ACM/AMS Classification: 68U10, 62H35
1. Introduction
Segmentation of images with gray levels is a procedure of determining several subsets for the gray levels existing in that image and then, approx-imating the gray levels with the average of the intervals of which they are part. These subsets are intervals of real numbers, usually contained in the range [0,225] or [0,1]. The separation of these intervals is done by determin-ing optimal thresholds. In this article, the determination of these thresholds is constructed using elements from the neutrosophic theory of information rep-resentation.
Next, the article has the following structure: Section 2 presents an introduc-tion for the neutrosophic representaintroduc-tion of informaintroduc-tion; Secintroduc-tion 3 presents the metric for gray levels, subsequently used to define a measure of the similarity of gray levels; Section 4 shows a presentation of the neutrosophic certainty used as an objective function to determine the separation thresholds; Section 5 presents the neutrosophication procedure of a gray level image; Section 6 presents the segmentation method; Section 7 presents some experimental re-sults; Section 8 presents the conclusions. The article ends with the section of references.
1
2. The Neutrosophic Information Representation
The neutrosophic information is described by three parametersT ∈[0,1],
F ∈ [0,1], I ∈ [0,1] where T is the degree of truth, F is the degree of fal-sity and I is the degree of indeterminacy or degree of neutrality [2], [3], [9], [10]. Neutrosophic representation of information is an extension of fuzzy rep-resentation [12] and intuitionistic fuzzy reprep-resentation [1]. The neutrosophic information is incomplete whenT+I+F <1, is complete whenT+I+F = 1 and it is inconsistent whenT +I+F >1.
The order relation between two neutrosophic information is define by:
(Tp, Ip, Fp)(Tq, Iq, Fq) (1)
if and only if
∆T ≥0 (2)
∆T ≥∆F (3)
∆T ≥∆F + ∆I (4)
where
∆T =Tp−Tq (5)
∆F =Fp−Tq (6)
∆I =Ip−Iq (7)
There are the following inequalities for the vertices of the neutrosophic cube, namely the unit cube [0,1]×[0,1]×[0,1]:
(1,0,0)>((1,1,0)>(1,0,1)>(0,0,0)>(0,1,0)>(0,0,1)>(0,1,1) (8)
(1,0,0)>((1,1,0)>(1,0,1)>(1,1,1)>(0,1,0)>(0,0,1)>(0,1,1) (9)
The neutrosophic informationp= (0,0,0) andq = (1,1,1) are not comparable because ∆T <0 while ∆T = ∆F and ∆T >∆F + ∆I.
In the next we will define the two main binary operations for neutrosophic information: thejoinand themeet. We will use the following binary operations for real numbers:
x∨y=max(x, y) (10)
x∧y=min(x, y) (11)
The join:
We will use for the join the symbol ∪. For two triplets p = (Tp, Ip, Fp) and q= (Tq, Iq, Fq) the join operation is define by the following three relations:
Tp∪q=Tp∨Tq (12)
Fp∪q =Tp∨Tq−(Tp−Fp)∨(Tq−Fq) (13)
The meet:
We will use for the meet the symbol ∩. For two triplets p = (Tp, Ip, Fp) and q= (Tq, Iq, Fq) the meet operation is define by the following three relations:
Tp∩q=Tp∧Tq (15)
Fp∩q =Tp∧Tq−(Tp−Fp)∧(Tq−Fq) (16)
Ip∩q= (Tp−Fp)∧(Tq−Fq)−(Tp−Fp−Ip)∧(Tq−Fq−Iq) (17)
At the end of this section, we will define three unary operations for neutrosophic information. These operations will be used for neutrosophic cer-tainty properties description.
The complementis define by :
(T, I, F)c= (F, I, T) (18)
The negationis define by :
(T, I, F)n= (1−T, I,1−F) (19)
The dualis define by:
(T, I, F)d= (1−F, I,1−T) (20)
3. The Gray Level Similarity Function
In this section, we will show, how was constructed the gray level similarity function that was used for the proposed segmentation method. The interval [0,1] was considered for the range of the gray levels. In order to compute the gray level similarity, we will use the negation of dissimilarity and for the dissimilarity between two gray levels x, y ∈ [0,1], we will use the following metric [6], [7]:
d: [0,1]×[0,1]→[0,1],
d(x, y) = 2|x−y|
1 +|x−0.5|+|y−0.5| (21)
We will show how can we obtain the metric (21). We consider the following distance D:R2 →[0,1], defined by [11]:
D(x, y) = |x−y|
1 +|x|+|y| (22)
D(x, y) is a metric because it satisfies the following conditions:
(ii) D(x, y) = 0 if x=y
(iii) D(x, y) +D(y, z)≥D(x, z)
It is obvious that the distance D verifies the conditions (i) and (ii). In the next, we will prove that it verifies the triangle inequality:
|x−y| 1 +|x|+|y|+
|y−z| 1 +|y|+|z| ≥
|x−z|
1 +|x|+|z| (23)
This is obtained using the following three inequalities [4]:
|x−y|+|y−z| ≥ |x−z| (24)
|x−y| · |z|+|y−z| · |x| ≥ |x−z| · |z| (25)
|x−y| |x|+|y|+
|y−z| |y|+|z| ≥
|x−z|
|x|+|z| (26)
Using the metricD we define the metricdby:
d(x, y) = 2D(x−0.5, y−0.5) (27)
It results:
d(x, y) = 2|x−y|
1 +|x−0.5|+|y−0.5| (28)
One obtains the similarity s(x, y) between two gray levelsx and y with the negation ofd(x, y), namely:
s(x, y) = 1− 2|x−y|
1 +|x−0.5|+|y−0.5| (29)
With this similarity, we will construct the neutrosophic information as-sociated with each gray levelx and related to the thresholdt.
4. The Certainty for Neutrosophic Information
As a result, in the space (T, I, F) the neutrosophic certainty must verify the following conditions [5]:
i) maximality
g(1,0,0) =g(0,0,1) = 1 (30)
ii) minimality
g(T, I, T) =g(F, I, F) = 0 (31)
iii) symmetry
g(T, I, F) =g(F, I, T) =g(1−T, I,1−F) =g(1−F, I,1−T) (32)
iv)monotonicity
g(T1, I1, F1)≤g(T2, I2, F2) (33)
if|T1−F1| ≤ |T2−F2|,|T1+F1−1| ≥ |T2+F2−1|, I1 ≥I2.
The property (iv) shows that the certainty increases with |T −F|, de-creases with|T+F −1|and decreases with I.
From (iv) it results thatg(T, I, F)∈[0,1] because g(T, I, F)≤g(1,0,0) and g(T, I, F)≥g(0,1,0).
In this paper, the formula presented in [5] is used as a measure for the neutrosophic certainty.
g(T, I, F) = |T−F|
1 +I+|T +F−1| (34)
5. The Neutrosophic Information Construction
Any gray level image is defined by the triplet (Ω, A, h) where Ω = {1,2, ..., m} × {1,2, ..., n} represents the image domain, A = [0,1] represents the gray level range, h : Ω → A is the function that define the image. We consider the multisetX =h(Ω) and we denote
xm =min(X) (35)
xM =max(X)) (36)
and take a pointt∈(xm, xM). Also, we define the following two multisetsX1
and X2 by:
X1={x∈X|x≤t} (37)
X2={x∈X|x≥t} (38)
v1(t) =
1
card(X1)
X
x∈X1
x (39)
v2(t) =
1
card(X2)
X
x∈X2
x (40)
For calculation the similarity between two gray levelsx, y∈[0,1] we will use the similarity functions presented before, namely:
s: [0,1]×[0,1]→[0,1],
s(x, y) = 1− 2|x−y|
1 +|x−0.5|+|y−0.5| (41)
We will calculate the similarities between each gray level x and the av-eragesv1,v2 and the threshold t. It resultss(x, v1),s(x, v2) and s(x, t).
s(x, v1) = 1− 2|x−v1(t)|
1 +|x−0.5|+|v1(t)−0.5| (42)
s(x, v2) = 1− 2|x−v2(t)|
1 +|x−0.5|+|v2(t)−0.5| (43)
s(x, t) = 1− 2|x−t|
1 +|x−0.5|+|t−0.5| (44)
Also, we define the similarity between the gray level x and the pair (v1, v2) with the following formula:
sv(x, v1, v2) =max(s(x, v1), s(x, v2)) (45)
With these four similarities, we will construct the neutrosophic infor-mation associated with each gray level x and related to the threshold t: the degree of truthT(x, t), the degree of falsityF(x, t) and the degree of neutrality
I(x, t) [8].
The degree of truth:
T(x, t) = s(x, v1)·(1−s(x, v2)) 1−s(x, v1)·s(x, v2)
(46)
The degree of falsity:
F(x, t) = s(x, v2)·(1−s(x, v1)) 1−s(x, v1)·s(x, v2)
(47)
The degree of neutrality:
I(x, t) = s(x, t)·(1−sv(x, v1, v2)) 1−s(x, t)·sv(x, v1, v2)
It results the following formula for the neutrosophic certainty associated to each gray level xand related to the threshold t.
g(x, t) = |T(x, t)−F(x, t)|
1 +I(x, t) +|T(x, t) +F(x, t)−1| (49)
6. The Segmentation Method
Firstly, we will construct the set of the possible values for the thresholds. This is the following set:
Vth=
1
Q,
2
Q, . . . , Q−1
Q
(50)
where Q is a natural number and Q≥100. In addition, we will select those values that are in the range (xm, xM) defined by (35) and (36). Thus, for each t ∈ (xm, xM)∩
n
1 Q,
2 Q, . . . ,
Q−1 Q
o
, we calculate the certainty average for the fuzzy sets defined by the neutrosophic components T and F.
It results the partial certainty functions: gT(t), gF(t).
gT(t) =
P
x∈XT(x, t)·g(x, t)
P
x∈XT(x)
(51)
gF(t) =
P
x∈XF(x, t)·g(x, t)
P
x∈XF(x, t)
(52)
Then, we define the total certainty G(t), which is calculated with the sum of the partial certainties calculated above.
G(t) =gT(t)) +gF(t) (53)
The segmentation thresholds are the local maximum points of the total cer-tainty.
We suppose that at the end, we obtained k thresholds t1, t2, ... ,tk. In this way, we obtainedk+ 1 subsetsw1 = (xm, t1)∩X, ... ,wi = (ti−1, ti)∩X, ... , wk+1= (tk, xM)∩X. For each subsetwi, we will calculate its averageci with the formulas:
ci= 1
card(wi)
X
x∈wi
x (54)
7. Experimental Results
To test the properties of this new method, we implement it in four gray level images, as shown respectively in figures 1(a), 2(a), 3(a) and 4(a). The proposed method was applied for segmentation of the following images: Fz0, Geometric, Lena and Bobby. The obtained results and the graphic of the certainty functions can be seen in figures 1(b,c), 2(b,c), 3(b,c) and 4(b,c). The total certainty for image Fz0 has only one maximum for t = 0.49. The averages obtained are c1 = 0.23 and c2 = 0.76. The total certainty for image
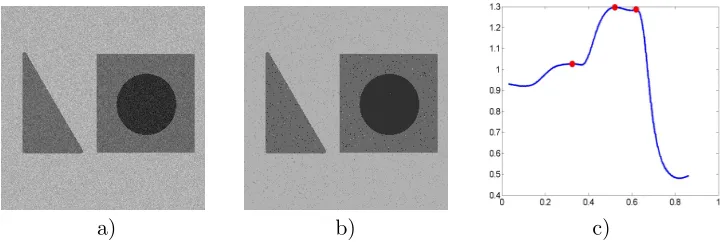
Geometric has three local maximums for t1 = 0.33, t2 = 0.52 and t3 = 0.62. The averages obtained are c1 = 0.19, c2 = 0.42, c3 = 0.60 and c4 = 0.70.
The total certainty for image Lena has three local maximums for t1 = 0.31, t2 = 0.73 and t3 = 0.89. The averages obtained are c1 = 0.22, c2 = 0.53 ,
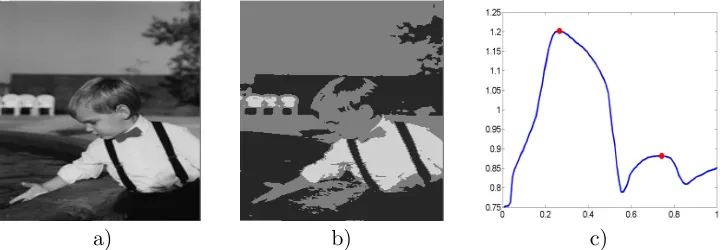
c3 = 0.80 and c4 = 0.90. The total certainty for image Bobby has two local maximums fort1 = 0.27 and t2 = 0.74. The averages obtained arec1 = 0.15, c2 = 0.50 andc3 = 0.82.
a) b ) c)
Figure 1: The image Fz0 (a). The segmented image with two gray levels (b). The graphic of neutrosophic certainty and its local maximum (c).
a) b) c)
a) b) c)
Figure 3: The image Lena (a). The segmented image with four gray levels (b). The graphic of neutrosophic certainty and its local maximums (c).
a) b) c)
Figure 4: The image Bobby (a). The segmented image with three gray levels (b). The graphic of neutrosophic certainty and its local maximums (c).
8. Conclusions
The article presents a method of segmenting images with gray levels, using the separation thresholds for intervals of gray levels. The separation thresholds are determined by the local maximum points of the neutrosophic certainty. In order to be able to use the neutrosophic certainty, it is presented the way of attaching a neutrosophic information to a gray level. Obviously, this attached neutrosophic information is related to the considered threshold. The presented method may provide multiple separation thresholds. The experimental results show us that, indeed, the local maximum points of the neutrosophic certainty can provide separation thresholds for the gray levels contained in an image. Also, the experimental results show us that it is pos-sible to segment the color images, using the presented method.
References
1. K. Atanassov. Intuitionistic Fuzzy sets. ”Fuzzy Sets and Systems”, 20, pp. 87-96, 1986.
2. G. Albeanu, Neutrosophic Computational Models - I, ”Annals of Spiru Haret University”, Mathematics-Informatics Series, Volume IX /, Issue 2, pp. 13-22, 2013.
3. G. Albeanu, Neutrosophic Computational Models - II, ”Annals of Spiru Haret University”, Mathematics-Informatics Series, Volume X, Issue 2, pp. 51-56, 2014.
4. M.S. Klamkin, A. Meir, Ptolemey’s Inequality, Chordal Metric, Multi-plicative Metric, ”Pacific Journal of Mathematics”, Vol. 101, No. 2, pp. 389-393, 1982.
5. V. Patrascu, Shannon Entropy for Neutrosophic Information,
”doi:10.13140/RG.2.2.32352.74244”, arXiv:1810.00748, September, 2018. 6. V. Patrascu, A Novel Penta-Valued Descriptor for Color Clustering,
”The 6th International Conference on Image and Signal Processing”, ICISP 2014, Cherbourg, Normandy, France, June 30 - July 2, 2014, Vol-ume: Image and Signal Processing, Lecture Notes in Computer Science, Volume 8509, Springer International Publishing Switzerland, pp. 173-182, 2014.
7. V. Patrascu, New Framework of HSL System Based Color Clustering Algorithm, ”The 24th Midwest Artificial Intelligence and Cognitive Sci-ences Conference”, MAICS 2013, April 13-14, 2013, New Albany, Indi-ana. USA, ceur-ws.org, Vol. 1348, pp. 85-91, 2013.
8. V. Patrascu, Gray Level Image Threshold Using Neutrosophic Shannon Entropy ”The 3rd Conference on Recent Advances in Artificial Intelli-gence”, RAAI 2019, Bucharest, Romania, June 28-30, 2019.
9. F. Smarandache, Neutrosophy, ”arXiv:math/0010099”, 11 Oct. 2000 10. F. Smarandache, An Introduction to the Neutrosophic Probability
Ap-plied in Quantum Physics, ”arXiv:math/0010088”, 10 oct 2000.
11. P. N. Yianilos, Normalized Forms for Two Common Metrics, Techni-cal Memorandum, ”NEC Research Institute”, 91-082-3-902, 5 December 1991.