Western University Western University
Scholarship@Western
Scholarship@Western
Electronic Thesis and Dissertation Repository
4-4-2019 10:00 AM
Texture Analysis and Machine Learning to Predict Pulmonary
Texture Analysis and Machine Learning to Predict Pulmonary
Ventilation from Thoracic Computed Tomography
Ventilation from Thoracic Computed Tomography
Andrew Westcott
The University of Western Ontario Supervisor
Parraga, Grace
The University of Western Ontario
Graduate Program in Medical Biophysics
A thesis submitted in partial fulfillment of the requirements for the degree in Master of Science © Andrew Westcott 2019
Follow this and additional works at: https://ir.lib.uwo.ca/etd
Part of the Medical Biophysics Commons
Recommended Citation Recommended Citation
Westcott, Andrew, "Texture Analysis and Machine Learning to Predict Pulmonary Ventilation from Thoracic Computed Tomography" (2019). Electronic Thesis and Dissertation Repository. 6080.
https://ir.lib.uwo.ca/etd/6080
This Dissertation/Thesis is brought to you for free and open access by Scholarship@Western. It has been accepted for inclusion in Electronic Thesis and Dissertation Repository by an authorized administrator of
Abstract
Chronic obstructive pulmonary disease (COPD) leads to persistent airflow limitation, causing
a large burden to patients and the health care system. Thoracic CT provides an opportunity to
observe the structural pathophysiology of COPD, whereas hyperpolarized gas MRI provides
images of the consequential ventilation heterogeneity. However, hyperpolarized gas MRI is
currently limited to research centres, due to the high cost of gas and polarization equipment.
Therefore, I developed a pipeline using texture analysis and machine learning methods to
create predicted ventilation maps based on non-contrast enhanced, single-volume thoracic CT.
In a COPD cohort, predicted ventilation maps were qualitatively and quantitatively related to
ground-truth MRI ventilation, and both maps were related to important patient lung function
and quality-of-life measures. This study is the first to demonstrate the feasibility of predicting
hyperpolarized MRI-based ventilation from single-volume, breath-hold thoracic CT, which
has potential to translate pulmonary ventilation information to widely available thoracic CT
imaging.
Keywords
Chronic Obstructive Pulmonary Disease, Magnetic Resonance Imaging, Hyperpolarized Gas
ii
Co-Authorship Statement
The following thesis contains one scientific conference proceeding and one manuscript that
has been submitted for publication. As the first author of these works, I was a significant
contributor to all aspects of the studies as well as manuscript preparation and submission. I
was responsible for data acquisition, pipeline and software development, conception of the
study, experimental design, image processing, statistical analyses and interpretation, as well as
manuscript preparation and submission. Grace Parraga, as the Principal Investigator and thesis
Supervisor, provided continued guidance and was responsible for the conception of the study,
experimental design, data interpretation and drafting and approval of manuscripts. She was
also the guarantor of the data integrity and responsible for Good Clinical Practice. Patient
study visits and acquisition of pulmonary function data were performed under the supervision
of Lyndsey Reid-Jones, Rachel Eddy and Danielle Knipping. Polarization of hyperpolarized
gas was performed by Andrew Wheatley, Dante PI Capaldi, Heather Young and myself. MRI
acquisition was performed by Trevor Szekeres and David Reese. Below outlines the specific
contributions for all co-authors for Chapter 2 and Chapter 3.
Chapter 2 is a peer-reviewed conference proceeding entitled “Texture Analysis of Thoracic CT
to Predict Hyperpolarized Gas MRI Lung Function” and it was accepted for SPIE Medical
Imaging conference proceedings. The proceeding was co-authored by Andrew Westcott, Dante
PI Capaldi, David G McCormack, Aaron Fenster and Grace Parraga. I was responsible for data
acquisition, pipeline and software development, concept development, experimental design,
image processing, statistical analyses and interpretation, as well as manuscript preparation and
submission. Dante PI Capaldi assisted in data collection and concept development, David
McCormack assisted in data interpretation, and Aaron Fenster assisted in method development
and data interpretation.
Chapter 3 is an original research article entitled “Chronic Obstructive Pulmonary Disease:
Thoracic CT Texture Analysis and Machine Learning to Predict Pulmonary Ventilation” and
it was submitted to the journal Radiology on February 26, 2019. The manuscript was
co-authored by Andrew Westcott, Dante PI Capaldi, David McCormack, Aaron Ward, Aaron
Fenster and Grace Parraga. I was responsible for data acquisition, pipeline and software
iii
analyses and interpretation, as well as manuscript preparation and submission. Dante PI
Capaldi assisted in data collection, concept development and manuscript revisions, David
McCormack assisted in data interpretation and manuscript revisions, Aaron Ward assisted in
data interpretation and manuscript revisions, and Aaron Fenster assisted in method
development, data interpretation and manuscript revisions.
The appendix contains three published manuscripts completed within my MSc that I was first
author for, which are complementary, yet not directly related to the objective and hypothesis
of this thesis. As first author I was responsible for data acquisition, statistical analysis,
experimental design, manuscript preparation and literature review. Appendix A is a
peer-reviewed original research article entitled “Hyperpolarized 3He MRI ventilatory Apparent Diffusion Coefficient of alpha-1 antitrypsin deficiency”, and was published as an extended
letter to the editor August 13, 2018. The manuscript was co-authored by Andrew Westcott,
Dante PI Capaldi, Alexei Ouriadov, David G McCormack and Grace Parraga. Appendix B is
a peer-reviewed original research article entitled “Rapid single-breath hyperpolarized noble
gas MRI-based biomarkers of airspace enlargement”, and was published December 21, 2018.
The manuscript was co-authored by Andrew Westcott, Fumin Guo, Grace Parraga and Alexei
Ouriadov, where I was co-first author with Fumin Guo. Appendix C is a peer-reviewed review
article entitled “Advanced pulmonary MRI to quantify alveolar and acinar duct abnormalities: Current status and future clinical applications”, and was published January 13, 2019. The
manuscript was co-authored by Andrew Westcott, David G McCormack, Grace Parraga and
iv
Acknowledgments
I would first like to thank my supervisor, Grace Parraga. The opportunities you have provided
me are incredibly unique; from working on publications, review articles and abstracts, to the
opportunity to continually collaborate with colleagues. These experiences have led to personal
and professional growth in a short period of time that I could not have imagined before this
experience. I greatly appreciate knowing you were always vehemently in my corner to support
my work and goals.
I would also like to thank the members of my advisory committee: Aaron Fenster, Aaron Ward
and Eranga Ukwatta for your support and guidance. The committee meetings were thought
provoking and immensely helpful – but more importantly, I knew I could reach out for any
advice to leverage your individual expertise. Further thanks goes to the amazing support of the
Medical Biophysics department, including: Kathleen Petts, Umera Ali, Wendy Hough, Jeff
Frisbee and Jennifer Devlin. The opportunities provided and excellent communication make
me confident I was lucky enough to be a part of one of the best departments there is.
A special thank you goes to everyone within the Parraga lab – past and present – I feel fortunate
to get to call each of you my colleague and friend. Each and every one of you have made
Robarts and our lab an incredibly special place to work. To Lyndsey Reid-Jones, thank you for
being kind, caring and fun – however I was feeling, my mood would improve with a visit to
your office. To Tamas Lindenmaier, thank you for putting me out of my job, allowing me to
finish my thesis. To Danielle Knipping, thank you for always being kind, calm and helpful.
You both made a morning coffee, lunch or discussion on business within the lab incredibly
enjoyable. To Alexei Ouriadov, thank you for the opportunity to work with you on multiple
interesting projects and for teaching me about diffusion imaging. To Sarah Svenningsen and
Miranda Kirby, thank you for the opportunity to work with you on exciting projects, and.
To Rachel Eddy thank you for being my go-to person when I need to talk out an idea or can’t
remember something, and for being the true senior student we could rely on this last year. The
help, support and encouragement you have provided goes well beyond an extra set of eyes on
my work. To Dante Capaldi, thank you for your great sense of humor and genuine interest in
v
humor. To Heather Young, thank you for being an incredible support through my transition to
graduate school, and for patiently teaching me the fundamentals of the lab. To Andrea Barker,
thank you for stepping up the social game in the lab, a chat with you about life outside work
or on human physiology is always an awesome way to spend some time. To Cathy Ong Ly,
thank you for always lightening the mood and being positive, as well as our interesting
conversations about machine learning topics. To Jonathan MacNeil, thank you for reaching for
even more puns than me, and discussing novel COPD imaging phenotypes. To Alexander
Matheson, thank you for being a coding partner, and for discussing interesting physics
concepts, as well as any other topic you happen to know a lot about. The hard work,
perseverance and positive attitudes each of you display is inspiring.
A huge thank you to all of the students and personnel around Robarts and beyond who have
made graduate school immensely fun, creating a work-life balance that allowed me to focus
on working hard when needed. Thank you to first year communications, and everyone
involved, for introducing me to so many great people who would go on to be great friends.
Finally, my deepest gratitude goes towards Sarah, my family and my friends outside of
Western. You have provided continuing, unwavering support in anything I do, and were always
able to provide an outside perspective if I ever needed advice. Despite being too busy at times
to communicate and visit as much as I wanted, I could count on you understanding and
providing love and friendship whenever we reconnect. I’m incredibly lucky to have such great
vi
Table of Contents
CERTIFICATE OF EXAMINATION ... Error! Bookmark not defined.
Abstract ... i
Co-Authorship Statement ... ii
Acknowledgments ... iv
List of Tables ... ix
List of Figures ... x
List of Appendices ... xii
List of Abbreviations ... xiii
CHAPTER 1 ... 1
1 INTRODUCTION ... 1
Motivation and Rationale ... 1
Structure and Function of the Lung ... 3
1.2.1 Airways ... 3
1.2.2 Parenchyma ... 4
Pathophysiology of Chronic Obstructive Pulmonary Disease ... 5
1.3.1 Emphysema ... 6
1.3.2 Chronic Bronchitis ... 7
Clinical Measures of Global Lung Function ... 7
Imaging Pulmonary Structure and Function ... 10
1.5.1 Structural and Anatomical Imaging ... 10
1.5.2 Functional Imaging ... 12
Texture Analysis in Medical Imaging ... 15
1.6.1 Typical Work Flow ... 16
vii
1.6.3 Applications in Lung Imaging ... 23
Thesis Hypotheses and Objectives ... 24
References ... 26
CHAPTER 2 ... 36
2 TEXTURE ANALYSIS OF THORACIC CT TO PREDICT HYPERPOLARIZED GAS MRI LUNG FUNCTION ... 36
Introduction ... 36
Materials and Methods ... 37
2.2.1 Study Subjects and Image Acquisition ... 37
2.2.2 Proposed Pipeline... 38
2.2.3 Hyperpolarized MRI to Thoracic CT Registration ... 38
2.2.4 Thoracic CT Feature Extraction... 39
2.2.5 Training a Classification Model... 41
Results ... 42
2.3.1 Study Subjects ... 42
2.3.2 Model Results ... 42
2.3.3 Comparison to Conventional CT Measures ... 44
New or Breakthrough Work to be Presented ... 45
Discussion and Conclusion ... 46
References ... 47
CHAPTER 3 ... 49
3 CHRONIC OBSTRUCTIVE PULMONARY DISEASE: THORACIC CT TEXTURE ANALYSIS AND MACHINE LEARNING TO PREDICT PULMONARY VENTILATION ... 49
Introduction ... 49
Materials and Methods ... 50
viii
3.2.2 Image Acquisition ... 52
3.2.3 Image co-Registration ... 52
3.2.4 Thoracic CT Feature Extraction... 54
3.2.5 Feature Selection ... 57
3.2.6 Training the Classification Model ... 59
3.2.7 Statistics ... 60
Results ... 60
Discussion... 65
References ... 67
CHAPTER 4 ... 70
4 CONCLUSIONS AND FUTURE DIRECTIONS ... 70
Overview and Research Questions ... 70
Summary and Conclusions ... 70
Limitations ... 71
Future Directions ... 73
4.4.1 Robustness of Texture Model ... 73
4.4.2 Lung Function Prediction in Lung Cancer... 73
4.4.3 Deep Learning for Lung Function Synthesis ... 74
Significance and Impact ... 75
References ... 77
ix
List of Tables
Table 1-1: Diagnostic cut-offs from the Global Initiative for Chronic Lung Disease (GOLD).
... 8
Table 2-1: Equations to calculate features from a gray-level run length matrix and to calculate features from a gray-level co-occurrence matrix. ... 41
Table 2-2: COPD Subject demographics, pulmonary function tests, CT and MR imaging measurements ... 42
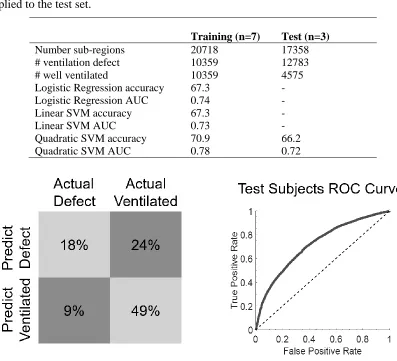
Table 2-3: Results for training and test set of patients. Only the best performing model was applied to the test set. ... 43
Table 3-1: Equations used to calculate features ... 56
Table 3-2: Quadratic SVM Training Hyperparameters ... 59
Table 3-3: Participant demographics, pulmonary function and imaging measurements ... 60
Table 3-4: Volume of interest and training sample patterns ... 61
x
List of Figures
Figure 1-1: Canadian leading causes of hospitalizations. ... 2
Figure 1-2: Idealized human airway generation diagram. ... 4
Figure 1-3: Diagram of oxygen exchange into the bloodstream. ... 5
Figure 1-4: Diagram of pathophysiology of chronic obstructive pulmonary disease. ... 6
Figure 1-5: Spirometry and plethysmography devices and measurements. ... 9
Figure 1-6: CT Imaging of healthy, mild COPD and severe COPD individuals. ... 11
Figure 1-7: 3He hyperpolarized gas MRI for healthy, mild COPD and severe COPD individuals. ... 14
Figure 1-8: PubMed results for thesis keywords. ... 16
Figure 1-9: Typical workflow for texture analysis. ... 17
Figure 2-1: Proposed texture analysis pipeline for classifying CT volumes of interest (VOIs) into ventilation defects or ventilated. ... 38
Figure 2-2: MRI to CT registration pipeline. ... 39
Figure 2-3: Confusion matrix and receiver-operator-characteristics (ROC) curve for the test set of subjects. ... 43
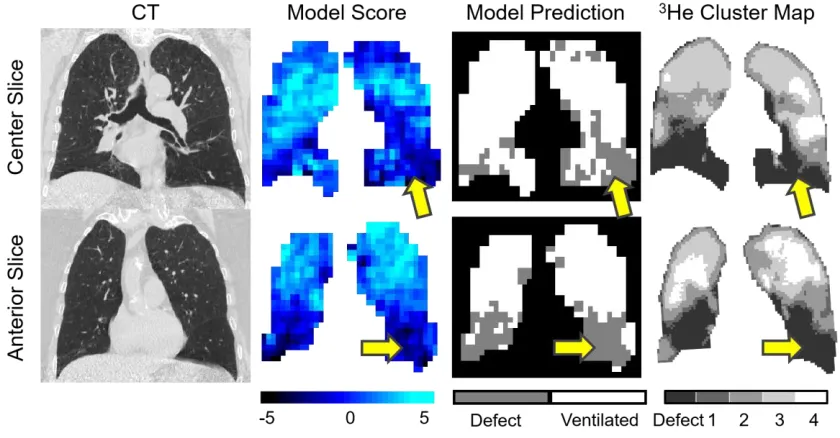
Figure 2-4: CT, Model predicted score,model binary prediction and 3He cluster map for a test subject showing representative centre and anterior slices. ... 44
Figure 2-5: “Conventional” versus Full Feature Models ... 45
Figure 3-1: Schematic for Analysis ... 51
Figure 3-2: MRI to CT registration pipeline ... 53
xi
Figure 3-4: Hyperpolarized MRI ventilation, thoracic CT image and feature maps ... 55
Figure 3-5: Details of Training set Outputs ... 58
Figure 3-6: Representative CT, MRI and model outputs for four participants in testing set . 63
xii
List of Appendices
Appendix A – Hyperpolarized 3He MRI Ventilatory Apparent Diffusion Coefficient of
Alpha-1 Antitrypsin Deficiency ... 79
Appendix B - Rapid Single-breath Hyperpolarized Noble Gas MRI Based Biomarkers of Airspace Enlargement. ... 85
Appendix C - Advanced Pulmonary MRI to Quantify Alveolar and Acinar Duct Abnormalities: Current Status and Future Clinical Applications ... 104
Appendix D – Health Science Research Ethics Board Approval Notices ... 131
Appendix E – Permissions for Reproduction of Scientific Articles ... 131
xiii
List of Abbreviations
129Xe Xenon-1291H Proton
3He Helium-3
AATD Alpha-1 Antitrypsin Deficiency ADC Apparent Diffusion Coefficient
AUC Area Under the receiver-operator characteristic Curve COPD Chronic Obstructive Pulmonary Disease
CT Computed Tomography
DLCO Diffusing Capacity of the lung for Carbon Monoxide
FEV1 Forced Expiratory Volume in 1 Second
FRC Functional Residual Capacity HU Hounsfield Unit
HU15 15th percentile of CT density histogram
MRI Magnetic Resonance Imaging mSv Millisievert
PFT Pulmonary Function Test RA950 Relative Area Under -950 HU
Rb Rubidium
ROC ROI
Receiver-Operator Characteristic Region of Interest
RV Residual Volume
SGRQ St. George’s Respiratory Questionnaire SVM
VOI
1
CHAPTER 1
1
INTRODUCTION
Chronic obstructive pulmonary disease (COPD) is a disease characterized as non-reversible airflow limitation, which causes the lung to be heterogeneously ventilated. Hyperpolarized gas magnetic resonance imaging (MRI) provides the ability to image the ventilation within the lung, however is limited to research centres, whereas thoracic computed tomography (CT) is widely available. In this thesis, the underlying hidden and visible structural information within CT images was quantified with texture analysis and machine learning to predict pulmonary ventilation heterogeneity.
Motivation and Rationale
Chronic obstructive pulmonary disease (COPD) is defined by irreversible airflow
obstruction, and presents a serious burden to the health care system and to patients’ quality
of life. COPD was projected to become the third leading cause of by 2030,1 however has surpassed the projections and was recently reported to already be the third leading cause of
death worldwide.2 As of now there is no cure for COPD,3 instead the current management goal is to improve health status, prevent exacerbations and prevent related complications
and mortality.3 Figure 1-1 displays the burden of hospitalizations from patients with COPD in Canada. Importantly, a large portion of patients are admitted for multiple hospital visits
compared to other diseases responsible for large numbers of hospitalizations.4 Related to
these hospitalization statistics, there is a mean annual COPD-related healthcare cost per
2
Figure 1-1: Leading causes of hospitalizations in Canada.
Figure adapted from Canadian Institute of Health Information, Health Indicators 2008 report.4
The large, and growing, burden illustrates the sub-optimal management and treatment of
COPD. Current measures of lung function include relatively simple and inexpensive
pulmonary function tests. Despite their wide use, these tests provide only a global measure
to encapsulate the complex heterogeneity of the disease, which manifests itself in many
ways including airway obstruction, parenchymal destruction and related pathophysiology
such as vascular abnormalities. Further, COPD is a heterogeneous disease, and does not
affect the entire lung uniformly. A more precise and sensitive method for characterizing
and monitoring underlying structural abnormalities, and resulting functional consequences,
in COPD is needed. This has motivated the use of pulmonary imaging to enable a regional
understanding of underlying structural abnormalities in patient populations, as well as on
an individual level.
Since the late 1970s, x-ray computed tomography (CT) has been used for pulmonary exams
in COPD, specifically for detecting parenchymal destruction, or emphysema.6-10 CT has further been used to visualize the airways and vasculature within the lung. Alternatively,
emerging imaging technologies such as hyperpolarized gas magnetic resonance imaging
3
lung that is a result of underlying structural abnormalities. Hyperpolarized gas MRI
provides unique information on lung function and patient outcomes, however this
functional information is currently limited to a number of research centres of excellence.
To translate this unique information, this thesis focuses on predicting regional ventilation
heterogeneity based on structural patterns and determinants as quantified within widely
available thoracic CT.
In this chapter, background relevant to the understanding and motivation of the original
research work presented in Chapters 2 and 3, is provided. In (1.2), an overview of the
relationship between structure and function of the lung is presented. Section (1.3) presents
the pathophysiology of COPD, followed by the clinical measures (1.4) and current imaging
techniques (1.5) used to monitor COPD. Texture analysis of medical images and the current
role it plays in lung imaging will be introduced in (1.6). Finally, the hypothesis and
objectives of the thesis will be introduced and stated in (1.7).
Structure and Function of the Lung
The lung is a complex organ that allows for efficient distribution and exchange of oxygen
into the bloodstream. The structure of the lungs consists of the airways, parenchyma and
vasculature, while the function is how these components exist together to distribute oxygen
throughout the lung and deliver it into the bloodstream.
1.2.1
Airways
The airways are the highway for delivery of oxygen, and range widely in size and structure.
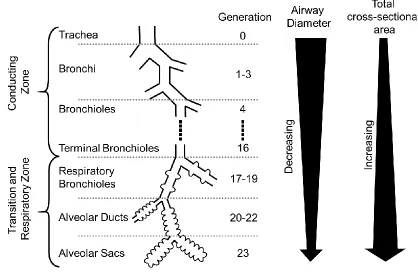
A diagram of the entire airway tree is shown in Figure 1-2. The beginning airway
generations, including the trachea and the main bronchi, have a large diameter and are
supported by cartilage. As the airway generation increases, the number of airways grows
exponentially due to branching, while the airway diameter decreases. At the terminal
bronchioles, the airways are no longer supported by a cartilage and are simply supported
by the airway wall and smooth muscle, as well as the matrix composed of alveoli.
As shown in Figure 1-2, the airway tree can be split into the conducting zone and the
4
in gas exchange, whereas the respiratory zone is comprised of airways which are lined with
alveoli. Conducting zone airways hold approximately 150 millilitres of air, and are often
referred to as dead space as they do not participate in gas exchange. This is converse to the
respiratory and transition zone airways, which participate in gas exchange and can hold
approximately 2.5-3 litres at rest, depending on the size of the individual’s lungs.11 Within the conducting zone the airflow is driven by bulk flow and the inertia of the air.
Once through the conducting zone, the total cross-sectional area of the airways increases,
slowing the velocity of airflow. From this point onward, the air movement is largely due
to diffusion of the gas.
Figure 1-2: Idealized human airway generation diagram.
Adapted from Respiratory Physiology: The Essentials 10th edition.11
1.2.2
Parenchyma
The lung and airway system is designed to maximize the surface area available for gas to
diffuse into the blood. Small alveolar sacs comprise the terminal point of the airways,
where the wall is thin enough to allow oxygen to diffuse into the bloodstream. These
5
exchange. Figure 1-3 displays a diagram of the alveoli and bloodstream interaction, where
it can be seen that the alveoli takes a spherical shape to maximize the surface area. There
are approximately 500 million alveoli within the lung,12 with a dense capillary network around the alveoli. The capillaries which participate in gas exchange are not much larger
than a single blood cell, and the alveolar-capillary membrane is extremely thin,
approximately 0.2-0.3 µm, allowing for fast diffusion of gases across the membrane.
Figure 1-3: Diagram of oxygen exchange into the bloodstream.
Diagram showing gas (blue circles) exchange into the bloodstream from the alveoli.
Pathophysiology of Chronic Obstructive Pulmonary
Disease
Lung disease can occur from an abnormality or dysfunction in any of the components
above, preventing optimal delivery of oxygen to the bloodstream. COPD is characterized
by persistent airflow limitation caused by a combination of parenchymal destruction
(emphysema) and airways disease (chronic bronchitis).3 COPD is progressive over time, and is a result of exposure to exogenous irritants such as cigarette smoke,
environmental/occupational irritants or genetic conditions such as alpha-1 antitrypsin
6
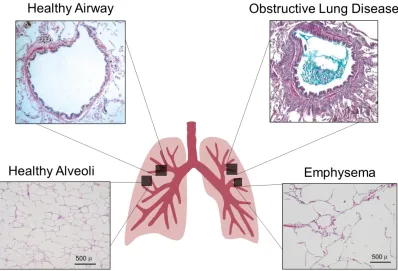
Figure 1-4: Diagram of pathophysiology of chronic obstructive pulmonary disease. Healthy airway and obstructive lung disease panels are adapted from Hogg (2004),13 permission to reproduce provided in Appendix E. Healthy Alveoli and Emphysema are adapted from Woods et al. (2006),14 permission to reproduce provided in Appendix E.
1.3.1
Emphysema
Emphysema is characterized by enlargement of the airspaces distal to the terminal
bronchioles, where gas exchange occurs. This enlargement is due to the destruction of
parenchymal tissue, where the effects can be observed in the lower right quadrant of Figure
1-4, compared to healthy alveoli in the lower left quadrant. The destruction of parenchyma
may be heterogeneous and to varying severities in different regions within the lung, which
give sub-classifications of emphysema including: centrilobular, panlobular and bullous
emphysema. Many patients have a combination of these sub-classifications, and in severe
emphysema it may be difficult to distinguish them.
Some of the earliest observations of emphysema stem from work in the 1950s from
Leopold and Gough. Their seminal work included observations on the inflammation,
7
emphysema, to three-dimensional ex vivo measurements of emphysema,16-18 and
eventually in vivo monitoring of emphysema using imaging as described in Section 1.5.
The understanding of COPD changed in the 1960s, when Dr. James Hogg et al. published
“The site and nature of airway obstruction in chronic obstructive lung disease”,
demonstrating the importance of the small airways.19 They observed that in a healthy individual, the small airways contributes a small amount of the total airways resistance.
However, in patients with COPD it was observed this relationship was inverted and small
airways resistance was significantly increased. This increased resistance was present in
regions with and without emphysema, indicating small airway abnormalities may predate
the development of emphysema.
1.3.2
Chronic Bronchitis
Chronic bronchitis is characterized by sputum production and airflow obstruction for
greater than three months during two consecutive years.3 The causes of cough and airflow obstruction are believed to be inflammation, mucus and damage to airways. Early
investigations of chronic bronchitis observed a relationship between mucous
hypersecretion and thickening of the bronchial mucus glands,20-23 as well as between
mucous hypersecretion and accelerated lung function decline.24 An example of airway
inflammation and mucus presence is shown in the upper right quadrant of Figure 1-4, where
mucus is observed in the airway lumen leading to a decreased cross-section for airflow.
Clinical Measures of Global Lung Function
“Pulmonary function tests provide objective, quantifiable measures of lung function. They are used to evaluate and monitor diseases that affect heart and lung function” Crapo
1994.25
To diagnose and monitor COPD, clinicians primarily rely on pulmonary function tests
(PFT). These are simple breathing maneuvers that monitor flow rate, lung volumes and gas
exchange at the mouth to provide information about the function of the lungs. These tests
include spirometry, plethysmography and the diffusing capacity of the lung for carbon
8
which is a function of the patient’s age, sex, height and ethnicity.26 The impact of
obstructive lung disease on patients can also be measured using quality-of-life
questionnaires and exercise capacity tests.
Of the breathing tests available, spirometry is currently the simplest and most widely used.
Spirometry can be performed using a handheld device, such as that shown in Figure 1-5A.27 The patient performs multiple tidal breaths, then is instructed to inhale fully, followed by
a forceful exhalation until they cannot exhale further. A representative lung volume curve
measured by the spirometer is displayed in Figure 1-5A. From this maneuver, the forced
expiratory volume in one second (FEV1) and the forced vital capacity (FVC) are measured.
The clinical diagnosis of COPD is based on the lung volumes measured with spirometry,
as shown in Table 1-1. A ratio of FEV1 to FVC less than 70 percent is the diagnostic
cut-off for COPD according to the Global Initiative for Chronic Lung Disease (GOLD)
criteria.3 The severity of COPD is then graded based on FEV1, where a lower percent of
predicted is indicative of increased obstruction.
Table 1-1: Diagnostic cut-offs from the Global Initiative for Chronic Lung Disease (GOLD).
The pulmonary function test cut-off for diagnosis of COPD is for FEV1/FVC<70%, the
severity grading is based on FEV1 percent predicted.
Pulmonary Function Test If FEV1/FVC < 70%
GOLD Grade 1 FEV1 ≥ 80%pred
GOLD Grade 2 50%pred ≤ FEV1 < 80%pred
GOLD Grade 3 30%pred ≤ FEV1 < 50%pred
GOLD Grade 4 FEV1 < 30%pred
Plethysmography can be used to measure additional lung volumes, based on Boyle’s law.28 The patient is seated in a sealed chamber, as shown in Figure 1-5B, and performs a series
of breathing maneuvers, including tidal breathing, full inspiration and full expiration. An
exemplar lung volume curve is also displayed in Figure 1-5B. In the context of COPD, the
residual volume and functional residual capacity will often be increased due to gas trapping
9
Figure 1-5: Spirometry and plethysmography devices and measurements.
A) Handheld spirometer and measurements of the forced expiratory volume in one second and the forced vital capacity. B) Plethysmography box for lung volume measurements.
Further, the morphology of the alveoli can be probed using the DLCO.29 This test is
performed by inhaling a specific mixture of gas, containing a low concentration of carbon
monoxide (CO) (0.3%). The patient then holds their breath at total lung capacity for eight
seconds, during which the CO diffuses across the alveolar-capillary membrane and into the
blood. When the patient breaths out, the concentration of CO is measured and compared to
the initial concentration, from which the amount of CO that has diffused into the blood is
inferred. Patients with emphysema will have a decreased DLCO due to a reduction of
alveolar surface area for gas exchange, however a decreased DLCO may also be indicative
of a thickening of the alveolar-capillary membrane, among other abnormalities.
The impact that COPD has on the life of a patient is also an important measure. To quantify
this, patient quality of life is measured using the St. George’s Respiratory Questionnaire
10
including symptoms, activity and impacts on daily life. The scores from each component
of the questionnaire are then averaged to give a single SGRQ value. Further, exercise
capacity can be quantified using tests such as the six minute walk test.31, 32 The six-minute walk test, as well as other exercise capacity measurements, have been shown to be
clinically important measures.33-35
Despite the ability to simply and cost-effectively monitor lung disease, the tests described
above do not provide sensitive quantitative or regional measurements of lung disease. In
healthy individuals, the small airways contribute only a small portion of the total lung
resistance, however, in COPD these small airways may be where the disease begins,19 and therefore may not be detected by measuring lung volumes and capacities.
Imaging Pulmonary Structure and Function
“There may be considerable obstruction in the peripheral airways that would affect
ventilation distribution and gas exchange but would have little effect on function tests
designed to reveal obstruction. When total airway resistance is elevated to a clinically
detectable level by disease in the small airways, obstruction is much more severe than is
generally recognized.” Hogg et al. 1968.19
Contrary to clinical measures of lung function, pulmonary imaging provides the
opportunity to view regional abnormalities within the lung. As discussed in Section 1.2,
the structure and function of the lung are innately connected. Anatomical imaging
modalities provide the opportunity to visualize the structural abnormalities which in turn
may be consequential in determining the functional abnormalities, which can be measured
using functional imaging techniques.
1.5.1
Structural and Anatomical Imaging
First introduced in the late 1970s, x-ray computed tomography (CT) allows for
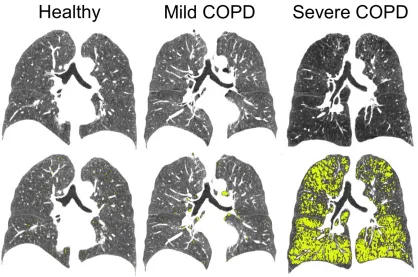
visualization of the structure within the lung, as shown within Figure 1-6. Thoracic CT can
be acquired under breath hold conditions, where a patient is instructed to inhale fully, or
by inhaling a set volume of gas from functional residual capacity. CT then provides an
11
presence of air, and as such, voxels with a density near -1000 HU indicate regions of tissue
destruction. Two methods are commonly used to quantify the severity of emphysema in a
patient, either a threshold method or percentile method. The threshold method quantifies
the percentage of the lung that has a density of less than the threshold. Commonly used
thresholds include -910 HU,36 -950 HU37 and -960 HU.38 The percentile method reports the value of the percentile density from a histogram, often used values include the 5th percentile and 15th percentile. The ability to visualize emphysema in vivo has allowed for sensitive monitoring of disease progression, and has been shown to reduce the statistical
power needed to perform clinical trials of treatment in alpha-1 antitrypsin deficiency
compared to spirometry.39
More complex CT analyses have also been employed, including metrics which examine
the statistical properties of low attenuating (< -960 HU) clusters in CT images.40 The cumulative size distribution of low attenuating clusters were shown to follow a power-law
relationship, and the power-law exponent was shown to be reduced in relation to a decrease
in DLCO.40
12
Healthy DLCO= 106%pred, FEV1/FVC= 72%, FEV1 = 80%pred; Mild COPD DLCO=87%pred,
FEV1/FVC=60%, FEV1=94%pred; Severe COPD DLCO=17%pred, FEV1/FVC=29%,
FEV1=28%pred. Yellow areas show regions of density less than -950 HU.
CT can also be used to visualize the airways and vasculature within the lung. Spatial
resolution in low-dose CT typically limits the segmentation of airways to ~7th generation airways (~2 mm diameter). Despite these limitations, from airway segmentations,
important measurements can be made such as airway wall thickness, wall area and lumen
area. Airway measurements have led to observations including recent work showing
apparent loss of airways in severe emphysema,41 and the extent of this loss measured using CT is an independent predictor of patient quality of life.42 CT measures have also been shown to be risk factors for exacerbations, including the percentage of emphysema or
airway wall thickening which were both associated with COPD exacerbation frequency.43 Further, changes in pulmonary vasculature have been observed using CT perfusion
imaging, indicating there may be vasculature changes at early stages of COPD
development.44 Non-contrast enhanced CT has also been used to observe distal pruning of small vessels in COPD, where a decreased ratio of small vessel blood volume to total blood
volume was shown.45, 46
More recently, high resolution structural images of the lung have been achieved using
magnetic resonance imaging (MRI). MRI of the lung presents a unique challenge because
there is a low density of tissue and many tissue/air interfaces. This means there is a small
magnitude of signal and a high amount of paramagnetic oxygen, which creates local field
inhomogeneities and increases the relaxation rate. To account for the increased relaxation
rate of the tissue within the lung, ultra-short echo time sequences have been developed.
47-50 These, and newer techniques such as zero echo time sequences, are advances towards
MR images achieving similar structural information as present within CT, with no radiation
dose to the patient.51
1.5.2
Functional Imaging
While structural information may indirectly inform upon the efficiency of the lung, with in
13
X-ray Computed Tomography
Contrast-enhanced CT utilizes inhaled xenon and dual energy techniques to image where
in the lung the xenon gas reaches to visualize ventilation. To accomplish this, dual-source
CT scanners are used for near-simultaneous acquisition of two separate energy spectra. The
separation between high and low energy spectra allows for differentiation between the
inhaled contrast gas, and the native materials to the lung, to generate gas distribution
images. Dual-energy CT has previously been applied to observe ventilation patterns in
patients with COPD.52, 53
In addition to dual-energy CT, it is possible to use air as a contrast agent by acquiring
images at multiple lung volumes, where you can attribute the change in density within an
anatomical location to the flux of air. Both four-dimensional CT (4D-CT) and
multi-volume CT have been used to create surrogate measures of ventilation by registering
multiple lung volumes acquired and quantifying the density change as air enters the lung.
54-59
Despite success of CT for functional imaging, the clinical adoption is limited due to the
increased radiation dose required for multiple, or extended length, scans. Additionally, the
necessity of additional scans or an exogenous contrast agent with specialized hardware
make these scans costly.
Hyperpolarized Gas Magnetic Resonance Imaging
Hyperpolarized gas MRI uses an exogenous gas, which is polarized to have an atomic spin.
When inhaled, the spatial distribution of the gas within the lungs can be imaged using
specialized receive coils within a magnetic resonance scanner. Due to the low spin density
available in the gas state, hyperpolarization is performed. This is done through optical
pumping, where angular momentum is given to an alkali metal (typically Rubidium)
through a circularly polarized laser at the resonance frequency of the metal (~794.6 nm for
Rubidium). The angular momentum is then transferred from the metal to the nuclei being
polarized (3He or 129Xe) through collisions. The optical pumping technique can increase the polarization of the gas up to five orders of magnitude greater than through a thermal
14
The field began in the 1990s, when inhaled 129Xe was first imaged within a mouse model.60
Since then, the use of hyperpolarized gas MRI has greatly expanded, and has seen the
adoption of hyperpolarized 3He, however, is currently undergoing a transition back to 129Xe due to the increasing cost of 3He. Figure 1-7 displays the ventilation patterns measured using hyperpolarized 3He across COPD disease severity. Cyan indicates the volumes ventilated within a breath-hold, whereas dark regions are not ventilated. To quantify the
extent of ventilation abnormalities, the ventilation defect percent (VDP) is calculated as
the total volume of ventilation defects normalized to the thoracic cavity volume.61 The Brownian motion of hyperpolarized gas under diffusion gradients has also been used to
probe microstructure of the lung using the apparent diffusion coefficient or
morphometry.14, 62-64 Work related to these measures is complimentary to the objective and hypothesis of this thesis, and are presented in Appendix A-C.
Figure 1-7: 3He hyperpolarized gas MRI for healthy, mild COPD and severe COPD individuals.
Examples of hyperpolarized 3He (cyan) overlaid on anatomical 1H (gray) MRI. The dark regions within the lung are regions which are not filled within a breath hold, and are termed ventilation defects. An increase in severity in COPD is related to an increase in ventilation defects.
Both 3He and 129Xe hyperpolarized gas MRI have been shown to be safe and reproducible measures.65-67 In COPD patients, 3He VDP is related to spirometry,68 symptoms and exercise capacity,69 CT based measurements of emphysema and patient exacerbations.70, 71
Ventilation defects have also been shown to be spatially related to structural observations
15
129Xe, as well as independent studies where the VDP was again shown to be related to
spirometry.73
It is important to note that despite each ventilation imaging technique relating to patient
measures, they all vary slightly on the physiology they are probing. There are known
differences between 3He and 129Xe,68, 74, 75 likely due to the density and viscosity of each gas allowing for different flow dynamics (based on Reynolds Numbers) in different calibre
airways. Differences between CT-derived ventilation and hyperpolarized gas imaging have
recently been reported,76 where a portion of the difference is likely a difference due to different breathing maneuvers. The majority of hyperpolarized gas imaging is based on
static breath-holds, whereas CT is based on volumes throughout the breathing cycle.
Texture Analysis in Medical Imaging
“Texture is an innate property of virtually all surfaces … It contains important
information about the structural arrangement of surfaces and their relationship to the
surrounding environment.” Haralick 1973.77
In medical imaging, texture analysis provides a quantitative method for describing patterns
within an image, which may relate to different underlying pathophysiological
determinants. Texture analysis has played a large role in the field of computer-aided
diagnosis, where biomedical images are mined for information reflecting underlying
pathophysiology which can then be used for the detection and diagnosis of disease.78 The rapid growth of the application of texture analysis and machine learning in medicine is
evident in Figure 1-8, where an exponential increase in PubMed search results are
16
Figure 1-8: PubMed results for thesis keywords.
Displaying the number of results sorted by year, displaying an indirect observation of the popularity of these methods.
1.6.1
Typical Work Flow
A typical workflow for texture analysis is outlined in Figure 1-9, where it includes image
acquisition, region of interest definition, feature extraction from the region of interest, and
feature analysis. The feature analysis can involve calculating which features are unique to
certain regions, or including features within a machine learning algorithm. Below, the
methods used for each of these steps are described, where segmentation and registration
can be used to define a region of interest, and feature selection and machine learning are
17
Figure 1-9: Typical workflow for texture analysis.
The typical workflow for texture analysis include image acquisition, region of interest definition, feature extraction then feature analysis. ROI=region of interest.
Segmentation
Medical image segmentation is the task of partitioning an image into multiple regions,
based on a specified similarity characteristic. The simplest segmentation is done manually,
where an observer outlines the structure desired. However, this method can be quite time
intensive, and leads to high variability depending on the observer. Due to this, medical
imaging has moved to semi-automated or automated segmentations. Segmentation of the
lung cavity is a relatively easy task because there is a distinct density difference between
lung tissue and other tissue. However, it is complicated by the presence of vasculature,
diseased tissue and differentiating the trachea from lung tissue.
The simplest computer aided segmentation approach is based on thresholding the image.
Thresholding partitions the image into different regions based on a set, or algorithmically
determined, signal intensity.79, 80 Another approach to segmentation is region growing techniques, which segments regions connected by intensity similarities. This can be
performed by manually, or automatically selecting a seed location, and growing the region
by iteratively adding neighboring pixels within a certain similarity criteria.81, 82 These methods have been employed to segment proton MRI thoracic cavity images previously.61 More advanced methods including watershed,83 clustering,84, 85 and model based techniques86 have also been employed. Many of these methods have been utilized to create automated lung segmentation algorithms as an integral step in computer-aided diagnosis
18
More recently, deep learning has been applied to medical image segmentation, with the
wide adoption of convolutional neural network architectures such as U-Net.90 U-Net is a
neural network architecture which gained popularity after outperforming other
segmentation tasks in multiple Grand Challenges. The U-Net architecture has also been
extended to be compatible with volumetric segmentation, versus 2-dimensional
segmentation, in a network referred to as V-Net.91 Converse to the previously described segmentation techniques, deep learning does not follow rule based segmentation, and
instead learns to identify features relevant to the specific segmentation task trained on
through backpropagation. One common limitation with deep learning for segmentation is
the necessity for large labeled datasets, which can be time consuming to curate or difficult
to attain. However, there are open source trained segmentation networks available on
repositories such as GitHub or NiftyNet92 which can be more simply applied to a specific segmentation task without needing to train an entire network.
Registration
Registration is often required to determine the ground truth for texture analysis, whether
that be registering MRI to histology, conventional to contrast-enhanced images, or
structural to functional images. There are different registration techniques including rigid,
affine and deformable. These techniques enforce limits on how the images can be moved
or warped to match the other image. Rigid registration allows only translations and
rotations of the moving image, and affine registrations maps parallel lines across the
images being registered. Deformable registration cannot be represented using a
transformation matrix, and instead creates local vector displacement fields to map the
images to the same space. The technique you choose will depend on the registration task,
where a rigid or affine registration is often sufficient if the images being registered are of
the same anatomical space. However, for registration of inherently different images,
deformable registrations may be more successful.
A simple registration technique is landmark based registration, where a user places
landmarks at the same anatomical location on the two images to be registered, and a
19
method has previously been developed for affine registration of hyperpolarized gas MRI
to anatomical proton MRI.61 More complex registration methods work to minimize a cost
function based on the similarity of the images being registered, or by matching segmented
surfaces. State-of-the-art registration algorithms used in medical imaging include the
demons registration93 and the modality independent neighbourhood descriptor (MIND) registration.94
Feature Extraction
To describe the underlying patterns within the image, feature extraction is performed. The
simplest features can be extracted from the histogram of values within the region of
interest. These first-order features include the mean, median, mode, standard deviation,
skewness and more. In CT imaging, these relate to the density, and include quantitative CT
measures discussed in Section 1.5.1 including the relative area less than a threshold value,
or the histogram percentile.
Despite containing information on the voxel values within a region of interest, first-order
features do not contain any information regarding the spatial distribution of voxels. To
overcome this, frequently used approaches are based on second-order statistics which
quantifies the relationship between voxels. Two of the most commonly used second-order
statistic features include gray level co-occurrence matrix (GLCM)77 and run length matrix
(RLM)95 derived features.96 The GLCM is populated by recording the number of times
gray-level values appear within proximity to each other, where the column and row indices
represent the pixel value, and the value within each element is the number of times the
pixel values appear next to each other. Therefore, a GLCM with large values close to the
diagonal represents an image that does not have many sharp edges. The RLM is populated
by recording the number of runs within an image, where the row indices are the pixel value
and the column indices are the length of a run, and the element value is the number of runs.
Therefore, a RLM with most values in the first columns indicates an image which is very
heterogeneous in appearance.
Many further texture features may be calculated, including filter based methods, local
20
use cases and properties of each of these features are presented in a review of
three-dimensional texture features in medical imaging.96
To account for noise, and reduce the size of the matrices, values must be binned to create
both RLM and GLCM. If this is not performed, there would be virtually zero runs within
the RLM, as there would be a very small chance of the exact same value appearing. A
similar problem would be observed within the GLCM. The width of the bin will be a
determinant of how well the features describe the region of interest; if the bin width is too
small, the features will be noisy, whereas if it is too large you will not be sensitive to
differences which may be physiologically relevant. The bin width is therefore a parameter
that should be carefully chosen and is often experimentally determined to address what is
best for the specific task. To address these problems, filtering and smoothing of the image
may also be performed.
More recently, with the advances made possible from improvements in hardware and
software, deep neural networks have been widely adopted in medical image analysis. The
most popular method for deep learning, a subtype of machine learning, is using
convolutional neural networks (CNN). Conceptually, CNN are iteratively trained to learn
abstractions of images from low level (such as edges and corners), to high level (such as
shapes and concepts) features. These abstractions are learned and stored in filter banks,
which are specially tuned to the type of image the CNN was trained on. As discussed,
texture analysis aims to describe underlying patterns in an image, and in the same way,
filter banks from a CNN quantify patterns observed. The largest difference between the
methods is that texture analysis relies on hand crafted features, whereas deep learning
automatically learns features which are relevant to a task, and typically has much greater
capacity for abstraction. Further, the filter banks and features generated from a CNN do
not require the next two steps (feature selection and machine learning for classification),
as the last layer of a CNN generates class labels. However, a limitation to deep learning is
the requirement of a large amount of training data, and the computational complexity of
21
Feature Selection
Feature selection aims to minimize the subset of features used from the original set of
extracted features, such that the generalizability of the model is maximized. There are many
factors that must be considered when choosing which features to use, including the size of
the dataset you have. It has been observed the error of a classifier decreases and then
increased as the number of features included increase.97 There have been different studies into the optimal number of features to include, however the consensus is the number varies
largely depending on the task.98
Methods to perform feature selection include forward selection and backward selection. In
forward selection, features are iteratively added to the model based on the feature which
increases the performance metric the most, whereas backward selection starts with the
entire set of features and iteratively removes features which leaves the highest performing
model. Further methods include dimension reduction by using tools such as principle
component analysis or independent component analysis which aim to explain variance
within the data, however, the interpretability of the features can be complicated while using
these approaches. It is also important to select features which will be steady in different
circumstances; for example, it is undesirable to include features that are highly dependent
on user input, such as a segmentation. As such, a step can be included to select only features
which are steady through different observer segmentations. To do this, a metric such as the
intraclass correlation coefficient (ICC) may be used to compare the ranking of features
across different segmentations.
Machine Learning
Once features are chosen to represent an image, or region in an image, machine learning
can be used to determine how to combine the information from different features to
minimize a cost function. The simplest example of this is a linear regression, where you
want to minimize the sum of the squares of the distance from the line of best fit to each
data point. When you have more than one feature, this task becomes more complicated.
Machine learning approaches can generally be classified as supervised, or unsupervised
22
of features, without knowing an associated label for each cluster. Supervised approaches
look to separate the feature space based on a label associated with each data point. Popular
supervised machine learning algorithms used in medical imaging include logistic
regression, linear discriminants, support vector machines, decision trees and neural
networks.99
A logistic regression is used for classification problems by estimating the probabilities for
each class using a logistic function, also known as a sigmoid function, as the activation
function which maps your algorithm value to a probability between [0, 1]. To train a
logistic regression, the cross-entropy cost function is typically used. Similarly, a support
vector machine aims to find the hyperplane which separates two classes, while maximizing
the distance from the plane to each of the closest points, or support vectors. In cases which
the data are not linearly separable, a non-linear kernel can be used to map the data to a
linear space, as well as an application of a soft-margin. To train a support vector machine,
the cost function rewards being at least one unit away from zero in the cost space, which
aims to minimize the data points which lay within a margin to the separating hyperplane.
Due to the inclusion of distance to points in space in the cost function, standardization or
normalization of the features is an important pre-processing step. Standardization is
performed by subtracting the feature mean and dividing by the standard deviation, while
normalization is performed to rescale all data to the range of [0, 1]. Other classifiers include
decision trees which learn decision rules for each feature to classify based on features,
nearest neighbor, which classifies based on how similar a data point is to previously
observed data, and a neural networks train to learn the combination of features and weights
to predict the class. Each of these have different underlying algorithms, but all aim to
minimize a cost function, such that when presented with a new data point they can predict
the associated label as accurately as possible.
1.6.2
Challenges and Limitations
One of the largest challenges in texture analysis for medical imaging is deciding which of
the methods discussed in Section 1.6.1 to implement. As is evident, there are a high number
23
learning methods. There is no standard combination that is the “best” to employ due to the
fact that each medical image analysis problem is unique. Therefore, one of the most
important parts of any texture analysis or machine learning project is managing the dataset
to be able to validate and eventually test your specific method. If done correctly, a training,
validation and testing split allows for confidence in the performance of the model created.
For example, many machine learning methods may be used to generate a model from the
training set, then be applied to the validation set. The highest performing model as
determined on the validation set, can then be applied to the testing set to report the overall
performance of the model generated. This ensures a decision on the best machine learning
algorithm was determined experimentally, greatly reducing the likelihood the final model
has been over fit to the data.
Another important challenge is the generalizability of the models created using texture
analysis. To obtain the best results, homogenous collection of the data is desired, where
the same imaging protocol is employed across all subjects. However, to translate the model,
differences across sites must be understood and considered. It is known the protocol
parameters (slice thickness, voxel spacing), reconstruction kernel, and scanner vendor all
effect texture features.100-102 The robustness of features across different scanners can be
studied, including measuring feature robustness as a metric within feature selection. There
is also recent work being done to standardize features across scanners.103
1.6.3
Applications in Lung Imaging
Computer-aided diagnosis has been around since before the digitization of medical images,
where a pattern recognition approach was introduced to preprocess images, extract features
and perform classification.104 Within lung imaging, a large number of studies applied feature analysis to chest x-ray images in a series of studies on “Image feature analysis and
computer-aided diagnosis in digital radiography” from Dr. MacMahon and colleagues.
105-112
More recently, texture analysis has been applied to CT images for the detection and
24
analyze the parenchymal tissue.117, 118 Texture analysis has also been applied to create
automated lung disease classification, including fibrosis,119 pneumonia120 and obstructive
lung disease such as emphysema.121-125 All of these studies employed slightly different approaches to texture analysis, with different ground truths, however demonstrate the
ability of texture analysis to capture important information within thoracic CT images.
Thesis Hypotheses and Objectives
Hyperpolarized gas MRI has been used to provide unique functional information in patients
with COPD, and has been shown to relate to important patient outcomes and have the
potential to guide treatment. Unfortunately, this specialized information is currently limited
to a small number of research centres due to the high cost of hyperpolarization equipment
and gas. This is converse to widely available thoracic CT, which provides high-resolution
anatomical images. The overarching objective of this thesis is to use texture analysis and
machine learning to generate the functional information contained within hyperpolarized
gas MRI, from a single-volume, non-contrast enhanced thoracic CT. To do this,
hyperpolarized gas MRI were registered to thoracic CT to provide the ground truth training
label. First and second order features were then extracted from each volume of interest,
which were used to create a machine learning model. We hypothesized that the structural
information contained within a single-volume breath hold CT can inform on regional lung
function. This hypothesis has a basis in previous observations using thoracic CT, such as
the airway and vasculature changes associated with COPD, and the previously reported
spatial overlap between CT emphysema measures and ventilation defects. The objective
of Chapter 2 was to development a texture analysis pipeline, and apply the pipeline is a
small cohort as proof-of-concept.
The objectives in Chapter 3, were to apply improve upon the methods developed in Chapter
2, and apply this pipeline in a larger set of patients. To do this texture features, the volume
of interest size, and the sampling method were optimized within the training set of this
cohort. The optimal performing model was then applied in the testing set of 27 participants.
25
quantitatively relate to ground truth MRI ventilation maps, as well as important clinical
measures.
In Chapter 4, I provide a summary of the impact and conclusions from Chapter 2 and 3, as
well as discuss limitations and future steps to build upon the research presented in this
26
References
1. Mathers CD, Loncar D. Projections of global mortality and burden of disease from 2002 to 2030. PLoS Med. 2006;3(11):e442.
2. Lozano R, Naghavi M, Foreman K, et al. Global and regional mortality from 235 causes of death for 20 age groups in 1990 and 2010: a systematic analysis for the Global Burden of Disease Study 2010. Lancet. 2012;380(9859):2095-128.
3. Vogelmeier CF, Criner GJ, Martinez FJ, et al. Global Strategy for the Diagnosis, Management, and Prevention of Chronic Obstructive Lung Disease 2017 Report. GOLD Executive Summary. Am J Respir Crit Care Med. 2017;195(5):557-82.
4. Health Indicators 2008. Ottawa: Canadian Institute for Health Information, 2008. Report No.
5. Chapman KR, Bourbeau J, Rance L. The burden of COPD in Canada: results from the Confronting COPD survey. Respir Med. 2003;97 Suppl C:S23-31.
6. Jost RG, Sagel SS, Stanley RJ, Levitt RG. Computed tomography of the thorax. Radiology. 1978;126(1):125-36.
7. Rosenblum LJ, Mauceri RA, Wellenstein DE, Bassano DA, Cohen WN, Heitzman ER. Computed tomography of the lung. Radiology. 1978;129(2):521-4.
8. Goddard PR, Nicholson EM, Laszlo G, Watt I. Computed tomography in pulmonary emphysema. Clin Radiol. 1982;33(4):379-87.
9. Bergin C, Muller N, Nichols DM, et al. The diagnosis of emphysema. A computed tomographic-pathologic correlation. Am Rev Respir Dis. 1986;133(4):541-6.
10. Foster WL, Jr., Pratt PC, Roggli VL, Godwin JD, Halvorsen RA, Jr., Putman CE. Centrilobular emphysema: CT-pathologic correlation. Radiology. 1986;159(1):27-32.
11. West J, Luks A. Respiratory Physiology: The Essentials Wolters Kluwer; 2016.
12. Ochs M, Nyengaard JR, Jung A, et al. The number of alveoli in the human lung. Am J Respir Crit Care Med. 2004;169(1):120-4.
13. Hogg JC. Pathophysiology of airflow limitation in chronic obstructive pulmonary disease. Lancet. 2004;364(9435):709-21.
14. Woods JC, Choong CK, Yablonskiy DA, et al. Hyperpolarized 3He diffusion MRI and histology in pulmonary emphysema. Magn Reson Med. 2006;56(6):1293-300.
27
16. Weibel ER. Principles and methods for the morphometric study of the lung and other organs. Lab Invest. 1963;12:131-55.
17. Heemskerk-Gerritsen BA, Dijkman JH, Ten Have-Opbroek AA. Stereological methods: a new approach in the assessment of pulmonary emphysema. Microsc Res Tech. 1996;34(6):556-62.
18. Wiebe BM, Laursen H. Lung morphometry by unbiased methods in emphysema: bronchial and blood vessel volume, alveolar surface area and capillary length. APMIS. 1998;106(6):651-6.
19. Hogg JC, Macklem PT, Thurlbeck WM. Site and nature of airway obstruction in chronic obstructive lung disease. N Engl J Med. 1968;278(25):1355-60.
20. Reid L. Measurement of the bronchial mucous gland layer: a diagnostic yardstick in chronic bronchitis. Thorax. 1960;15:132-41.
21. Thurlbeck WM, Angus GE. A Distribution Curve for Chronic Bronchitis. Thorax. 1964;19:436-42.
22. Dunnill MS, Massarella GR, Anderson JA. A comparison of the quantitative anatomy of the bronchi in normal subjects, in status asthmaticus, in chronic bronchitis, and in emphysema. Thorax. 1969;24(2):176-9.
23. Mitchell RS, Stanford RE, Johnson JM, Silvers GW, Dart G, George MS. The morphologic features of the bronchi, bronchioles, and alveoli in chronic airway obstruction: a clinicopathologic study. Am Rev Respir Dis. 1976;114(1):137-45.
24. Vestbo J, Prescott E, Lange P. Association of chronic mucus hypersecretion with FEV1 decline and chronic obstructive pulmonary disease morbidity. Copenhagen City Heart Study Group. Am J Respir Crit Care Med. 1996;153(5):1530-5.
25. Crapo RO. Pulmonary-function testing. N Engl J Med. 1994;331(1):25-30.
26. Quanjer PH, Stanojevic S, Cole TJ, et al. Multi-ethnic reference values for spirometry for the 3-95-yr age range: the global lung function 2012 equations. Eur Respir J. 2012;40(6):1324-43.
27. Miller MR, Hankinson J, Brusasco V, et al. Standardisation of spirometry. Eur Respir J. 2005;26(2):319-38.
28. Wanger J, Clausen JL, Coates A, et al. Standardisation of the measurement of lung volumes. Eur Respir J. 2005;26(3):511-22.