© 2014, IJCSMC All Rights Reserved 487 Available Online at www.ijcsmc.com
International Journal of Computer Science and Mobile Computing
A Monthly Journal of Computer Science and Information Technology
ISSN 2320–088X
IJCSMC, Vol. 3, Issue. 1, January 2014, pg.487 – 494
RESEARCH ARTICLE
Performance Analysis of Image Fusion
Algorithms using HAAR Wavelet
Deepika.L
1, Mary Sindhuja.N.M
21
PG Student, Department of Electronics and Communication Engineering, Kamaraj College of Engineering and Technology, Anna University, Tamilnadu, India
2
Assistant Professor, Department of Electronics and Communication Engineering, Kamaraj College of Engineering and Technology, Anna University ,Tamilnadu, India,
1
[email protected], 2 [email protected]
Abstract- Image Fusion is a technique used to integrate information from multiple images such that the fused image is suitable for processing tasks. Medical image fusion is used to derive useful information from Medical image. The basic idea is to improve the content of an image by fusing images like Computer Tomography (CT) and Magnetic Resonance Imaging (MRI) images. The proposed method use the Discrete Wavelet based fusion algorithms on medical image fusion of CT and MRI, implementation of fusion rules and the fusion image quality evaluation. Therefore the fused image has the information which is useful for human or machine perception. The fused image with such rich information will improve the performance of image analysis algorithms for medical applications. The fusion performance is done using Entropy, the Root Mean Square Error (RMSE) and Peak Signal to Noise Ratio (PSNR).
Keywords- Medical image fusion; Discrete Wavelet transform; Fusion rule; Performance evaluation; Entropy; Root Mean Square Error; Peak Signal to Noise Ratio
I. INTRODUTION
© 2014, IJCSMC All Rights Reserved 488
In this paper, a novel approach for the fusion of computed tomography (CT) and Magnetic Resonance Images (MR) images based on wavelet transform has been presented. Different fusion rules are then performed on the Discrete Wavelet coefficients of low and high frequency portions. The registered Computer Tomography (CT) and magnetic resonance imaging (MRI) images of the same people and same spatial parts have been used for the analysis.
II. DISCRETE WAVELET TRANSFORM BASED IMAGE FUSION
The concept and theory of wavelet-based multiresolution analysis came from Mallet. The wavelet transform is a mathematical tool that can detect local features in a signal process. It also can be used to decompose two dimensional (2D) signals such as 2D gray-scale image signals into different resolution levels for multiresolution analysis Wavelet transform has been greatly used in many areas, such as texture analysis, data compression, feature detection, and image fusion.
2.1 Wavelet Transform
Wavelet transforms provide a framework in which a signal is decomposed, with each level corresponding to a coarser resolution or lower frequency band and higher frequency bands. The Discrete Wavelet Transform (DWT), which applies a two- channel filter bank (with down sampling) iteratively to the low pass band (initially the original signal). The wavelet representation consists of the low-pass band at the lowest resolution and the high-pass bands obtained at each step. This transform is invertible and non
-
redundant. In wavelet analysis, wavelet transform divides the image signal into wavelets representingeach pixel of the original image as coefficients.Discrete Wavelet Transform can be obtained by multiplying wavelet functions ψ(t) and scaling function φ(t).( ) = (2 − ) (1) ( ) = (2 − ) (2)
Fig.1 Wavelet Transform based image fusion
© 2014, IJCSMC All Rights Reserved 489
Fig.2 Subband Distribution of Discrete Wavelet Transform for level
2.2 Haar Wavelet Transform
The Haar transform is one of the simplest Wavelet Transforms. The attracting features of the Haar transform, including fast for implementation and used in computer engineering applications, such as signal and image compression. Haar wavelet is a sequence of rescaled "square-shaped" functions which together form a wavelet family or basis. Wavelet analysis is similar to Fourier analysis in that it allows a target function over aninterval to be represented in terms of an orthonormalfunction basis. The Haar sequence is now recognized as the first known wavelet basis.
The Haar wavelet's mother wavelet function ( ) can be described as
( ) =
1 0≤ < 1/2,
−11/2≤ < 1,
0 otherwise
(3)
Its Scaling Function ( ) can be described as
( ) = 1 0≤ < 1,
0 otherwise (4)
2.3 MRI and CT Analysis
The paper forms fused images of CT and MRI image. Fused images can be created by combining information from multiple modalities, such as Magnetic Resonance Image (MRI) and Computed Tomography (CT).CT images are used more often to ascertain differences in tissue density depending upon their ability to block X-rays while MRI provides good contrast between the different soft tissues of the body, which make it especially useful in detecting brain tissues, and cancers. The fused image from multiple images produce an image which contains combined complementary and redundant information provided by both the source images i.e. the size of the tumor, the location through the various pixel values of the gray scale images, hence resulting into better visibility of tumor.
III. IMAGE FUSION ALGORITHMS
The set of image fusion algorithms used to obtain an image with every object in focus, a multi-focus image fusion is required to fuse the images, giving a better view for human or machine perception. The image fusion methods used in the proposed work are discussed below:
3.1 Simple Average method
© 2014, IJCSMC All Rights Reserved 490
3.2 Maximum selection method
For every corresponding pixel in the input images, the pixel with the Maximum intensity is selected. The resultant pixel is used to obtain a fused image. Resulting in highly focused image output obtained from the input image as compared to average method.
3.3 Minimum selection method
For every corresponding pixel in the input images, the pixel with the Minimum intensity is selected. The resultant pixel is used to obtain a fused image. Images with dark shades would generate a good fusion image with this method.
3.4 Principal Component Analysis
Principal component analysis (PCA) is a vector space transform often used to reduce multidimensional data sets to lower dimensions for analysis. PCA algorithm involves the following steps for fusion.
1. Generate the column vectors, from the input image matrices.
2. Calculate the covariance matrix of the two column vectors formed in 1
3. The diagonal elements of the 2x2 covariance vector should contain the variance of each column vector with itself. 4. Calculate the Eigen values and the Eigen vectors of the covariance matrix
5. Normalize the column vector corresponding to the larger Eigen value by dividing each element with mean of the Eigen vector. 6. The values of the normalized Eigen vector act as the weight values which are respectively Multiplied with each pixel of the input images.
7. Sum of the two scaled matrices calculated in step 6 will be the fused image matrix.
3.5 Laplacian Pyramid method
An image pyramid consists of a set of low pass or band pass copies of an image, each copy representing pattern information of a different scale. The idea is to construct the pyramid transform of the fused image from the pyramid transforms of the source images, and then inverse pyramid transform is performed to obtain the fused image.
The three major phases for pyramid transform are
Decomposition
Formation of the initial image for recomposition.
Recomposition
Decomposition is the process where a pyramid is generated successively at each level of the fusion. The number of levels of fusion is pre decided. Recomposition is the process in which the resultant image is finally developed from the pyramids formed at each level of decomposition.
The Laplacian pyramid method steps are discussed below. 1. Perform Low pass filtering using
2. w=1/16’, 4/16’, 6/16’, 4/16’, 1/16
3. Subtract the low pass filtered input images and form the pyramid.
4. Decimate the input image matrices by halving the number of rows and columns (we did by neglecting every alternate row and column).
a. The recomposition phase would include steps:
5. Undecimate the image matrix by duplicating every row and column. 6. Perform Low pass filtering with 2*W.
© 2014, IJCSMC All Rights Reserved 491
IV. PERFORMANCE METRICS
Image fusion performance can be divided into two categories one with and one without reference images. In the present work, the performance measures are used to evaluate the performance of various fusion methods such as Simple average Method , Maximum Selection Method , Minimum Selection Method. MR and CT images are taken as the reference image in the calculation of performance metric values.
4.1 Entropy (H)
The Entropy (H) is the measure of information content in an image. The maximum value of entropy can be produced when each gray level of the whole range has the same frequency. If entropy of fused image is higher than parent image then it indicates that the fused image contains more information.
=− ∑ ( ) log ( ) (5) where p(g) parent image.
4.2 Root Mean Square Error (RMSE)
A commonly used reference based assessment metric is the Root Mean Square Error (RMSE). The RMSE between a reference image, R, and a fused image, F, is given by the following equation:
= 1/ ∑∑( ( , )− ( , ))² (6)
where R(m,n) and F(m,n) are the reference (CT or MR) and fused images, respectively, and M and N are image dimensions. Smaller the value of the RMSE, better the performance of the fusion algorithm.
4.3 Peak Signal to Noise Ratio (PSNR)
PSNR is the ratio between the maximum possible power of a signal and the power of corrupting noise that affects the fidelity of its representation. The PSNR of the fusion result is defined as follows:
= 10 × log ( )
( ) (7)
where fmax is the maximum gray scale value of the pixels in the fused image. Higher the value of the PSNR, better the performance of the fusion algorithm.
V. EXPERIMENTAL RESULTS
MR and CT images are taken as the source images.Figure.3 (a) shows the bone information and Figure.3 (b) displays the soft tissues information.
© 2014, IJCSMC All Rights Reserved 492
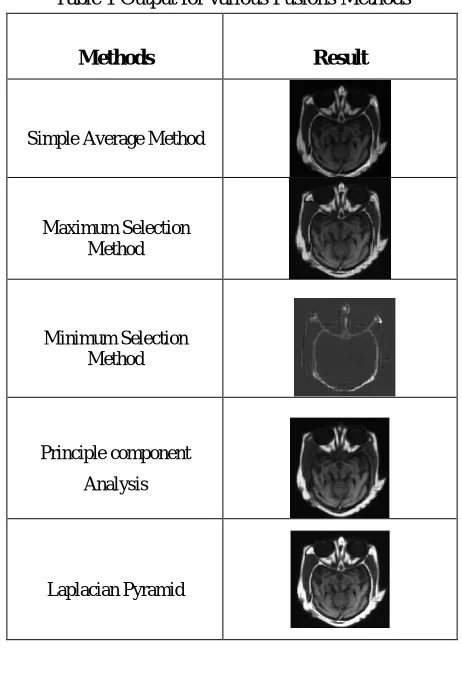
Table 1 Output for various Fusions Methods
Methods Result
Simple Average Method
Maximum Selection Method
Minimum Selection Method
Principle component
Analysis
Laplacian Pyramid
Table 2 Image Fusion Metrics
Methods
Entropy RMSE
PSNR
Simple Average 8.6800
0.04 28.89
Maximum
Selection
10.1291 0.05 30.81
Minimum
Selection
© 2014, IJCSMC All Rights Reserved 493 Principle
Component
Analysis
10.090
0.04
28.94
Laplacian
Pyramid
12.66337 0.03 57.922
VI. CONCLUSION
Image fusion seeks to combine information from different images. It integrates complementary information to give a better visual picture of a scenario, suitable for processing. Wavelet transform provide a framework in which an image is decomposed, with each level corresponding to a coarser resolution band. The wavelet sharpened images have a very good spectral quality. Thus the two different modality images are fused using the various fusion rules based on the Discrete Wavelet Transform. Moreover the difference in performance of the various fusion methods is clearly exhibited using three performance measures.
REFERENCES
[1] T.S.Anand, K.Narasimhan, P.Saravanan “Performance Evaluation of Image Fusion Using the Multi-Wavelet and Curvelet Transforms” IEEE - International Conference On Advances In Engineering, Science And Management(ICAESM-20 12) March 2012
[2] CYN Dwith ,Vivek Angoth,Amarjot Singh “ Wavelet Based Image Fusion for Detection of Brain Tumor “I.J. Image, Graphics and Signal Processing, 2013 .
[3] Kiran Parmar, Rahul K Kher, Falgun N Thakkar “Analysis of CT and MRI Image Fusion using Wavelet Transform” International Conference on Communication Systems and Network Technologies 2012.
[4] R.J.Sapkal, S.M.Kulkarni “Image Fusion based on Wavelet Transform for Medical Application” International Journal of Engineering Research and Applications ISSN: 2248-9622 Vol. 2, Issue 5, September- October 2012.
[5] Shivsubramani Krishnamoorthy, K.P.Soman“Implementation and Comparative Study of Image Fusion Algorithms” International Journal of Computer Applications (0975 8887) Volume 9– No.2, November 2010.
[6] Zhang, Y., Hong, “An IHS and wavelet integrated approach to improve pan-sharpening visual quality of natural colour “IKONOS and QuickBird images. Information Fusion 6 (3), 2005.
[7] M. Sonka, J. M. Fitzpatrick: "Handbook of Medical Imaging -Processing and Analysis" I.N. IEEE Trans. Med. Imaging 20(3), 2001.
[8] Yijian Pei, Jiang Yu, Huayu Zhou, Guanghui Cai, ”The Improved Wavelet Transform Based Image Fusion Algorithm And The Quality Assessment”,3rd IEEE International Congress on Image and signal processing,2010.
© 2014, IJCSMC All Rights Reserved 494
[10] Yong Chai,You He, Chalong Ying,”Ct and MRI Image Fusion Based on Contourlet Using a Novel Rule”, IEEE Trans on medical imaging,vol 08,No 3.2008
[11] Sekhar, Prasad, M.N.G, "A novel approach of image fusion on MR and CT images using wavelet transforms ",International Conference on Electronics Computer Technology, vol.4,2011.
[12] Se-Hwan Yun; Jin Heon Kim; Suki Kim," Image enhancement using a fusion framework of histogram equalization and Laplacian pyramid",lEEE Transactions on Consumer Electronics,voL56,2011.
[13] Lijun Liu; Hui Zhang ,"Application on Image Fusion Based on Balanced Multi-Wavelet ", International symposium on IntelligenceInformation Processing and Trusted Computing (IPTC),2010.
[14] Liu Wei,"An image coding method based on multi wavelet transform",4th International Conference on Image and Signal Processing ,voL2,2011.