International Journal of Research in Advent Technology, Vol.4, No.4, April 2016
E-ISSN: 2321-9637
Available online at www.ijrat.org
339
Modeling and Simulation of Solar and Wind Hybrid
Power System Using Matlab
Vipul S. Gaigol
1, Dhiraj L. Gahukar
2,Vaibhav S.Naik
3, Abhilash M.Jaisingpure
4Student,Electrical (E&P)Engg., DES'scoet Dhamangaon(RLY), [email protected] Student,Electrical (E&P)Engg., DES'scoet Dhamangaon(RLY), [email protected]
Student,Electrical(E&P)Engg,DES’scoet Dhamangaon(RLY), [email protected] Student,Electrical(E&P)Engg, DES’scoet Dhamangaon(RLY), [email protected]
Abstract- The solar energy technology, photovoltaic (PV) and wind show the greatest obligation universal adoption
and application. In this paper we introduced a hybrid energy system with attached both solar and wind as an choice for conventional source of electrical energy.This paper focuses on modelling and analysis of a photovoltaic and wind energy hybrid, system under different condition using MATLAB. PV array are extracting maximum energy from sun irradiation by using perturb and observe algorithm of maximum power point tracker (MPPT)and by using kinetic energy of wind, turbine is rotate and energizes the generator and electric powergenerated from this connected to grid. For visual retrieve Sim Power System tool of MATLAB are used for simulation.
Keywords: Photovoltaic module, hybrid power system, MPPT, MATLAB/Simulink.
1: INTRODUCTION:
.
Due to the disastrous condition of industrial fuels which include oil, gas and others, the growth of renewable energy sources is persistently improving. From this reason renewable energy sources have become very important these days. Few other reasons include advantages like large availability in nature, eco-friendly and recyclable. There are different renewable energy sources like solar, wind,geothermal,ocean , tidal are there. In these renewable sources solar and wind energy are the world’s fastest growing energy resources. With no emission of pollutants, energy conversion is done through renewable wind and PV(photovoltaic) cells. In order to reduce conversion losses from sources to loads and raise energy efficiency, micro-grid (standalone) is proposed and had been an important research direction.
All the energy sources are simulated using MATLAB/ SIMULINK as software tools. The simulation results prove the probability and reliability of the system. The hybrid system consist of two renewable sources such as wind and solar energy. A Wind Turbine (WT) converts mechanical energy in to electrical energy and it produces ac output voltage and is converted to dc output by using rectifier. A PV cell are converts light energy into electrical energy and it produces dc output voltage. In order to maintain
constant dc- link voltage, to regulate outputs from the wind and solar systems by using dc-dc boost converter.
Before developed the hybrid electric system for a specific place, we know the particular energy demand and the resources available at that place. Therefore, energy planners must study the solar energy, wind, and other potential resources at the site, in addition to the energy demand. Solar energy is the most promising of the renewable energy sources in view of its apparent limitless potential. Hybrid systems give the high level of energy security through the hybrid of generation methods and often will incorporate a storage system. Wind turbines & Solar panels are the most well-known of the renewable energy devices used in hybrid power systems .However with all these advantages electric power system consisting of solar and wind as a primary sources poses some technical difficulties also due to uncontrollable weather data like wind speed fluctuation and to the day & night , summer & winter sun conditions. As a consequence of this the power supply continuity should maintained by or backed up by alternate reliable and non-fluctuant energy sources.
2: SYSTEM DESCRIPTION:
2.1: PV Generation System
:(Rsh) and series resistance (Rs). The PV sizing variable comprises of size of a PV Panel and the number of strings in a PV array. The necessary number of PV panels to be connected in the series is derived by the number of Panels need to match t
voltage. The output of PV panels must include the input of geographic location such as irradi
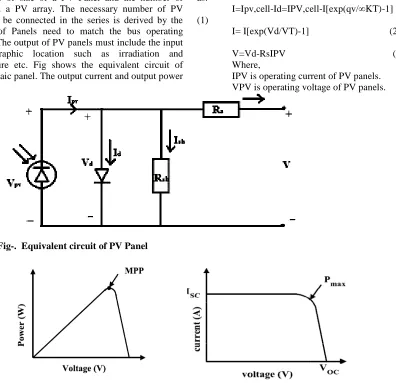
[image:2.595.108.504.157.540.2]temperature etc. Fig shows the equivalent circuit of Photovoltaic panel. The output current and output power
Fig-. Equivalent circuit of PV Panel
Fig :PV and VI characteristics o
2.2:Maximum Power Point Tracking
In the Power Vs Voltage characteristic
module shown in fig we can observe that there exist single maxima i.e. a maximum power point associated with a specific voltage and current that are supplied. The overall efficiency of a module is very low aroun 12%. So it is necessary to operate it at the crest power point so that the maximum power can be provided to the load irrespective of continuously changing environmental conditions. This increased power makes it better for the use of the solar PV module.
converter which is placed next to the PV module extracts maximum power by matching the impedance of the circuit to the impedance of the PV module and (Rsh) and series resistance (Rs). The PV sizing variable comprises of size of a PV Panel and the number of strings in a PV array. The necessary number of PV panels to be connected in the series is derived by the number of Panels need to match the bus operating voltage. The output of PV panels must include the input of geographic location such as irradiation and shows the equivalent circuit of Photovoltaic panel. The output current and output power
of Photovoltaic panels at any time’s’ can be calculated as:
I=Ipv,cell-Id=IPV,cell (1)
I= I[exp(Vd/VT)-1] (2)
V=Vd-RsIPV (3) Where,
IPV is operating current of PV panels. VPV is operating voltage of PV panels
. Equivalent circuit of PV Panel
Fig :PV and VI characteristics of PV module
Maximum Power Point Tracking(MPPT)
the Power Vs Voltage characteristic of a PV we can observe that there exist single maxima i.e. a maximum power point associated with a specific voltage and current that are supplied. overall efficiency of a module is very low around 12%. So it is necessary to operate it at the crest power point so that the maximum power can be provided to the load irrespective of continuously changing environmental conditions. This increased power makes it better for the use of the solar PV module. A DC/DC converter which is placed next to the PV module extracts maximum power by matching the impedance of the circuit to the impedance of the PV module and
transfers it to the load. Impedance matching can be done by varying the duty cycle of the switchin elements.Maximum power point tracing (MPPT) system is an electronic control system that can be able to coerce the maximum power from a PV system. It does not involve a single mechanical component that results in the movement of the modules changing their
and make them face straight towards the sun. MPPT control system is a completely electronic system which can deliver maximum allowable power by varying the operating point of the modules electrically.
2.3: Boost Converter:
340 ny time’s’ can be calculated
Id=IPV,cell-I[exp(qv/∞KT)-1]
1] (2)
RsIPV (3)
IPV is operating current of PV panels. is operating voltage of PV panels.
transfers it to the load. Impedance matching can be done by varying the duty cycle of the switching Maximum power point tracing (MPPT) system is an electronic control system that can be able to coerce the maximum power from a PV system. It does not involve a single mechanical component that results in the movement of the modules changing their direction and make them face straight towards the sun. MPPT control system is a completely electronic system which can deliver maximum allowable power by varying the
International Journal of Research in Advent Technology, Vol.4, No.4, April 2016
E-ISSN: 2321-9637
Available online at www.ijrat.org
341 A Boost converter is a switch mode DC to DC
converter in which the output voltage can be transformed to a level greater than the input voltage. The magnitude of output voltage depends on the duty cycle of the switch. It is also called as step up converter. The name step up converter comes from the fact that analogous to step up transformer the input voltage can be stepped up a level greater than the input voltage. By law of conservation of energy the input power has to be equal to output power (assuming no losses in the circuit).
Input power (Pin) = output power (Pout)
2.4:The Electrical Power Generated By Wind
Turbine:
The electrical power generated by the wind turbine is given by:
ܲݓ =10 2 ܥߩܣݒଵ
ଷ
Where, Pw is power extracted from wind turbine with changes in wind speed, Ce is the fraction of upstream wind power, which is captured by the rotor blades and has theoretical maximum value of 0.59, it is also referred to as the power coefficient of rotor or rotor efficiency.V1 is the wind velocity in m/s, ρ is the air density in (kg/m3) and A is the area swept by the rotor blades in (m2). V is the wind speed in m/s (find in data table) ρ is the density and equals to 1.225kg/m3 (constant) Ce = 0.59 (constant) .A = 9.6m2 (constant)
3. MODELING OF SOLAR AND WIND HYBRID SYSTEM
Fig: Modeling of solar and wind hybrid power system
342
Fig:-simulation waveform of hybrid power system
International Journal of Research in Advent Technology, Vol.4, No.4, April 2016
E-ISSN: 2321-9637
Available online at www.ijrat.org
343
Fig:- Simulation waveform of active power and reactive power
5: CONCLUCTION:
The solar and wind energy sources are the renewable energy sources.They are reduce the pollution and bigger contribution of global warming and it is more energy efficient. A complete model simulating the proposed hybrid solar and wind system done using MATLAB simulation .The MPPT controller is developed for only solar energy resources. From the simulation result we can say that the solar and wind hybrid system is more reliable for electric power generation and better performance.
REFERENCES
[1]F. Liu, Y. Kang, Y. Zhang and S. Duan, “Comparison of P&O and hill climbing MPPT methods for grid-connected pv converter,” IEEE, pp. 804-807, 2008.
[2] Nevzat Onat, “Recent Developments in Maximum Power Point Tracking Technologies for Photovoltaic Systems”, Hindawi Publishing
Corporation International Journal of
Photoenergy,Volume 2010, Article ID 245316, 11 pages.
[3] S. Meenakshi, K.Rajambal, S. Elangovan “Intelligent controller for stand-alone hybrid generation system,” IEEE, May. 2006.
[4] M. G. Villalva, J. R. Gazoli, E. Ruppert F, "Modeling and circuit-based simulation of photovoltaic arrays", Brazilian Journal of Power Electronics, 2009 vol. 14, no. 1, pp. 35--45, ISSN 1414-8862.