International Journal of Emerging Technology and Advanced Engineering
Website: www.ijetae.com (ISSN 2250-2459,ISO 9001:2008 Certified Journal, Volume 4, Issue 6, June 2014)
531
Detection of TV Commercials using SIFT & Phase
Correlation
Rasika M. Thool
1, Prof. Pooja P. Gundewar
2 1,2Dept. of Electronics and Telecommunication, MIT College of Engineering, Pune, India
Abstract-Image matching is a fundamental aspect of many problems in computer vision including object or scene recognition. In this paper, Scale invariant feature transform (SIFT) algorithm and Phase correlation are used to detect the TV commercials and to switch from one recorded TV show to another recorded show. SIFT features are first extracted from set of reference video and stored in database. A database image or new image is matched by individually comparing each frame from the recorded video. SIFT is an image local feature description algorithm based on scale-space. Due to its strong matching ability, SIFT has many applications in different fields. Features of SIFT are also robust to change in invariance. Phase correlation is a method of image registration. This method helps in identifying the particular part of the image frame. Template matching is an efficient tool which is required for the image registration and the object tracking applications.
Keywords- TV commercials, SIFT, Phase Correlation
I. INTRODUCTION
The ever-growing television broadcast market has spawned a second industry, one that tracks advertising activity in across a variety of media. This information is valuable for competitive marketing analysis, advertising planning, and as a barometer for the advertising industry health. [4]In order to carry out a successful marketing campaign it is important to monitor the commercials of competitors and plan television/cable advertising accordingly. This can be done by hiring employees to watch broadcasts 24 by 7 and manually record new commercials as they appear. Given the large number broadcasters and channels, the cost of this approach is error prone and prohibitively expensive.[2]
TV commercials play an important role in our lives. There are many objectives for automatic TV commercial detections. Author summarizes four points to explain the motivations and potential applications of TV commercial video segmentation, indexing and identification.
Firstly, many companies in marketing research and advertisement are interested in identifying commercial breaks from live TV streams. They may want to verify if a TV commercial has actually been broadcasted as contracted and they may also want to know how their competitors are conducting their advertisements.
It is highly desirable to have an efficient system for automatic recognition of TV commercials and storing the recognized advertisements in a video database, which can be retrieved based on video content or textual information from the database when requested. Secondly, many audiences do not like TV commercials.[1]-[3]
They may want to record and watch TV programs and exclude TV commercials. With the advancement of Personal Video Recording products (PVRs) in terms of large of storage, it is desirable to have a TV commercial skipping system, which detects and skips commercial automatically. Thirdly, all advertisements deal with one of three concepts: ideas, product, and services. TV commercial classification with respect to the advertised products or services (e.g., automobile, finance, etc.) help to fulfil the commercial filtering towards personalized consumer services. Fourthly, the technology of TV commercial has changed a lot as they are almost always edited on a computer.
The appearance all starts with some TV channel and some TV channel commercials are more visual, more quickly paced, use more camera movement, and often combine multiple looks, such as black and white colour, or still quick cuts. Accordingly, a TV commercial archive system including browse, classification, and search may inspire the creation of a good commercial. Marketing companies may even utilize it to observe competitor‟s behaviours. [6]
As one of the key mediums, with the great advance in
multimedia acquisition technologies, plenty of
broadcasting videos are now routinely recorded for editing and archiving. But due to the shortage of efficient video content analysis technique, the massive growth in video volumes results in a lot of critical needs of actual applications, such as commercial navigation and broadcast monitoring. For instances, some companies may be responsible for verifying whether the commercials are broadcasted as specified in the contract or not. In addition, many regulatory bodies are likely to supervise the broadcast to gather the illegal contents or the excessive number of commercials. [2]
International Journal of Emerging Technology and Advanced Engineering
Website: www.ijetae.com (ISSN 2250-2459,ISO 9001:2008 Certified Journal, Volume 4, Issue 6, June 2014)
532
Thus, automatic commercial recognition is in great demand for commercial management. To cater for the increasing requirements of commercial recognition, extensive research efforts have been devoted to this area. To detect the commercials from recorded shows various methods are used. But these methods are not applicable for all TV channels because different channels used different methods like in feature based, intrinsic characters like monochrome frames, fades, black frames between the two different commercials etc. features of commercials.[5]Here for these entire problems Scale Invariant Feature Transform (SIFT) algorithm and Phase correlation are used. SIFT is an algorithm to detect and describes the local features in images. The SIFT features are robust to changes in invariance like illumination, rotation, and minor change in view point. These properties are highly distinctive, relatively easy to extract and allow for correct identification.
Phase correlation is a method of image registration. It uses template matching in identifying the particular part of the image frame. Phase correlation based template matching is an efficient tool for translation estimation which is in turn required for the image registration and the object tracking applications. When a template of an object is phase correlated with the search image, the resulting correlation surface is supposed to contain a sharp peak corresponding to the location of the object in the search image.
II. PHASE CORRELATION
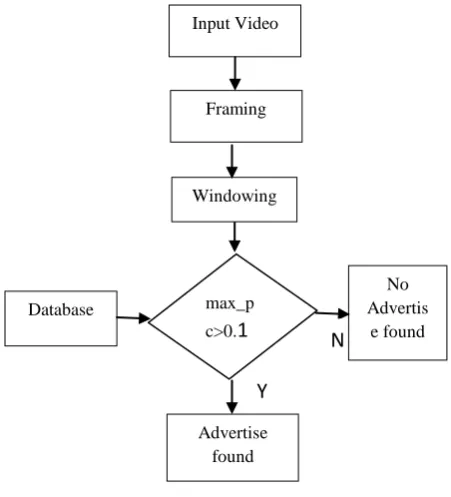
This is a method of image registration. It uses template matching in identifying the particular part of the image frame. In this method two images are taken as the input, one image is from the database it contains the logo of advertisement and another is the input video.
In this method template matching is done, in this input video is continuously tracked and it is checked weather any logo of the advertisement is present or not. The comparison is done from the database of the template present with us. If the template is matched than it will show us that advertisement is detected, if no template is found that means advertisement is not present.
The ratio of comparison between two image is done by below mentioned formulae.
R =
‖ ( ) ( ( ))‖ ( ) ( ( ))img1- is the template present in the database.
img2 – is the current frame of the video.
F is the Fourier Transform, and „conj‟ is the complex conjugate. The inverse Fourier transform of R is phase correlation[7]
[image:2.595.322.548.178.427.2]
Fig. 1 Flow Of Phase Correlation
III. RESULT OF PHASE CORRELATION
The result shown in the Fig. 3-5 is the output of the comparison of the input which is the recorded video frames and of the reference logo present in the database. But in phase correlation size of both the frames must be same. So, padding is performed by using Gaussian and weighing function.
Advertise found
No Advertis
e found Database
Input Video
Framing
Windowing
max_p
c>0.
1
Y
International Journal of Emerging Technology and Advanced Engineering
Website: www.ijetae.com (ISSN 2250-2459,ISO 9001:2008 Certified Journal, Volume 4, Issue 6, June 2014)
[image:3.595.76.281.142.347.2]533
Fig.2 Results of phase correlationIV. SCALE INVARIANT FEATURE TRANSFORM
Scale Invariant Feature Transform is an algorithm to detect and describe local features in images. The features of SIFT are robust to change invariance like illumination, rotation, and minor changes in view point. These properties are highly distinctive, relatively easy to extract and allow for correct identification with low probability of mismatch.
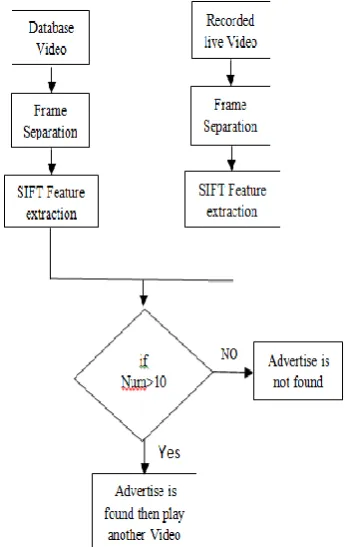
Fig. 3 General block diagram for detecting the TV commercials form recorded videos and for switching using SIFT
In various approaches, they are not able to detect the commercials for all TV channels. In feature detection approach, the intrinsic features are used to detect the TV commercials. Like, they use black frame at the beginning and end of commercials to separate from one another.
But all channels are not using the black frame to separate the commercials, so we cannot use this approach to every TV channel. But in SIFT algorithm, we extract the feature of image and compare with our database. So it can be used for all TV channels.
Image features have many properties that make them suitable for matching different images of an object or scene. The features are invariant to image scaling and rotation, and partially invariant to illumination and 3D camera view point. The cost of extracting these features is minimized by taking a cascade filtering approach, in which the more expensive operations are applied. [5]-[7]
Following are the major stages of computation used to generate the set of image features:
A. Scale-space extrema detection
B. Keypoint localization
C. Orientation assignment
D. Keypoint descriptor
The greatest characteristic of SIFT algorithm is scale invariance. In order to achieve scale invariance, SIFT uses a DoG(Difference of Gaussian) function. To do convolution on an image. It obtain different scale images by changing σ.
( )
( ) ( ( ) ( )) ( ) ( ) ( )
Then, it subtracts the images which are adjacent in the same resolution to get DoG pyramid. The DoG function is a kind of an improvement of a Gauss-Laplace algorithm. SIFT compares each point with its adjacent 26 pixels, which is the sum of eight adjacent pixels in the same layer and nine pixels in the upper and lower adjacent layers. If the point is minimum or maximum, the location and scale of this point are recorded. Therefore SIFT gets all extreme points of DoG scale space, and locates extreme points exactly. After that, it removes low contrast and unstable edge points. It further removes interference points, using 2×2 hessian matrix obtained from adjacent difference images.
[image:3.595.77.253.475.749.2]International Journal of Emerging Technology and Advanced Engineering
Website: www.ijetae.com (ISSN 2250-2459,ISO 9001:2008 Certified Journal, Volume 4, Issue 6, June 2014)
534
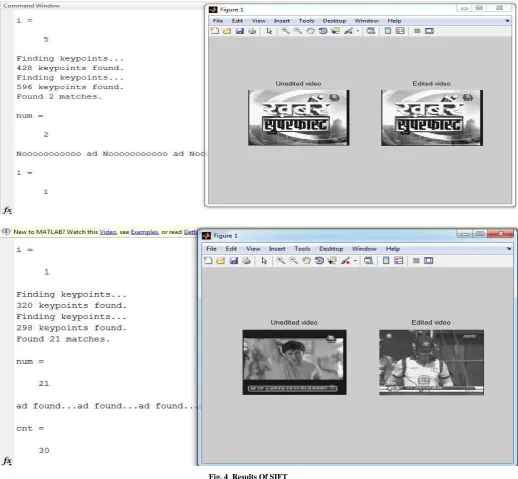
After the region is chosen, SIFT divides this region into 4×4 sub-regions, and sums the gradient strength in each region. SIFT uses eight directions in each sub-region to generate an eight-dimensional vector. Thereby, SIFT gets a 128 dimensional feature description from 16 sub-regions according to certain order.V. RESULTS OF SIFT
The live recorded video is compared with the database of advertisements, if matching frame of advertisement is found in recorded video than we come to know that advertisement is detected and channel is switched as mentioned in above result.
Multiple frames of advertisement are taken at some intervals. The frames are compared with recorded video. If the matching feature “num” is greater than 10 than advertisement is detected else no advertisement is detected and channel is not switched.
[image:4.595.49.568.289.768.2]When advertisement is been detected it switches the channel and side by side it have a look on the previous channel whether the advertisement is over or not by comparing the last frame of the advertisement with the recorded database of advertisement. When last frame of advertisement is been detected, it switches back to previous channel. It will also count the number of frames of advertisement which is running on unedited window.
International Journal of Emerging Technology and Advanced Engineering
Website: www.ijetae.com (ISSN 2250-2459, ISO 9001:2008 Certified Journal, Volume 4, Issue 6, June 2014)
535
VI. CONCLUSIONThis proposed system is based on detecting the TV commercials in recorded videos and switching the video to next video when commercial is detected.
The features of SIFT is fully robust in nature. The live recorded video is been compared with the database of advertisements, if matching frame of advertisement is been found in recorded video than we came to know that advertisement is been detected and channel is been switched as we can see from our above mentioned result. We have taken multiple frames of advertisement at some intervals that is been compared with recorded video and if there matching features “num” is greater than 10 than advertisement is detected else no advertisement is detected and channel is not switched. These features are easy to extract and highly distinctive.
When output of Phase correlation is max_pc = 0.01 approx, then No Advertisement is found and when max_pc = 0.1 approx, then Advertisement is found. The output of the system is checked on multiple video clips and correct output is found which shows Advertisement and No Advertisement.
Phase correlation is good for small changes in movement but cannot be used for large changes in movement which is generally observed in advertisement. This drawback is overcome by using SIFT. From the experimental results, execution time taken by phase correlation is less than SIFT.
REFERENCE
[1 ] David G. Lowe, “Object Recognition from Local Scale-Invariant Features ”, Proceeding of the International Conference on Computer Vision(1999)
[2 ] Brown, M. and Lowe, D.G., “ Invariant features from interest point groups”, In British Machine Vision Conference, Cardiff, Wales, pp. 656-665.(2002)
[3 ] David G. Lowe, “ Distinctive Image Features from Scale-Invariant Keypoints”, Proceedings International Journal of Computer Vision,(2004)
[4 ] Saiqa Khan,Arun Kulkarni ,“Robust Method for Detection of Copy-Move Forgery in Digital Images”, Proceeding IEEE International Conference (2010)
[5 ] Crowely,J.L,Parker, “A representation for shape based on peaks and ridges in the difference of low-pass transfrom” , IEEE Transaction on pattern Analysis and Machine Intelligence(2010) [6 ] Dejan Pangercic ,Vladimir Haltakov,Michael Beetz, “Fast and
Robust Object Detection in Household Enviroments Using Vocabulary Trees with SIFT Descriptors”Proceedings IEEE international Conference (2011)
[7 ] Ballard,D.H, “Genralizing the Hough transform to detect Aebitary patterns” , Pattern recognization ,13(2):111-122(2011)