Final Report
for the Period June 30, 1973 to January 1, 1975
Glassy Carbons
February 1975
Sponsored by
Advanced Research Projects Agency
ARPA Order No. 1824
t1y
This is
an erratum sheet for
Glassy
Carbons
Final Report dated February 1975 prepared
under Contract DAHC 15-71-C-0283
ARPA Order No. 1824
The University of Michigan
GLASSY CARBONS
Final Report for the Period June 30, 1973 to January 1, 1975
February 1975
ARPA Order Number: 1824 Program Code Number: 1D10
Contractor: The Regents of The University of Michigan
Effective Date of Contract:
1 June 1973
Amount o
f Contract
:
$150,
00
0
Contract Number:
DAHCl5-71-C-0283
Principal Investigator:
Professor Edward E. Hucke
Department of Materials & Metallurgical
Engineering
The University of Michigan
Ann Arbor, Michigan 48104
GLASSY CARBONS
Final Report for the Period June 30, 1973 to January 1, 1975
February 1975
ARPA Order Number: 1824 Program Code Number:
lDlO
Contractor: The Regents of The University of Michigan
Effective Date of Contract: 1 June 1973
Amount of Contract: $150,000
Contract Number: DAHC15-71-C-0283
Principle Investigator: Professor Edward E. Hucke
Department of Materials & Metallurgical Engineering
The University of Michigan Ann Arbor, Michigan 48104
The views and conclusions contained in this document
are those of the author and should not be interpreted as
necessarily representing the official policies, either
ex-pressed or implied, of the Advanced Research Projects Agency
TABLE OF CONTENTS
SUMMARY...v
I,
INTRODUCTION...1II. MATERIALS PREPARATION...2
III. STRUCTURAL STUDIES ... 4
Solid Structure... ... 5
X-ray Studies...5
Electron Microscopy and Diffraction ... 6
Thermodynamic Studies...7
Pore Structure...1
Small Angle X-ray Scattering...11
Electron Scanning Microscopy. ... ... 12
Py cnome try...12
Surface Area...13
Mercury Porosimetry...13
IV. PROPERTY EVALUATION...13
Hardness...13
Compressive and Tensile Strength. ... 14
Sonic Modulus and Internal Friction...15
Resistivity...17
REFERENCES...
....18Page
Missing
SUMMARY
Through the introduction of a controlled porosity, selectable in the range from below 100A to 50 microns, it was
possible to produce glassy carbon in section thickness in
ex-cess of 3 inches in proex-cessing times less than six days. It
was further learned and confirmed through a variety of
measure-ments that glassy carbon is not a single material, even when made from the same starting polymer system, but rather a class
of materials whose structure and resulting properties can be
tailored over an extremely wide range. The properties obtainable compare favorably not only with other carbons, but with other material classes, especially for high temperature applications.
A new thermodynamic method was developed and applied to
quantitatively measure the configurational enthalpy and entropy
of various glassy carbons relative to graphite. The measurements
confirmed quantitatively the marked differences that exist in the atomic strains and disorder in the different carbons. The
thermodynamic measurements also gave a quantitative measure of
the fraction of surface sites covered by oxygen, which was found
to be higher than for graphite. In addition, the high degree of
disorder in glassy carbon was shown to at least partially account
The various carbons have a basically planar structure. The fine structure determined by electron microscopy, electron
diffraction and X-ray diffraction is not homogeneous on a size scale below 100 Angstroms. The material is paracrystalline
0
with a characteristic size ranging from 10-100A depending on processing, and with some non-graphitic, very crystalline
0
regions occasionally existing in sizes up to 500A.
Helium, xylene, mercury intrusion, small angle X-ray scattering, surface area analysis, and scanning electron
micro-scopy show the pore structure.of glassy carbons may be either isolated or interconnected, mono or polydisperse, and in a size
0
range from 5A to 50 microns. Mechanical strength has an
approxi-mate inverse relation to the pore size. The pore structure allows
a decrease in density, as well as the opportunity to vary
GLASSY CARBONS
I. INTRODUCTION
In the past ten years, various workers have reported
the preparation, structure, and properties of a "new" form of carbon called glassy, glass-like or vitreous carbon. The names arose from the similarity in appearance to a black glass. Rela-tively little was known about its detailed structure.
Since these relatively pure carbons are made from
con-trolled decomposition of various polymers, they represent a
potentially plentiful and cheap material which, because of the inherent chemical and physical properties of carbon, offer
ex-citing possibilities, including those for -very high temperature
applications. These materials are isotropic in properties and
easily formed into complicated shapes. The major disadvantage
of these materials has been that in order to obtain crack free
pieces only very small sections (less than 1/8") could be
pro-duced and then only with very long and therefore expensive (e.g. 30 days) pyrolysis cycles. In addition, while the materials
studied all had some similarities in properties, enough variation
existed to question -whether.the structure was unique and whether
substantial improvement might be made through a better control
and understanding of the structure. In order to answer these
questions, a three year research program was undertaken at The
Research Projects Agency of the Department of Defense. Related
programs were also carried out at Battelle Northwest Laboratories,
Pennsylvania State University and Gulf Energy and Environmental
Systems Division.
The major goal of the program at The University of
Michigan was to extend the section size available and shorten
the pyrolysis cycle. Additional goals were to extend the range of properties obtainable and structurally characterize the
materials.
The experimental program had three major areas of
en-deavor, 1) Materials Preparation, 2) Structural Characterization,
and 3) Property Evaluation and Correlation. Many of the detailed
findings in each of these areas have already been presented in a
series of reports'~5, and a complete set of experimental data is
presented as an appendix to this report. Since the total number
of experiments is very large, only a summary of the major findings
in each of the areas will be presented in this final report.
II. MATERIALS PREPARATION
The primary goal of the research was realized when it
was demonstrated that very thick sections (up to 3 in.) could be produced in relatively short cycles- (1 to 6 days) if a pore
foriming liquid were used with the original polymer in order to
help the escape of gas during pyrolysis.
Both the total pore
volume and the pore size could be in this way reproducibly varied
magnitude reaching down to the 30-50 angstrom size. Both open
and closed pore system materials were produced having in several cases a selectable pore size distribution.
The most important conclusion arising from the materials
preparation program was that glassy carbon is not a single
material, but rather includes a wide range of materials with a
correspondingly large range in properties. Not only do different starting polymers produce different structures when pyrolyzed the same, but in general every aspect of the polymer processing and pyrolysis of a given starting material influences the final
product. This finding indicates that a high degree of control
is required to make a reproducible property set, but it also
indicates the exciting potential to tailor a given set of proper-ties to a desired end use. Both the ability to reproduce and to
controllably vary the properties were demonstrated in the many
hundreds of carbons prepared in this program.
In general, the polymers that yield glassy carbons are
thermosetting, network types that evolve substantial quantities
of heat during their polymerization. In general such materials
have multiple condensation reactions which depend on temperature
as well as amount and type of catalyst. Examples are phenolic
and furfural alcohol types which were used most in this work.
It was found that the most important factor in obtaining good
samples was in carrying out a controlled initial polymerization
so that as nearly as possible all parts of the sample were
in general very slow reactions at low temperatures, particularly in larger section sizes. It was found that once having produced
a non-uniform polymerization due to, for example, allowing the
center of a section to get hotter than the surface, a crack free
piece could not be made no matter how slowly the subsequent
pyrolysis was carried out. On the other hand, if a uniform micro
and macro structure were produced relatively fast pyrolysis cycles were successful.
Aside from yielding crack free samples, the fine structure
as measured by a variety of means was different for a given
poly-mer starting material after indentical heating to 2000*C where
only the time of holding at 100*C was varied. This finding shows
a remarkable ability to inherent structural modifications built
in through early processing. The work also indicated that dif-ferent structures could be obtained by varying only the pyrolysis
rate, pressure (vacuum vs. nitrogen), and final heat treating
temperature (HTT). The effect is large and well known, the
atmosphere and rate effects were more subtle but still present.
III. STRUCTURAL STUDIES
Since it was soon learned that there was no single
structure for glassy carbon, it is impossible to summarize the
detailed structural findings of all samples. However, several
generalizations can be made.
First, glassy carbons are not
homogeneous, even though they may appear to be on a macroscopic
accounts for their very attractive low density. The void space may, however, vary considerably in amount and size, and the solid
comprising the remainder of the structure varies significantly
in size and structure. Since the structural features of both
the solid and the voids vary over such a wide size range, there is, in general, no single evaluation technique that can be used. As a result, this program used all of the techniques available with cross comparisons where such were possible.
Solid Structure
The solid structure was studied using X-ray diffraction,
electron microscopy and diffraction, optical microscopy, and a
specially developed thermodynamic analysis.
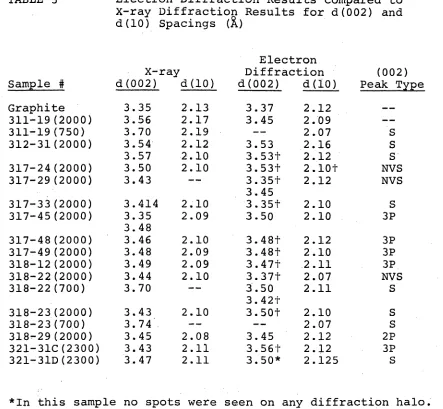
X-ray Studies - The various carbons have received rela-tively active study by wide angle X-ray diffraction. In general,
this work agreed well with the previous works. However, within
the usually reported range of values for the layer plane spacing,
d 002;the in plane spacing, d11 0, and the line broadening
parameters, L and La, there is an experimentally significant
c a
variation depending on the particular carbon and its processing. In short, while this method is rapid, and can determine easily the difference between disordered carbons and relatively good graphite, it is very insensitive to the differences between
highly disordered carbons. .The complete findings are presented
in Table 1 of the Appendix. 'The important findings are that
increasing HTT and some processing methods, which in general
structures significantly closer to graphite, although they were never very close to being a fully developed graphitic structure.
The structure is certainly planar, with a near perfect graphitic
spacing within planes. The line broadening parameters, Lc and
La, are certainly not easily interpreted in this case as
crystal-lite sizes, but they do correspond within a factor of about 2
with features that can be seen in electron diffraction and
trans-mission microscopy..
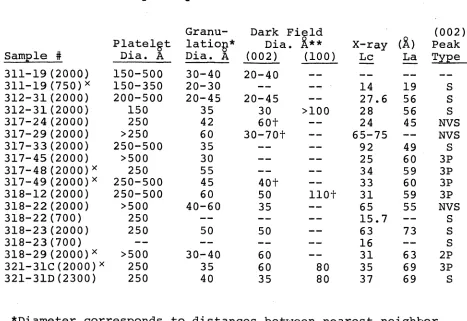
Electron Microscopy and Diffraction - Transmission
electron microscopy, both bright and dark field, together with selected area diffraction studies shed some light on the fine
structure of the carbons. These results are summarized in Tables
2 and 3 in the Appendix. They show that on a small scale,
20-0
100A, most of the material is highly disordered giving at most a
granulated appearance and very poor crystallinity. The
granu-lation makes up a larger structure which often appears to be
0
platelets of 100-500A. Occasionally structural features from
0
1000-10,000A were encountered, which gave a well defined graphitic or a crystalline indication of one of the tetrahedrally bonded
carbon polymorphs. This behavior has been noted in other studies
of glassy carbon6 . The various structures could be approximately
correlated with the X-ray data, were roughly as expected with
varying HTT, but in general important and unexplainable differences
occurred between different processing treatments on the same
Thermodyanmic Studies - Since the various methods of
studying the fine scale solid structure were not very sensitive to small differences, an entirely new method was conceived,
developed and applied. This method measured the free energy
difference between a macroscopic sample .of the disordered carbon
and nearly perfect graphite, as a function of temperature, using a solid electrolyte cell. A traditional thermodynamic analysis, together with the known fact that the specific heats of the
carbon differed negligibly, allowed the calculation of residual (configurational) entropy and enthalpy values. These values are,
respectively, direct numerical measures of the degree of disorder
relative to graphite and the amount of bond straining and missing bonds relative to graphite. The values measured were quite large
(10 cal/mole-*K) compared to those for other paracrystalline
materials such as polymers. Various glassy carbons showed large difference in each parameter even though no such large differences
were noticeable in the other structural measurements. In general
this method proved highly satisfactory, and is recommended as a
tool in characterizing various samples of disordered carbons since its greatest sensitivity occurs at the highly disordered states. It is noteworthy that various -samples can have a highly strained structure on a microscale (high residual enthalpy),
but have a relatively low disorder (low residual entropy).
The
reverse was also found to be true, although higher entropy is
usually associated with higher enthalpy. No simple models of
could account for the relatively high residual entropies measured.
A mixed bond model was developed that could semi-qualitatively
rationalize this result.
It was also found that the measurements on a given carbon
could be used with literature data for oxygen exchange to give
quantitative information about the oxygen occupation of surface
reaction sites. This technique is a potentially valuable new
tool for studying the surface structure of various carbons.
The remarkably high entropy values associated with some glassy carbons accounts for its unusual stability at high
temper-atures where the entropy term in the free energy outweighs the
enthalpy term. In fact, this finding was demonstrated in an
independent experiment described below.
Stability of Glassy Carbon and Graphite in CO2 - Most of
the commercially available and the experimental samples of glassy
carbon prepared at The University of Michigan, exhibited at high
temperature, equilibrium oxygen partial pressures higher than
graphite. The equilibrium oxygen partial pressure, p0 2, increased
2
with increasing temperature for all the glassy carbon samples.
Table 4 lists the p0 values at three temperatures for a
commer-2
cial graphite UC-AGSR, one commercially available sample of
glassy carbon (Beckwith D-82-2), and three experimental samples.
The samples (except for graphite which was heat treated to 2500*C)
were heat treated to about 2000*C for about one hour in the
atmos-phere of either flowing nitrogen or vacuum (~5x10~
atms.).
The
than for graphite. For example, p02 value for Hercules H-54
sample at 1200C is roughly four orders of magnitude higher than graphite at the same temperature. This big difference in
p0 2 naturally suggests an interesting experiment; let samples
of glassy carbon and graphite be placed side by side at a high temperature and then pass a CO-CO2 gas mixture, which is oxidiz-ing to graphite and reducing to glassy carbon, over the two
carbon samples, i.e.,
21
graphite 02 CO-CO2 mixture 02glassy carbonIf the kinetic factors are favorable, and if the desired CO-CO2
gas mixture maintains constant p0 2 within the limits of the above inequality, then all of the graphite sample should be
oxidized, except ash, and the glassy carbon sample should under-go negligible weight loss.
An experimental program was designed with the above
motive. The Beckwith D-82-2 and LMSC glassy carbon samples
were studied. Unfortunately, the thermodynamic data and hence
p. 2 values were not measured for LMSC glassy carbon samples, but to a first approximation they can be assumed to be close
to that of Beckwith D-82-2 sample. About 2 gms comprising 10-15 thin equivalent chips of both graphite and glassy carbon
(to avoid any surface area effects) were weighed and placed in
zirconium boats side by side in the constant temperature zone
of a horizontal furnace. The CO
2gas was passed through graphite
the same furnace, and the resulting CO-CO2 gas mixture then
continuously flowed over the boats containing graphite and glassy carbon samples kept at the desired constant temperature
zone, and then flowed out of the system. The temperature of the
graphite chips at the lower temperature and the temperature of
the constant temperature zone were adjusted in such a fashion
that the resulting CO-CO2 gas mixture satisfied the desired
in-equality of Eq. 1.
The weight loss data are shown in Table 5, where
tem-perature and time refer to the temperature and time of gas flow
at the constant temperature zone. The furnace was cooled
with-out the flow of CO2 to avoid any sooting on carbon samples.
The weight loss ratios of graphite and glassy carbons are as
high as 19, but not infinite as anticipated by theory discussed
above. However, the net weight losses of glassy carbon samples
are very small, about 30 milligrams in 2 grams, and this could
well be either experimental error or due to some CO2 gas which
might have passed through the low temperature graphite bed
with-out coming to its equilibrium. It should be noted that the
glassy carbon loss was small and about constant even though the
flow rate varied by 1 order of magnitude, the time varied by a
factor of 6, and the temperature varied by 300*C. The dramatic
effect of CO2 gas flow rate on graphite oxidation as opposed to
almost invariance for glassy carbon is quite apparent from
Table 5. For examples, a flow rate of 0.6 c.c./sec. at 1200*C
of 0.05 c.c./sec. for even 12 hours at about the same temper-ature, oxidizes only 2.3 percent of the same graphite sample. The probable reasons for only partial oxidation.of graphite are
short constant temperature zone, relatively low CO2 flow rate,
and a need for better control of the inequality of Eq.
1.
It would appear possible through further refinement of thisex-periment to demonstrate unequivocally that the differences in weight loss were not due to kinetic factors.
These preliminary results suggest strongly that the
well known high temperature oxidation resistance of glassy
carbon relative to graphite can be explained at least partially
by its higher equilibrium oxygen pressure, as well as the more usual explanation on the basis of kinetic factors.
Pore Structure
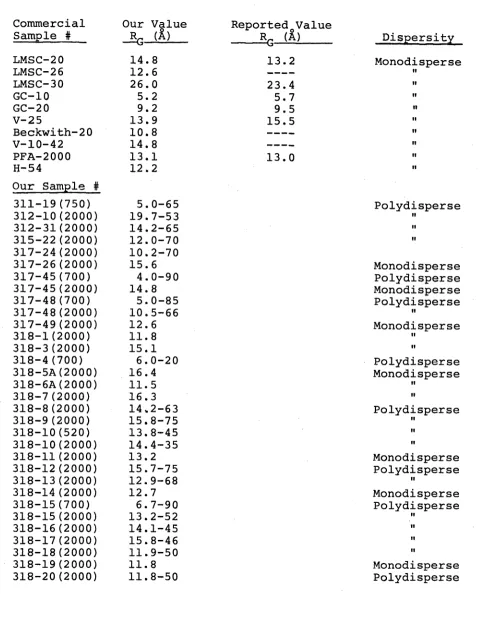
Small Angle X-ray Scattering - The fine pore structure
0
on the scale.of 10-100A was studied using small angle X-ray scattering. Table 6 summarizes the radius of gyration values
observed using a traditional analysis. Since the pores are
probably not spherical, a pore diameter has not been reported. For the most part these data are in agreement with those in the literature. They show pores ranging from 15 to 100A with the
lower values associated with lower HTT. However, a significant
new finding was evident.
In many of the carbons the pore size
is polydisperse. A controlled variation of the dispersion would
be useful in tailoring properties, particularly in chemical
Scanning Electron Microscopy - For pore structure ranging
0
from 100A up, scanning microscopy was used. It was found that
good checks with other methods, such as porosimetry and trans-mission electron studies, were possible in certain ranges where they overlapped. By varying the resin, its polymerization, and pyrolysis, it was possible to vary not only the amount of pores, but the shape and size distribution. With these techniques it becomes possible to tailor a strong body with a controlled pore structure for subsequent infiltration with other materials as, for example, metals. It was also found possible to allow a macro
pore structure to connect the smaller pore structure as might be
required in chemical applications.
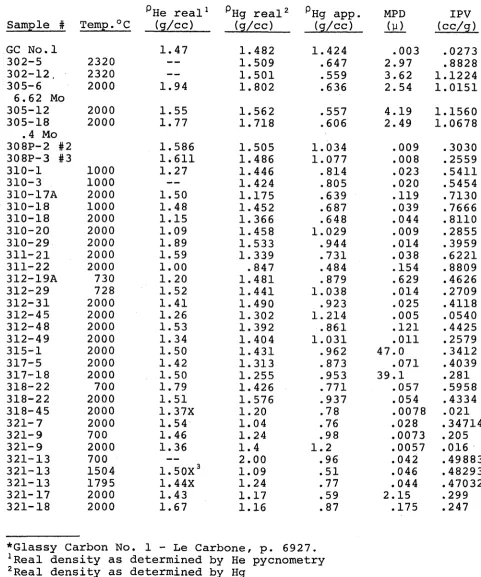
Pycnometry - The very fine scale porosity was studied
using He or Xylene pycnometry. The results are given in Table
9. In light of the purposeful inclusion of porosity, it is not surprising that the apparent density of the carbons could be
varied over the wide range indicated. However, it was also noted
that the real density shows considerable variation (1.18 to 1.9
gm/cm3). Such a large variation had not previously been shown.
It was found that even the "real density" of the various carbons
was illusive since different values were often obtained in He and
Xylene. In general, the Xylene densities were most reproducible
and were, together with the geometrically determined apparent
densities, the basis for normalizing all the physical properties
for the fraction solid contained.
It was found that there was
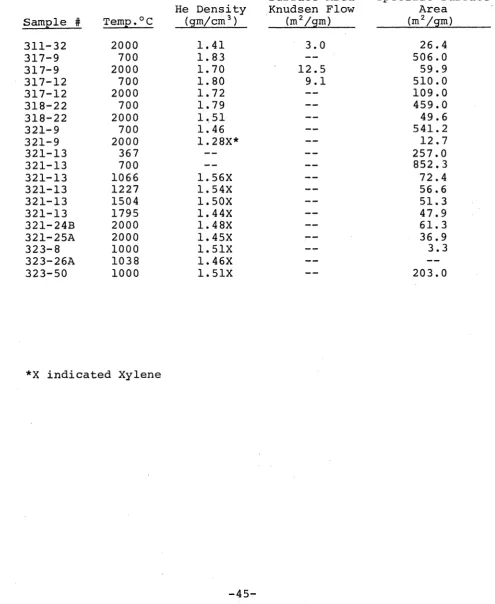
Surface Area - These data are summarized in Table 7.
For the most part the data were obtained with gas (N2 )
absorp-tion, but some measurements were made in a Knudsen flow appa-ratus. The surface area figures could be well correlated with
that visible in the scanning electron microscope (%l00A
resolution) except in the cases for low HTT carbons. In this case, a very large amount of assessible surface exists, probably on the scale of 5-10A, as has been noted by studies of chemical sieving. Many of the samples exhibit useful surface areas
large enough (>500 m2/gm) to be attractive in chemical operations,
particularly when it is noted that the materials are quite strong and easily made into macroporous coherent form.
Mercury Porosimetry - Another check for the pore
proper-ties was provided by Hg intrusion. The results shown in Table 8 in general agree with those found by other methods. The table
shows a few examples of the remarkably wide range available in
tailoring pore structure. For example, the pore volume of those
samples measured ranged from .02-1.1 cm3/gm, and the mean pore
0
diameter from 30-470,OOOA. The pore spectrum could be made either
very narrow or varied over a wide range. The real density, as measured with Hg, shows only moderately good agreement with that
measured with He or Xylene.
IV.
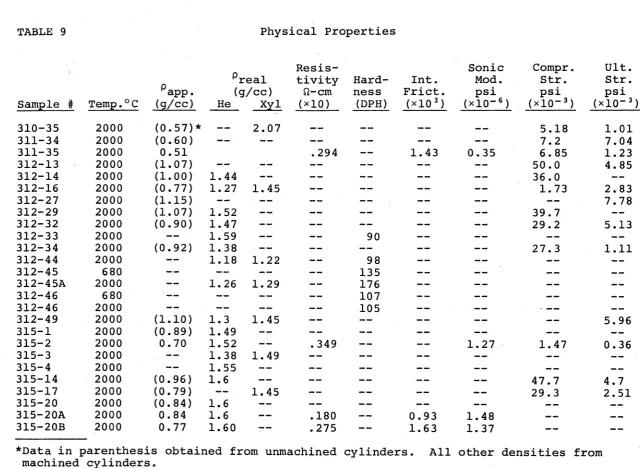
PROPERTY EVALUATION
Hardness
Obtaining a meaningful hardness test on carbons has long
usually present and the relatively low modulus. In most of the materials the indentation recovers completely after removing the
load. Application of a coating to the surface allows a reading
of the indentation that exists under load, which is relatively
large due to the porosity and low modulus. Using this value, the hardnesses were rarely over 300 VHN. However, these materials easily scratch hardened steel and glass, which would indicate their hardness should be in excess of 1000 VHN. While various hardness tests were studied, it was concluded that many were
useful only in comparing properties of carbons with closely
re-lated structures, and not for comparison with different material
classes.
Compressive and Tensile Strength - After development of testing techniques, it was found that compressive testing gave
the most reproducible strength results. The values, which are averages for multiple samples for both compressive and tensile strength, are tabulated in Table 9 and in Table 10 on a normalized
basis. After trials of several methods for measuring tensile
strength, the diametral loading of a right cylinder was chosen. This test was quite consistant with tensile bar data. The values
shown for both tension and compression are for samples with a larger stressed volume than those most often published for three-point bending of very small samples. The values shown are useful
for comparing the various kinds of carbon, but since they are
brittle materials, should be used with care in comparing to other
compressive and 11,000 psi tensile were produced. There is no reason to believe that either of these values represented an
optimum. It should also be noted that most of the samples had
a purposefully included porosity, even -though often it was too
fine to see with anything except an electron microscope. There-fore, the strengths shown are quite attractive compared to other material classes on a density normalized basis. The comparison
of properties also looks promising with respect to graphitic
materials. The physical properties were also corrected to the
actual fraction of carbon as determined by the ratio of apparent to real density. It can be seen in Table 10 that these values
still show a wide range for the various carbons. This indicates that structural factors dominate the strength. As might be ex-pected, a rough correlation was obtained between the strength.
and the size of the pores. The strengths are roughly inversely
proportional to the logarithm of the pore sizes3. However, even
at a given pore size and volume, some of the carbons were
significantly stronger which indicates that the very fine scale
structure of the solids plays a role. This conclusion was
supported by a correlation that was established between the reduced compressive strength and the reduced electrical
conduc-tivity. s
Sonic Modulus and Internal Friction
-The .sonic modulus
agreed well with that determined in tensile testing and was
there-fore adopted for routine evaluation. The data are included in
modulus over a range of more than 1 order of magnitude. This
factor can be extremely useful in designing with.other materials in order to minimize thermal stresses and stress concentrations. The range encompasses that for various human bones, which is of
particular significance in biomaterials applications, where these carbons are known to have the required bio-compatibility. The modulus, when corrected for the fraction carbon present,
should be relatively independent of ordinary micro-structural features such as pore size or shape. However, the normalized data which range from .3x106 to 107 psi indicate substantial differences exist in the short range bonding in the different
carbons. The higher value is more than three times the usual value for glassy carbon, but well below that for various carbon fibers. However, since the materials are isotropic, they indeed
look attractive with respect to other carbon materials. In
addition, on a strength to density basis, they compare favorably with all other classes of materials. The modulus for a given
carbon tends to go through a maximum versus HTT in the range
1000-1800*C. A similar effect was detected in strength values. It should be emphasized that the values thus far determined do not represent the optimum.
The internal friction behavior was determined on a
variety of carbons and found to encompass a range spanning the
whole range of other material classes from the highly damping
to the almost loss free.
This factor again indicates the
pore structure, as well as the fine scale bonding, would be ex-pected to affect the internal friction, no clear-cut correlation was found with other measured properties.
Resistivity - The electrical resistivity data are
in-cluded in Tables 9 and 10. It can be seen that values range widely for the various carbons. On a normalized basis there is, as expected, a much smaller variation, but still more than a factor of three when comparing materials with the same HTT. It is therefore certain that the processing affects the short range bonding, but in no easily predictable manner. When comparing
materials processed to the same HTT, those with the lower reduced
resistivity, showed the highest values of strength on a reduced basis.. However, since the resistivity for a given material falls
continuously versus HTT, and the strength in general goes through
a maximum, reduced resistivity can not be used as a sole
References
1. E. E. Hucke, "Glassy Carbons," Semi-Annual Progress Report, January 1972, ARPA Contract No. DAHCl5-71-C-0283.
2. Ibid, June 1972.
3. Ibid, January 1973. 4. Ibid, June 1973. 5. Ibid, January 1974.
Page
Missing
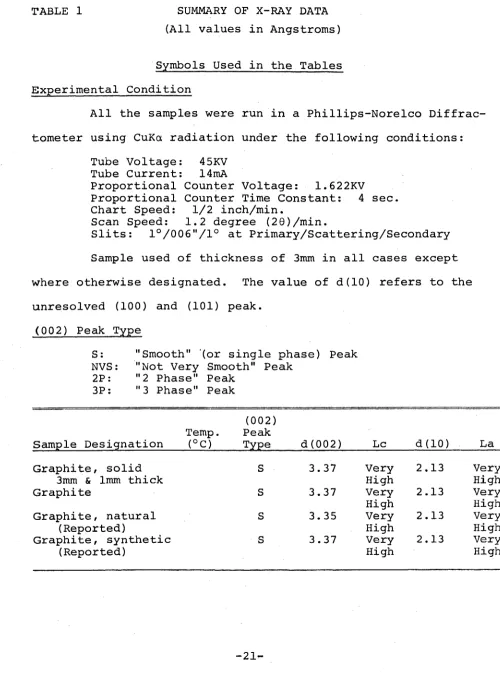
TABLE 1 SUMMARY OF X-RAY DATA
(All values in Angstroms)
Symbols Used in the Tables
Experimental Condition
All the samples were run in a Phillips-Norelco
Diffrac-tometer using CuKa radiation under the following conditions:
Tube Voltage: 45KV
Tube Current: l4mA
Proportional Counter Voltage: 1.622KV
Proportional Counter Time Constant: 4 sec.
Chart Speed: 1/2 inch/min.
Scan Speed: 1.2 degree (20)/min.
Slits:
1/006"/l
at Primary/Scattering/SecondarySample used of thickness of 3mm in all cases except
where otherwise designated. The value of d(10) refers to the
unresolved (100) and (101) peak.
(002) Peak Type
S: "Smooth" '(or single phase) Peak
NVS: "Not Very Smooth" Peak
2P: "2 Phase" Peak
3P: "3 Phase" Peak
(002)
Temp. Peak
Sample Designation (°C) Type d(002) Lc d (10) La
Graphite, solid S 3.37 Very 2.13 Very
3mm & lmm thick High High
Graphite S 3.37 Very 2.13 Very
High High
Graphite, natural S 3.35 Very 2.13 Very
(Reported) High High
Graphite, synthetic -5S 3.37 Very 2.13 Very
[image:29.611.54.554.79.778.2](002) Temp. Peak
( C) Type
Sample Designation d(002) Lc d(10) La
J6
Commercial Samples
Lockheed, solid 2000
Lockheed, reported 2000 Beckwith, solid 2000 Beckwith, reported 2000
Tokai, solid 1000
Tokai, reported 2000
Atomergic Chemicals 2500 Co., V-25, solid
Atomergic Chemicals 2500 Co., V-25, reported
Atomergic Chemicals 1000
Co., V-10
Atomergic Chemicals 1000 Co., V-10, reported Hercules H-54 1795
S S S S NVS S 3.53 3.56 3.55 3.54 3.70 3.40 3.44 3.49 21.2 19.0 23.2 15.0 14.2 38.4 2.09 2.09 2.07 2.09 98.0 112.0 50.0 43.7 69.0 71.0 51.0
42.0 2.10
28.0 2.09 v
311-9 311-19 311-20 311-21 311-22 311-25 311-30A 311-31 312-8 312-9 312-10 312-10 312-14 312-14A 312-15 312-16 2000 700 2000 2000 2000 700 2000 2000 2000 2000 700 2000 2000 2000 2000 2000 2000 2000 2000 2000 2000 2000 2000 S S S S 2P S S S S 2P S S S 3P S 3P S S S S S S NVS 3.54 3.63 3.53 3.52 2.49 3.45 3.70 3.51 3.50 3.52 3.52 3.45 3.65 3.49 3.51 3.46 3.43 3.36 3.52 3.47 3.43 3.36 3.51 3.51 3.51 3.51 3.57 3.51 3.48 28.0 18.0 27.2 27.2 29.0 21.0 23.4 25.0 27.0 27.0 16.2 35.0 29.0 32.0 2.10 2.10 2.10 2.12 2.10 2.10 2.10 2.10 2.11 2.09 2.12 57.0 46.0 54.0 >125.0 54.0 51.0 42.0 57.0 53.0 61.0 >150.0 51.0 51.0 57.0 48.0 51.0 57.0 56.0 54.0 52.8
27.1 2.11 32.1 2.11
312-21
312-26
312-28 312-29
312-31, solid
312-32 312-33 30.8 27.8 27.2 34.0 27.6 30.8 30.8 2.10 2.09
2.- 10 2.10 2.10 2.10
(002)
Temp. Peak
(°C) Type
Sample Designation d(002)- Lc d(10). La
312-34
312-39 312-40
312-43
312-44 312-48
312-49 315-1 315-2
315-3
315-5
315-8
315-9
2000 2000 2000 2000 2000 2000
2000
2000 2000 700 2000 2000
2000
2000 2000
680
2000 2000 665 2000 2000 2000 2000
680 2000 600 2000 315-14
315-18
315-20 315-20A 315-21C
315-22 315-22 315-24A 315-25A 315-26B
315-26C 315-28
315-28B
315-30
315-31
315-34
2P
S 2P
2P
2P
3P
S S 2P
S 2P
2P
2P
S 3P
S 2P
2P
S S 2P
S 3P
S 2P
S 2P
S S
3.46 3.44 3.49 3.48 3.45 3.48 3.43 3.48. 3.44 3.46 3.43 3.37 3.52 3.53 3.49 3.43 3.71 3.49 3.44 3.49 3.44 3.47 3.44 3.53 3.40 3.382
3.351
3.70 3.53 3.43 3.52 3.43 3.67 3.52 3.47 3.38 3.52 3.50 3.41 3.37 3.69 3.52. 3.43 3.70 3.56 3.43 3.70 3.69
31.1 27.2
29.0
16.2
29.0
33.0 2.11 29.8 2.10 30.1 2.09 33.2 2.11 42.0 2.11 30.4 2.10
28.2 2.10
33.0 2.11 2.11
2.10 2.10
2.11
26.3 45.0
16.3
28.0
2.10
2.10
46.2
53.0 54.0
51.0
51.0 37.0
61.0
48.0 54.0
54.0 56.0
47.0
54.0
57.0
57.0
51.0
48.0
46.0
46.0
48.0 27.8 2.10
16.4 28.0
20.0
2.10
26.5 2.09 26.5 2.10
17.1
26.0
16.8
24.0 18.2
15.4
2.10
2.09
680
(002) Temp. Peak
(°C) Type
Sample Designation d (002)- % %0 %w JF Lc- %.w d(10)%oft % %r tf La.4-4 -. 0b
315-36 315-37 315-37 315-38 315-38 315-39 315-39 315-40 315-41 315-42 315-43 315-43 315-44 315-45 315-46A 316-6 316-7, 316-7, 316-15 316-28 316-32 317-1 317-1 317-2 317-2 317-6 317-6 317-7 317-7 317-8 317-8 317-10 317-11 317-13 317-13 317-14 317-14 317-15 317-15 317-16
Run 1 Run 2
2000 680 2000 680 2000 2000 680 2000 2000 2000 2000 700 2000 2000 2000 2000 2000 2000 2000 2000 2000 700 2000 700 2000 700 2000 700 2000 700 2000 2000 700 700 2000 700 2000 700 2000 2000 3P S S S 2P 2P' S S NVS S NVS S 2P S 2P NVS S S 2P S 2P S S S NVS S NVS S NVS S 2P NVS S S NVS S NVS S NVS S 3.52 3.43 3.37 3.63 3.50 3.63 3.49 3.43 3.53 3.43 3.63 3.54 3.49 3.56 3.52 3.67 3.55 3.45 3.49 3.55 3.43 3.50 3.49 3.52 3.40 3.50 3.42 3.40 3.71 3.46 3.68 3.48 3.71 3.55 3.68 3.46 3.71 3.56 3.46 3.48 3.71 3.72 3.47 3.71 3.45 3.71 3.47 3.54 17.5 26.3 18.8 27.1
24.3 2.10
27.2 2.098 57.0
20.0 25.6 23.6 27.2 24.3 17.4 23.1 --2.097 2.098 2.098 2.098 2.10 51. 51.0 51.0 46.0 51.0 40.2
27.2 2.10 46.6
23.1 2.098 57.0
(002) Temp. Peak
( C) Type
Sample Designation d(002) Lc d(10) La
w.. - - -- __ rr rr . .r rr r. rrrrir
317-18 317-19 317-19 317-20 317-20 317-24, 317-24, 317-25 317-26, 317-26, 317-28 317-29 317-29, 317-29, 317-30 317-31A 317-32 317-32 317-33 317-33 317-34 317-34 317-35 317-35 317-37 317-37 317-38 317-38
Run 1
Run 2, solid Run 1
Run 2, solid
Run 1
Run 2
2000 700 2000 700 2000 2000 2000 2000 2000 2000 2000 700 2000 2000 2000 2000 700 2000 700 2000 700 2000 700 2000 700 2000 700 2000 2000 2000 2000 S S NVS S S NVS NVS S NVS 2P NVS 2P NVS NVS 2P S S 2P S S S 3P S 3P S NVS S 3P 3P 3P
3P b
3.59 3.68 3.49 3.66 3.50 3.52 3.49 3.53 3.48 3.46 3.43 3.46 3.43 3.42 3.43 3.426 3.44 3.40 3.58 3.51 3.48 3.68 3.414 3.68 3.44 3.42 3.36 3.71 3.50 3.43 3.36 3.68 3.43 3.68 3.54 3.43 3.37 3.45 3.43 3.36 3.52 3.42 3.37 3.52 3.41 3.37 21.0 16.5 30.0 17.5 25.6 24.0 21.0 20.0 26.0 24.2 25.0 21.5 65.0 75.0 29.5 22.0 23.6 17.0 92.0 17.0 30.0 16.0 26.5 15.6 43.0 15.6 25.0 2.09 2.09 2.09 2.09 2.09 2.09 2.09 2.10 2.09 58.0 52.0 48.0 45.0 50.0 50.0 48.0 51.0 52.0 2.10 2.08 2.10 2.09 2.10 2.10 2.09 46.0 49.0 49.0 50.0 62.0 63.0 51.0 52.0 45.0 49.0
317-39, Run 1
317-39, Run 2,
solid, lmm thick 317-39, Run 3,
solid, lmm thick
28.0 2.10
24.2 2.09
(002) Temp. Peak
(*C) Type
Sample Designation _ d (002)- " Lc d(10)-- i La
--_.. _
317-40
317-41A 317-41B 317-42
317-43
317-44
317-45, solid, lmm thick 317-45, Run 1
317-45, Run 2
317-46
317-47
317-48, Run 1 317-48, Run 2 317-48, Run 1
317-48, Run 2
solid, lmm thick
317-49
317-49, Run 1
317-49, Run 2
solid, lmm thick
317-50 318-1 318-2
318-3, Run 1 318-3, Run 2
2000
2000 2000 2000
2000
2000
700 2000
2000
2000
2000
700 700 2000
2000
700 2000
2000
700 2000 2000 700 700
3P
S S 3P
3P
3P
S
3P
3P
3P
3P
S S
3P
3P
S
3P
3P
S S S S S
3.49 3.42 3.36 3.53 3.53 3.49 3.42 3.36 3.45 3.42
3.35
3.48 3.42 3.36 3.75 3.48 3.40 3.35 3.46 3.42
3.35
3.43 3.42 3.36 3.50 3.42 3.36 3.71 3.87 3.45 3.43 3.37 3.46 3.43 3.37 3.71 3.49 3.41 3.35 3.46 3.44 3.37 3.67 3.55 3.51 3.70 3.69
26.5
28.0 26.0
2.10 2.10 2.10 24.8 2.10
26.0 2.09
30.0 2.09
12.9
--25.0 2.09
24.0 2.09
31.5 2.10
27.0 2.10
48.0
48.0 54.0 42.6
56.0
55.0
16.2
17.4
40.0 2.10
60.0
42.0
75.0
60.0
60.0
59.0
62.0
60.0
54.0 55.0 34.0 2.10
15.7
29.0 2.09
33.0 2.09
15.6
28.0
27.0 16.7 16.7
(002) Temp. Peak
( C) Type
Sample Designation d (002) Lc d(10) La
+ " --- -- - -- - - -- - r .r
--..r 318-3
318-4 318-6A
318-7, Run 1
318-7, Run 2, solid 318-8, Run 1
318-8, Run 2
solid, 2mm thick
318-9 318-10 318-10 318-11, 318-11, 318-12 318-13 318-14 318-14 318-15, 318-15, 318-15 318-16 318-16 318-17 318-17 3.18-18, 318-18, 318-18 318-19 318-20 318-20 318-21, 318-21, 318-21 318-22 318-22, 318-22, 318-23 318-23 318-24
Run 1
Run 2
Run 1 Run 2
2000 700 2000 2000 2000 2000 2000 2000 520 2000 2000 2000 2000 2000 700 2000 700 700 2000 700 2000 700 2000 700 700 2000 2000 700 2000 700 700 2000-700 2000 2000 700 2000 700 2P S S S S S S 2P S S NVS NVS 3P NVS S 3P S S 3P S 2P S NVS S S S S S S S S S S NVS NVS S S S 3.46 3.41 3.66 3.50 3.50 3.49 3.45 3.45 3.48 3.46 3.74 3.49 3.42 3.43 3.49 3.43 3.36 3.42 3.65 3.48 3.43 3.36 3.75 3.75 3.45 3.42 3.37 3.72 3.43 3.41 3.68 3.45 3.68 3.71 3.55 3.52 3.67 3.53 3.78 3.75 3.55 3.70 3.44 3.44 3.74 3.63 3.64
32.5 2.11 26.0 2.11
15.2 33.8 77.0 78.0 31.4-44.0 16.0 30.5 16.0 15.1 30.2 15.7 39.0 16.7 42.0 16.4 16.3 25.6 26.0 16.0 21.0 14.0 15.4 23.6. 15.4 65.0 64.0 16.0 63.0 16.7 2.12 2.10 2.11 2.09 2.10 2.10 2.10 2.09 2.11 2.10 2.09 2.09 2.10 2.10 2.11 2.10 16.8 31.0 28.0 28.0 39.0 43.5 2.09 2.10 2.10 2.10 2.10 51.0 59.0 65.0 45.0 63.0 77.0 57.0 50.0 38.0 40.0 59.0 58.0 60..0 60.0 49.0 59.0 44.0 59.0 48.0 55.0 55.0 54.0 73.0 Run 1
Run 2
Run 1
Run 2
Run 1
(002) Temp. Peak
(°C) Type
Sample Designation d (002) Lc d (10) La
318-24
318-26, Run 1 318-26, Run 2 318-26, Run 3 318-27
318-28 318-28
318-29, Run 1
318-29, Run 2,
solid, 1mm thick 318-29, Run 3
318-30
318-30, Run
1
318-30, Run 2
318-31, Run 1
318-31, Run 2
2000 700 700 700 2000
700 2000 2000 2000 2000
700 2000 2000
2000 2000
700 700 2000 700 2000 700 2000
700 2000
700 2000 700 2000
700 2000
S
S
S S 2P
S 2P
NVS 2P
2P
S
2P
3P
2P
3P
S S S S
NVS
S
3P
S
3P
S
2P
S
3P
S 3P
3.44 3.69 3.75 3.69 3.45 3.41 3.75 3.47 3.42 3.45 3.50 3.44 3.52 3.42 3.64 3.48 3.43 3.45 3.41 3.36 3.45 3.43 3.47 3.41 3.36 3.64 3.63 3.44 3.66 3.46 3.63 3.49 3.43 3.36 3.71 3.50 3.44 3.37 3.68 3.51 3.44 3.71 3.46 3.43
3. 376 3.71 3.47 3. 43 3. 37
18.0
--27.0
--30.0 2.08 30.5 2.10 31.0 2.10
15.2
--34.1 2.11
31.0 2.11
35.5 2.10 31.0 2.11
318-32, 318-32, 318-32
318-33
318-33 318-34 318-34
318-35
318-35
318-36 318-36
318-37
318-37
318-38 318-38
45.0 15.7 16.1 16.7 35.4
2.10
2 1 2.10
68.0
47.0
Run 1 Run 2
15.7 16.0 47.0 16.7
28.0
16.5 37.0
15.3
34.0
17.0
28.0
16.1 33.6
15.6
28.0
2.10
2.11
2.10
2.11
2.10
2.10
2.10
62.0 65.0
60.0
69.0 63.0
64.0
63.0
65.0 64.0 59.0
67.0
49.0
52.0
(002)
Temp. Peak
Sample Designation (°C) Type d(002) Lc d(10) La
318-39, Run 1 700 S 3.71 17.0 --
--318-39, Run 2 700 S 3.65 17.2 --
--solid, lmm thick
318-39 2000 S 3.51 26.1 2.09 60.0
318-40 700 S 3.71 15.0 --
--318-40 2000 2P 3.52 28.0 2.11 54.0
3.45
318-41 700 S 3.71 14.8 --
--318-41 2000 S 3.50 28.0 2.09 57.0
318-43, Run 1. 700 S 3.69 17.0 --
--318-43, Run 2 700 S 3.71 13.8 --
--solid, lmm thick
318-43, solid 2000 S 3.44 31.0 2.12 58.0
318-44 700 S 3.72 15.6 --
--318-44 2000 S 3.55 27.2 2.10 44.0
318-45 700 S 3.71 15.7 --
--318-45 2000 S 3.56 25.4 2.10 46.0
318-46 700 S 3.71 15.9 --
--318-46, solid 2000 S 3.53 26.2 2.11 51.0
lmm thick
318-47 700 S 3.71 15.0 --
--318-47 2000 NVS 3.49 29.0 2.10 48.0
318-48, Run 1 2000 S 3.53 26.8 2.10 54.0
318-48, Run 2 2000 S 3.52 29.2 2.10 42.0
318-50, Run 1 700 S 3.71 14.3 --
--318-50, Run 2 700 S 3.71 15.5 --
--318-50 2000 S 3.53 26.0 2.10 46.0
318-51 2000 S 3.56 27.2 2.10 56.0
318-52 2000 S 3.53 26.5 2.10 54.0
318-53, Run 1 2000 S 3.52 26.5 2.10 54.0
318-53, Run 2 2000 S 3.54 30.0 2.10 60.0
318-54 700 S 3.66 17.0 --
--318-55 700 S 3.71 15.2 --
--318-56 2000 S 3.54 27.0 2.10 54.0
318-58 700 S 3.71 18.0 --
--318-58 2000 NVS 3.51 28.2 2.10 51.0
318-59 700 S 3.68 16.7 --
--318-59 2000 S 3.51 26.0 --
--318-60 700 S 3.70 15.7 --
--318-60 2000 2P 3.47 32.0 --
--3.44
318-61 700 5 3.71 18.6 --
--318-61 2000 5 3.52 23.3 2.09 55.0
318-62 700 S 3.70 15.3 --
--318-62 2000 S 3.56 22.5 2.10 51.0
321-1 700 S 3.66 5.0 --
--321-2 700 2P 3.63 17.4 --
(002)
Temp. Peak
(0C) Type
Sample Designation21m .0 d (002) Lc d(10) La
321-2 321-3 321-3 321-4 321-4 321-5' 321-5 321-6 321-6 321-7 321-7 321-8 321-8 321-9 321-9 321-10 321-10 321-11 321-11 321-12 321-12 321-13 321-13 321-16A 321-16B 321-16C 321-17 321-17B 321-18A 321-18B 321-19A 321-19A 321-19B 321- 20A 321-20A 321-20B 321-21A 2000 700 2000 700 2000 700 2000 700 2000 700 2000 700 2000 700 2000 700 2000 700 2000 700 2000 700 2000 2000 2000 700 700 2000 2000 700 2000 700 2000 700 2000 2000 3P S S S S S S S S S S S S 2-S S S 2P 3S S S S S 3? S 2P S NVS S 3P 3P? S 3.54 3.43 3.38 3.64 3.53 3.64 3.63 3.49 3.64 3.54 3.69 3.69 3.67 3.67 3.71 3.54 3.46 3.63 3.53 3.66 3.49 3.42 3.50 3.43 3.36 3.50 3.63 3.60 3.49 3.50 3.43 3.37 3.63 3.54 3.426 3.63 3.43 3.63 3.52 3.42 3.36 3.53 3.426 3.37 3.63
22.8 2.10
17.4 24.3 17.2 15.4 26.4 17.0 27.7 18.0 17.5 17.4 17.0 17.0 27.2 16.8 26.4 17.0 33.2 2.10 2.09 2.10 2.10 --2.094 2.09 51.5 51.0 53.7 48.0 65.0 --56.0 61.0 57.0 44.0 44.0
49 .0
46.0
53.8 61.0 46. 30.8 2.10
28.8 15.2 18.7 28.8 29.8 15.2 25.0 17.1 39.0 17.5 28.0 2.10 2.10 2.10 2.09 2.10 2.10
37.0 2.10
18.0
--700
-30-(002)
Temp. Peak
Sample Designation (°C) Type d(002) Lc d(10) La
321-21A 2000 NVS 3.43 41.6 2.10 51.0
321-21B 700 S 3.64 18.4 --
--321-21B 2000 S 3.52 27.0 2.10 57.0
321-22A 2000 2P 3.52 27.6 2.10 53.0
3.43
321-22B 700 S 3.70 16.1 --
--321-23 2000 S 3.49 33.0 2.10 54.0
321-23A 700 S 3.63 18.4 --
--321-23B 700 S 3.36 16.5 --
--321-23B 2000 3P 3.52 29.6 2.10 51.0
3.43 3.36
321-24 700 S 3.70 15.8 --
--321-24A 700 S 3.63 16.2 --
--321-24B 700 S 3.63 16.5 --
--321-24B 2000 S 3.43 35.4 2.09 57.0
321-25 700 S 3.63 18.4 --
--321-25 2000 NVS 3.47 30.8 2.10 60.8
321-25A 700 S 3.60 21.0 --
--321-25A 2000 NVS 3.43 40.2 2.10 60.5
321-26 700 S 3.67 15.0 --
--321-26 2000 S 3.52 27.2 2.094 48.5
321-26A 700 S 3.63 18.1 --
--321-26A 2000 S 3.52 27.2 2.094 54.0
321-27 2000 S 3.52 29.8 2.10 51.0
321-29 700 S 3.63 16.8 --
--321-29 2000 3P 3.49 24.8 2.094 58.0
3.40 3.35
321-30 700 S 3.63 19.6 --
--321-31 2300 3P 3.44 49.0 2.10 60.5
3.41 3.37
321-31A 2300 NVS 3.40 90.0 2.11 58.0
321-31B 2300 3P 3.49 37.0 2.11 69.0
3.43 3.37
321-31C 700 S 3.60 18.8 --
--321-31C 2300 3P 3.49 34.5 2.11 69.0
3.426 3.37
321-3lD 700 S 3.63 17.4 --
--321-31D -2300 5 3.47 37.2 2.11 69.0
321-31E 700 S 3.63 17.4 --
--321-31E 2300 NVS 3.426 61.6 2.11 69.0
321-31F 700 S 3.60 18.5 --
--321-31F 2300 S 3.45 44.0 2.10 69.0
321-31G 2300 2P 3.47 35.0 2.10 56.0
(002) Temp. Peak (°C) Type
Sample Designation d(002) Lc d(10) La
L r Ai
321-311
321-32 321-34 321-34A 321-36A 321-36B.
321-36C
321-37 321-37A
321-37B
321-38B 321-39
321-39B 321-41C
321-42A 321-42A
321-42B 321-42B
321-43B 321-43B
321-43B1
321-43B2
321-44A
321-44B
321-45A 321-45B 321-46A
321-46B
321- 46C
2300 700 2300 2300 2300 700 2300 2000 700 2000
700 2000 700 2000
700 2000
700 2000 700 2000 2000 2000 2000
2000
2200 2200 2000 2000
2000
2P
S S S S S S S S
3P
S
2P
S
3P
S
2P
S
2P
S 2P
2P
2P
3P
3P
S S 2P
3P
3P?
3.49 3.38 3.60 3.42 3.426 3.47 3.63 3.43 3.52 3.60 3.53 3.44 3.36 3.63 3.48 3.426 3.63 3.49 3.43 3.36 3.63 3.49 3.43 3.63 3.50 3.43 3.63 3.49 3.42 3.50 3.426 3.50 3.43 3.50 3.43 3.36 3.50 3.43 3.36 3.49 3.47 3.49 3.43 3.46 3.43 3 .36 3.47 3 .36
40.0 2.11
18.9 57.5 51.4 53.6 18.2 70.0 30.8 18.1 27.2
17.7 34.1 16.4 32.6
18.8 35.5 16.7 25.3 19.3 35.0
2.10 2.10
2.11
2.10 2.10 2.10
2.10
2.10
2.10
2.10
69.0
78.5 42.0 64.5 46.0 54.0 54.0
57.0
62.5
60.5
64.4
2.098 59.4
36.8 2.11 33.0 2.10
30.8 2.10
29.0 2.10
33.0 2.10 45.5 2.10 31.7 2.10 30.8 2.10
35.6 2.10
59.5 57.0 51.0
54.0
57.0 40.5 60.4 51.0
(002)
Temp. Peak
Sample Designation (°0C) Type d-(002) Lc d(10) La
321-46D 2000 3P 3.50 31.7 2.10 64.4
3.43 3.36
321-48A 2000 S 3.50 31.8 2.10 57.0
321-48B 2000 S 3.50 33.0 2.10 64.4
321-48C 2000 S 3.50 33.0 2.10 60.4
321-49A 2000 S 3.49 33.0 2.10 60.4
321-49B 2000 NVS 3.426 51.2 2.10 54.0
321-51 2000 NVS 3.43 91.5 2.11 69.0
321-51A 2000 NVS 3.43 107.5 2.11 68.0
321-52 2000 NVS 3.43 91.2 2.11 60.5
322-lA 2000 3P 3.44 26.4 2.085 57.3
3.37 3.33
322-1B 2000 S 3.40 41.5 2.085
--322-2B 1600 S 3.50 23.0 2.085 37.3
322-3B 1600 S 3.53 22.0 2.085 61.0
322-9A 2000 S 3.37 105.0 2.10 49.6
322-9B 2000 S 3.38 117.0 2.09 51.0
322-10A 2000 2P 3.43 33.0 2.085
--3.38
322-10B 2000 2P 3.50 30.8 2.10 69.0
3.43
322-10C 2000 2P 3.49 33.4 2.085
--3.43
322-10D 2000 2P 3.50 28.6 2.10 60.0
3.43
322-llA 1670 S 3.55 22.0 2.085 51.2
322-11B 1670 S -3.49 23.0 2.085 47.0
322-11B 2000 2P 3.47 33.0 2.085 48.5
32-2-12A 1600 S 3.56 23.0 2.085 40.5
322-12B 1670 S 3.56 22.0 2.10 57.0
322-13B 1670 S 3.53 31.8 2.085 50.2
322-14A 1670 S 3.50 23.0 2.085
--322-14B 1670 S 3.56 21.0 2.09 46.0
322-15B 1670 S 3.56 25.0 2.085 48.4
322-16A 1670 S 3.56 23.5. 2.085
--322-16B 1670 S 3.56 22.0 2.085 44.0
322-17A 1670 S 3.56 22.2 2.085 88.0
322-17B 1670 S 3.56 22.0 2.085 51.4
322-18B 1670 S 3.50 28.8 2.085 61.5
322-19B 1670 5 3.56 20.6 2.085 48.5
322-20 1670 5 3.50 21.4 2.085 30.2
322-21B 1670 S 3.56 17.0 2.085 69.5
322-23A 1300 S 3.56 17.4 2.085
--322-25A 1410 5 3.56 18.5 2.085 46.1
322-25B. 1410 .S . 3.56 19.2 2.07 121.0
322-26A 1410 5 3.50 25.6 2.085 51.0
(002) Temp. Peak
Sample Designation (°C) Type d(002) Lc d(10) La
322-27A 1410 S 3.59 20.0 2.085 57.3
322-27B 1410 S 3.56 19.3 2.085
--322-28A 1410 S 3.56 19.4 2.08 40.2
322-281 1410 S 3.56 17.8 2.085 53.2
322-29 1410 S 3.56 20.1 2.085 40.2
322-29B 1410 S 3.56 21.0 2.085 53.2
322-31A 1410 S 3.56 23.0 2.085 40.4
322-31B 1410 S 3.56 18.8 2.085 54.0
322-32 1350 S 3.56 18.2 2.085 48.5
322-34 1350 S 3.56 19.2 2.085 46.0
322-35 1350 S 3.56 20.6 2.085 54.0
322-36 1543 S 3.56 19.2 2.085 53.0
322-37 1543 S 3.56 23.0 2.085
--322-40 1440 S 3.53 23.6 2.085 66.0
322-41 1440 S. 3.56 20.4 2.085 61.0
322-42A 1440 S 3.56 21.4 2.085 37.1
322-42B 1440 S 3.56 21.4 2.085 65.0
322-46 1440 S 3.53 19.6 2.08
--322-47A 1440 S 3.50 21.5 2.085 74.0
322-47B 1440 S 3.56 20.0 2.085 51.6
322-48A 1600 S 3.49 21.5 2.085 51.0
322-49 1460 S 3.53 24.4 2.10 49.0
322-49 1600 S 3.52 23.0 2.085
--322-53A 1460 S 3.56 20.0 2.09 54.2
322-53B 1460 S 3.56 20.0 2.10
--322-53C 1460 S 3.56 18.4 2.085 49.0
322-54A 1460 S 3.56 18.7 2.085 48.2
322-58 1500 NVS 3.50 21.0 2.085 53.0
322-58A 1500 S 3.49 21.0 2.085 51.0
322-59 1500 S 3.56 24.4 2.085 53.8
322-61 1500 NVS 3.47 37.0 2.09 60.0
322-62 1500 S 3.47 30.8 2.085 97.0
322-62A 700 S 3.56 18.3 --
--322-63A 1500 S 3.46 35.6 2.10 72.5
322-63 1500 NVS 3.42 31.6 2.10 51.0
322-64 1370 S 3.56 18.5 2.085 54.0
322-66 1370 S 3.56 19.8 2.085 46.0
322-67A 1370 S 3.53 23.0 2.085 53.0
322-67B 1370 S 3.56 20.8 2.085 49.0
322-68A 1370 S 3.56 19.5 2.085 48.0
322-68B 1370 S 3.56 19.6 2.09 51.0
322-69 1370 5 3.56 18.5 2.085 54.0
323-1 1370 5 3.60 18.4 2.08 40.5
323-2 1370 5 3.60 18.4 2.07 44.0
323-2A 1370 5 3.60 18.4 2.07 48.0
323-3 1370 S 3.49 23.0 2.07 51.0
323-3A 1370 S 3.56 19.4 2.08 46.0
323-4 1370 S 3.58 18.9 2.07 54..0
(002) Temp. Peak
Sample
Designation (0C) Tyed(002)
Lcd(10)
La323-5 1000 S 3.63 16.4 2.07 42.0
323-5A 1000 S 3.63 15.4 2.07 46.0
323-6A 1000 S 3.63 16.8 2.07 42.0
323-6 1000 S 3.63 16.0 2.07 51.0
323-7 1000 S 3.63 18.1 2.07 46.0
323-8 1000 S 3.63 18.4 2.07 44.0
323-8A 1000 S 3.63 17.2 2.07 36.0
323-9 1000 S 3.63 15.6 2.07 44.5
323-9A 1000 S 3.63 16.4 2.07 37.0
323-11 A 1000 S 3.63 16.2 2.07 35.0
323-11B 1000 S 3.63 17.7 2.07 37.2
323-llC 1000 S 3.63 17.4 2.07 32.0
323-11D 1000 S 3.63 16.4 2.08 37.2
323-11E 1000 S 3.63 16.7 2.07 39.0
323-11F 1000 S 3.63 16.4 2.07 49.0
323-12 1000 S 3.63 17.7 2.07 46.0
323-12 1000 S 3.63 17.7 2.07 44.0
323-12A 1000 S 3.63 17.7 2.07 37.0
323-13 1000 S 3.63 18.8 2.07 40.5
323-13A
1000 S 3.63 17.0 2.07 51.0323-14 1000 S 3.62 16.7 2.08 48.5
323-19 1049 S 3.63 17.7 2.07 37.2
323-20 1049 S 3.63 17.1 2.07 40.5
323-20A 1049 S 3.63 16.8 2.07 51.0
323-21 1049 S 3.63 15.6 2.07 42.0
323-22 1049 S 3.63 16.2 2.07 40.5
323-23 1049 S 3.63 16.5 2.08 51.0
323-24 1049 S 3.63 19.1 2.07 38.6
323-25 1038 S 3.63 16.2 2.07 39.0
323-25A 1038 S 3.63 16.0 2.07 39.0
323-26A 1038 S 3.63 16.2 2.08 42.0
323-26B 1038 S 3.67 16.0 2.08 39.0
323-27 1038 S 3.63 15.5 2.07 42.0
323-27A 1038 S 3.63 16.2 2.08 46.0
323-28 1038 S 3.63 15.0 2.08 40.5
323-29(low-p) 1038 S 3.63 15.8 2.08 44.0
323-29(hi-p) 1038 S 3.62 16.8 2.08 40.4
323-29 1038 S 3.67 16.2 2.08 46.0
323-29A 1038 S 3.63 17.4 2.08 44.0
323-30B 1038 S 3.63 17.1 2.07 56.0
323-30C 1038 S 3.63 15.8 2.08 48.5
323-31 1038 S 3.63 21.0 2.08 46.0
323-32 1038 S 3.63 15.6 2.07 42.0
323-32A 1038 S 3.67 16.5 2.08 38.6
323-32B 1038 S 3.67 16.0 2.08 42.0
323-32C 1038 S 3.63 15.6 2.08 42.0
323-32D 1038 S 3.67 16.7 2.08 44.0
323-33 1027 S 3.63 15.0 2.07 38.5
(002) Temp. Peak
(*C) Type
Sample Designation d(002)- -- - --- - Lc- - d(10) - r La 323-35 323-36 323-36 323-38 323-39 323-40 323-41 323-42 323-43 323-45 323-46 323-47 323-48 323-49 323-50 323-51 323-52 323-53 323-54 323-55 323-56 323-57 323-58 323-59 323-58 323-64 323-66 323-67 323-68 323-69 324-1 324-2 324-3 324-4 324-5 324-6 324-8 324-9 324-10 324-11 324-13 324-14 324-15 324-16 3 24-18 324-19 324-19 32 4-19 1027 1027 1027 1027 700 1000 1015 700 1015 1015 1000 1005 1005 700 1000 1000 700 1080 700 1027 700 1000 1000 1000 1080 700 1000 1000 1000 1000 1000 1000 1000 1000 1000 1000 1000 1000 1000 1000 1000 1000 1000 1000 1000 1066 1550 1000 S S S S S S S S S S S S S S S S S S S S S S S S S S S S S S S S S S S S S S S S S S S S S S S S 3.67 3.67. 3.63 3.67 3.70 3.70 3.70 3.70 3.70 3.70 3.70 3.70 3.70 3.70 3.70 3.67 3.70 3.62 3.63 3.63 3.70 3.63 3.67 3.67 3.63 3.63 3.70 3.63 3.70 3.63 3.70 3.67 3.63 3.63 3.67 3.63 3.67 3.67 3.63 3.63 3.63 3.63 3.63 3.63 3.70 3.63 3.63 3.63 15.0 15.0 15.0 15.7 14.5 15.7 16.0 16.0 15.4 17.9 15.0 15.8 16.0 16.0 16.0 16.4 15.6 18.9 16.7 15.0 15.6 16.0 15.7 16.0 15.6 16.2 15.0 15.0 16.0 16.2 14.0 16.0 16.2 16.8 15.5 16.2 16.4 14.8 16.5 16.5 16.7 16.4 16.0 16.2 16.2 16.5 18.8 15.9 2.08 2.08 2.08 2.08 2.08 2.08 2.08 2.08 2.08 2.08 2.08 2.08 2.08 2.08 2.08 2.08 2.08 2.08 2.08 2.08 2.08 2.08 2.07 2.08 2.08 2.08 2.08 2.08 2.08 2.08 2.08 2.08 2.08 2.08 2.08 2.08 2.08 2.08 2.08 2.08 2.08 2.087 39.0 39.0 40.0 37.4 38.0 40.5 40.5 43.0 40.5 42.0 42.0 42.0 36.0 40.5 39.0 41.0 36.0 40.5 36.0 35.0 48.5 36.0 55.0 46.0 39.0 42.0 42.0 38.0 39.0 38.0 37.4 44.0 36.0 41.0 41.0 42.0 42.0 43.0 60.0 40.0 51. 0 35.8 1 hr. vac.
1 hr. vac.
-36-(002) Temp. Peak
(*C) Type
Sample Designation.i r d(002) Lc d(10) La
46
324-19 1 324-19 1 324-20 324-21 324-22 324-23 324-24 324-25A 324-25B 324-25C 324-27D 324-28 324-29 324-30 324-31 324-33G 324-34 324-35 324-36 324-37 324-38 324-39 324-40 324-40A 324-41 324-42 324-43 324-43B4 324-44 324-45 324-47 324-48 324-49 324-51 324-52 324-53 324-54 324-56 324-58 324-59 324-61 324-62 324-63 324-65
3 24-6 6
hr. vac. hr. vac.
TABLE 2 Sizes of the Structural Features Observed in Bright and Dark Field Electron Micrographs Compared to Crystallite Sizes Obtained from X-ray Analysis
Sample #
311-19 (2000) 311-19(750)x 312-31 (2000) 312-31 (2000) 317-24 (2000) 317-29 (2000) 317-33 (2000) 317-45 (2000) 317-48(2000)x 317-49(2000)X
318-12(2000)
318-22(2000)
318-22(700)
318-23 (2000) 318-23 (700)
318-29(2000)X
321-31C (2000) X
321-31D(2300)
Platelgt
Dia. A
150-500 150-350 200-500
150 250 >250 250-500
>500 250 250-500 250-500
>500 250 250
>500 250 250
Granu-latiop*
Dia. A
30-40 20-30 20-45 35 42 60 35 30
55
45 60 40-60
50
30-40 35 40
Dark Field Dia.
A**
(002) (100)20-40
--20-45
--30 >100
60t
--30-70t
--40t
--50
llOt
35
--50
--X-ray Lc
14
27.6 28 24
65-75
92 25 34
33 31
65
15.7
63 16
31 35 37
(A)
La19 56 56 45
49 60
59
60 59 55 73 63 69 69
(002) Peak
Type
S S S NVS NVS S 3P 3P
3P 3P
NVS S S S 2P 3P S 60
60
35
80 80
*Diameter corresponds to distances between nearest neighbor. **Diameter of diffracting regions obtained from (002) or (100)
diffraction halos.
tSome of the crystallites giving rise to halos or spots are very large in size, i.e., up to 5001.
xA second structural.feature was observed in the bright field micrographs of these samples. This new feature appeared to
[image:46.611.53.520.108.429.2]TABLE 3 Electron Diffraction Results Compared to
X-ray Diffraction Results for d(002) and
d(10) Spacings (1)
Electron X-ray Diffraction
d(002) d(10) d(002) d(10)
Sample #
(002) Peak Type
Graphite
311-19(2000)
311-19(750) 312-31 (2000)
317-24(2000) 317-29 (2000)
317-33(2000) 317-45 (2000)
317-48(2000) 317-49(2000)
318-12 (2000)
318-22(2000) 318-22(700)
318-23,(2000)
318-23(700) 318-29(2000)
321-31C (2300) 321-31D (2300)
*In this sample tIn addition to
3.35 3.56 3.70 3.54 3.57 3.50 3.43 3.414
3.35 3.48 3.46 3.48 3.49 3.44 3.70
3.43 3.74. 3.45 3.43
3..47
2.13 2.17 2.19 2.12 2.10 2.10
2.10 2.09 2.10 2.09
2.09
2.10
2.10
2.08 2.11 2.11
3.37 3.45 3.53 3.53t 3.53t 3.35t 3.45 3.35t 3.50
3.48t 3.48t 3.47t 3.37t 3.50
3.42t 3.50t 3.45 3.56't 3.50*
2.12 2.09 2.07 2.16
2.12
2.lOt 2.12 2.10 2.10
2.12 2.10 .2.11
2.07 2.11 2.10 2.07 2.12 2.12
2.125
S S S.
NVS NVS
S
3P
3P 3P 3P NVS
S
S S
2P 3P S
no spots were seen on any diffraction halo.
[image:47.611.87.530.94.503.2]Table 4. Oxygen Partial Pressures in Equilibrium with Graphite and Glassy Carbons
Sample Description
(HTT , HTt atmosphere) Sample
Number
p
0 2(atms)(800°C)
p0 2(atms)
(10000°C)
Graphite
321-13
Beckwith D-82-2
Hercules H- 54 324-19
UC -AGS R
1800°C
1 hr vacuum
2000°C
1795°C 1 hr vacuum
1890°C
1 hr vacuum
7. 3X10 2 1
2.0x10²⁰
5. 6X10¹⁹
1.4X10l18
1. 9X10¹⁹
5.2Xl0-19 2.8X10⁻¹⁸
2.4X10⁻¹⁶
2.8X10¹⁷
p 0 2(atms)
(1200°C)
9. 9x10l18
8. 0x1017
1. 0x10-14
3. 4x10-14
Table 5. Summary of Weight Loss Experiment Data
Sample
Description
Flow Rate Temp. Time of CO2
(*C) (hr) (c.c./sec.)
% wt. loss in graphite
(UC-AGSR)
% wt. loss in glassy
carbon
LMSC
Glassy Carbon
HTT=2000*C
LMSC
Glassy Carbon
HTT=2000*C Beckwith D-82-2 HTT=2000*C Beckwith D-82-2
HTT=2000*C
Beckwith
D-82-2 HTT=2000*C
1200
1250
950
1000
1250
3/4
3
3/4
1
12
0.6
0.2
0.2
0.1
0.05
22.7
20.0
14.0
2.3-2.3
1.2
2.0
2.6
1.5
Table 6. Radius of Gyration Results from Small Angle X-Ray Diffraction
Commercial Sample # LMSC-2 0
LMSC-26 LMSC-30
GC-10
GC-20
V-25
Beckwith-20 V-10-42 PFA-2000 H-54
Our Sample #
311-19 (750)
312-10 (2000) 312-31 (2000) 315-22 (2000) 317-24 (2000)317-26(2000)
317-45(700)
317-45 (2000) 317-48 (700) 317-48 (2000) 317-49 (2000) 318-1 (2000) 318-3 (2000) 318-4(700) 318-5A(2000)318-6A (2000)
318-7 (2000) 318-8(2000) 318-9 (2000)318-10 (520)
318-10 (2000) 318-11 (2000) 318-12(2000) 318-13 (2000) 318-14 (2000) 318-15 (700) 318-15 (2000)318-16 (2000)
318-17 (2000) 318-18 (2000) 318-19 (2000) 318-20 (2000)Our Va