2016 Joint International Conference on Artificial Intelligence and Computer Engineering (AICE 2016) and International Conference on Network and Communication Security (NCS 2016)
ISBN: 978-1-60595-362-5
A Strategy of Software Reliability Model Integration
Based on Model Measurement
Ru-Long HE
1,a, You-Jun WU
2,b, Zhan-Wei HUI
3,c*, Hai-Jin JI
3,4,d1Center of Communication Engineering, Naval University of Engineering, PLA,
Wuhan, Hubei Province, China
2Naval Command College, PLA, Nanjing, Jiangsu Province, China
3Software Testing and Evaluation Center, PLAUST, Nanjing, Jiangsu Province, China
4Huaiyin Normal University, Huaiyin, Jiangsu Province, China
a[email protected], b[email protected], c[email protected], d[email protected]
*Corresponding author
Keywords: Reliability model, Integration Model, Measurement.
Abstract. Generally, an integrated model behaves better than a single Software reliability model (SRM). However, there is no clearly guideline to support the component models selection. In this paper, it provides a strategy to component models selection for integration based on two model measurement: robustness and precision. The experiments show that the new model with the selective strategy performs better than the one with non-selective strategy.
Introduction
Software reliability model (SRM) is a powerful tool for predicting, controlling, and assessing software reliability. The number of existing SRMs exceeds hundred with more models developed every year to estimate software reliability measures, such as the number of remaining faults, software failure rate, and software reliability [31]. From the inherent characteristics of software testing process, a SRM with a bathtub-shaped fault detection rate is proposed [2], which could be used to provide accurate predictions during the testing process and guide optimal release time decisions. As software in an embedded system has taken charge of controlling both software and hardware components, to improve the accuracy of SRM, a novel model is proposed which considers not only the failures cased by software, but also the failures cased by hardware [11]. Based on this method, the classical SRM could be improved and provide more accurate software reliability estimation. For the increasing open source software, many experiments have conducted for improving the mean value functions of various SRMs [5]. In this condition, several classical models are improved, such as S-shaped model, the Goel-Okumoto model, Musa-Okumoto model, and so on. Literature [13] compared the fitting and prediction capability of eight software reliability models using fifty different datasets of open source software testing.
For the analysis of traditional one dimension SRM, researcher used one factor such as testing-time,
testing-effort or test coverage, etc for designing the reliability model, literature [6] provided with a
generalized framework for two-dimensional SRM with change-point for software reliability
assessment. Based on this model, literature [12] formulated an optimal release planning problem which minimizes the cost of software testing of the release, which could removing a desired proportion of faults from the current software release.
for object-oriented software. However, although these models have applied successfully in different domain software, still there is no model that can be applied in all cases. Models that are good in general are not always the best choice for a particular data set, and it is impossible to know in advance which SRM should be used in any particular case [7]. No one has succeeded in identifying a priori the characteristics of software that will ensure that a particular model can be trusted for reliability predictions [10].
In order to improve the accuracy of software reliability prediction, integrated or combination SRM are better than classical SRM. Traditional strategies of model integration take into account all the available models with neural network models [3]. Is this good enough for software reliability prediction? In previous work, we proposed two metrics for software reliability model measurement and classification. In this paper, we improve the metrics and provide with a strategy for component model selection. At last, we evaluate the effectiveness with experiments, which are conducted with two open tools SMERFS and CASRE.
Limitation of SRM
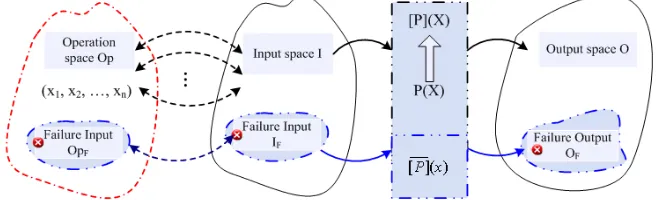
[image:2.612.145.475.366.466.2]There are two fundamental conditions for traditional SRM: a) the input of the software is stochastic, to generate a point in space is a stochastic process; b) given the same input, the program gets the same output. So if the software system fulfills the two conditions above, then the software reliability stochastic model is correct. The mapping between operation space Op and input space I is a subjective mapping as shown in Figure 1, the same with the relationship between the failed operation space OpF and IF.
Figure 1. Relationship among Operation Space, Input Space and Output Space.
Although the input of program P is innumerable, we could divisive the input space as several area, which is numerable, based on function equivalent division. Therefore, it could suppose the input of program P could be represented as x1, x2, …, xn in operation space, then the output could be
represented as [P](x1), [P](x2), …, [P](xn) in output space, when there is no fault in program P.
Otherwise, the outputs are [ ]( ),[ ]( ),...,[ ]( )P x1 P x2 P xn .
Then, if the each operation in space Op is stochastic, then the corresponding inputs in space I are also stochastic. And in this case, the condition a) would be satisfied. But in practice, the operations, which could be determined by the behaviors of users, are not stochastic. As we known, the behaviors of different users are following with certain purpose or usage. Therefore, the conditional a) would be not satisfied strictly in practice. On the other hand, the program outputs are influence by not only the target program but also the runtime environment. Thus, with the same input, the output of the target program would be different. Therefore, the conditional b) could not be fully satisfied.
With these analyses, we could get the conclusion there is no best SRM for single model. The two limitations determine that a single model, JM [3], GO [1], MO [14], Duane model (DU) [8] and Littlewood model (LM) [1], could not represent a source of uncontrolled variability in the properties of the failure process. Therefore, we can conclude and predict that the performance of a single model would be different. In other words, there is no model which always performs better than other models.
A Strategy of Software Reliability Model Integration Based on Model Measurement
Deviation of SRM
In previous research [15], we introduce two metrics for model selection, which are model precision and model robustness. The model precision is the expectation of the failure time or the failure number. But in practice, we not only want to know the distance between the practical value and the model output, but also plant to know whether the difference value is negative or not. Therefore, the definition of model precision could be improved.
Deviation of SRM: For target software and a SRM, suppose that there are n observed points, then for every observed point, there is a corresponding computing value by SRM. Thus, the deviation of point i could be represented as: Deviation(M) =i RM(Re ) Rei i
Then, the deviation of SRM is noted as: (Deviation(M) , Deviation(M) ,..., Deviation(M) ) 1 2 n In this case, the Precision of SRM could be represented as:
n
1
1
Precision(M)= | Deviation( ) |
n
i iM (1)
So, we could conclude that the smaller the Precision of model M is, the better the performance of the model M. Compared with Precision of SRM, Deviation of SRM is a series of measurement of the deviation between an observed value and a computed value. Therefore, Deviation metric could be more detailed and suitable for SRM precision measurement than the previous Precision metric. With this new metric, we could define two kinds of SRM. Radical Model: for i(1, n), M is the software
reliability model, if n i
i=1
Deviation(M) 0
, then M is a radial model, otherwise M is a Conservativemodel. Obviously, for radical models the smaller of the summation of deviation values, the more
radical of the SRM m. And for conservative model, the bigger of the summation of deviation values, the more conservative of the SRM m.
These two kinds of models have different application situations in evaluating the software reliability in practice. As for normal software the radical model can be used, because the effect would be not severity when a failure happens but the model does not predict it. But for other critical software which will cost users a great loss when they lose efficiency, the conservative model should be used.
Robustness of SRM
Traditionally, great efforts have been made to improve and enhance the precision of SRM. Although there are some models could achieve good precision for target software, the better performance would not continue. The model always gets a worse result for software. Therefore, these SRMS perform sometimes well, some times bad. And the aspect of precision and deviation can’t reflect the quality of the model completely. In this sense, another feature of SRM Robustness is introduced.
In previous work [15], we define the Robustness of a SRM as equation 2. Based on the definition of Deviation, we could see that for single software, the performance of M is not always same. According to the definition of Deviation, the mean variance of the model is computed by equation 2.
n
2
1 1
( )= (Deviation( ) (Deviation( ) ))
n
i ii
Robustness M M E M
(2)
(Deviation( ) )i
1 1
(Deviation( ) ) Deviation( )
ni i
i
E M M
n (3)
When the Robustness of the model is high, it is called as Initial state model; otherwise, it is Steady state model. And we should note that the Robustness of SRM is a determinate value, but the Initial state property and Steady state property of different SRMs are a kind of relative conceptions. Before we classify the model based on Robustness, an experiential threshold value should be initialized. As we known, software experts select suitable SRM to make a comprehensive evaluation over the development of dedicated reliability models for specific software projects [3][4], and to improve the reliability of evaluation and prediction. With the expression of Robustness of model M, we could know that they select SRMs based on model robustness, but not the deviation of M.
Therefore, the SRM is confined to some theoretical assumptions we made. Because many of these assumptions are so ideal that may not reflect the real operation profile. So when the Deviation of a single model is quite high, maybe its Robustness is not so satisfactory. Thus, the model with good Deviation and Robustness is what we need.
Experiments
Validating a SRM is hard [8] for software reliability data; reliability, especially software reliability is an attribute that is hard to measure and hence even harder to validate. As [8] illustrated, integrated SRM always behave better than single SRM. And traditional methods take all available models for model integration. In this section, we would do several experiments to compare the selective ensemble strategy with the nonselective ensemble strategy for SRM integration.
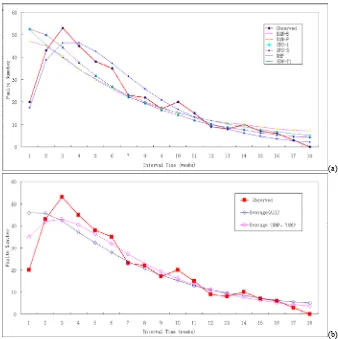
(a)
[image:4.612.136.474.375.714.2](b)
As SRMs could be divided into two classes, depending upon the data the model uses, we conducted four exploratory empirical studies to validate our metric. The first two data sets used the Interval-Data-Counts (IDC) data sets, and the last one used the Time-Between-Failure (TBF) data set. Figure 2 (a) are the Observed failure number of every week, BAM-B, BAM-P, GPO-1, GPO-2, NHP, SDW-T1 and YAM. For Figure 2 (b) are observed data set, integrated model of all available models and selective ensemble model (NHP, YAM).
Conclusion
Based on the experiments, the following observations can be generated: (1) As Figure 2 (b) shown, selective integrated model of SRMs always performs better than non-selective integrated model. (2) From Figure 2, we can see that the last one is smoother than the first two ones. In other words, it may be that failure time is easier to estimate than total number of software failures. (3) As Figure 2 (a) shown, for different data sets, the deviation of some of the SRMs are obvious unusual. This also provides an evidence for the observation that there are differences between the performances of different SMRs. As Figure 2 (b) shown, the selective integrated model perform better than any component model. (4) TBF data set are always smoother than IDC data set. We can see that the last one is smoother than the first two ones.
Acknowledgments
This work was supported by the NSF of Jiangsu Province, China (No: BK20141072), Scientific Research Fund of Huaiyin Normal University, China (No: 13HSQNZ070).
References
[1]P. Xu, S.Y. Xu, “A Reliability Model for Object-Oriented Software”, 2010 19th IEEE Asian Test Symposium, Shanghai, 1-4 Dec. 2010, pp. 65-70.
[2]Fiondella, L., Gokhale, S.S., “Software reliability model with bathtub-shaped fault detection rate”, Reliability and Maintainability Symposium (RAMS), 2011 Proceedings - Annual, Lake Buena Vista, FL, 24-27 Jan. 2011, pp. 1–6.
[3]F.Z. Zou, H.Q. Liu, and L. Wang, “Integrated Model of Software Reliability”, Wuhan University Journal, vol. 36, no. 1, pp. 105-108, 2003.
[4]F.Z. Zou and R.Z. Xu, “Multi-Model Assessment of Software Reliability”, Tongji University Journal, vol. 30, no. 10, pp. 1183-1185, 2002.
[5] S.K. Jha, A.K.D. Dwivedi, A. Tiwari, “Reliability models and open source software: An empirical study”, Computational Intelligence and Computing Research (ICCIC), 2010 IEEE International Conference on, Coimbatore, 28-29 Dec. 2010, pp. 1-5.
[6] Singh, O., Garmabaki, A.H.S., Kapur, P.K., “Unified framework for developing Two Dimensional software reliability growth models with change point”, Quality and Reliability (ICQR), 2011 IEEE International Conference on, Bangkok, 14-17 Sept. 2011, Page(s): 570 - 574.
[7]C.A. Asad, M.I. Ullah and M.J. Rehman, “An Approach for Software Reliability Model Selection”, The 28th Annual International Computer Software and Applications Conference, Hong Kong, China, vol. 1, pp. 534–539, 2004.
[8]M.R. Lyu, Handbook of Software Reliability Engineering. IEEE Computer Society Press and McGraw-Hill Book Company. April 1996.
[10]X. Zhang, M.Y. Shin and H. Pham, “Exploratory analysis of environmental factors for enhancing the software reliability assessment”, Journal of Systems and Software. vol. 57, no. 1, pp. 73-78, 2001.
[11]Jinhee Park, Hyeon-Jeong Kim, Ju-Hwan Shin, Jongmoon Baik, “An Embedded Software Reliability Model with Consideration of Hardware Related Software Failures”, Software Security and Reliability (SERE), 2012 IEEE Sixth International Conference on, Gaithersburg, MD, 20-22 June 2012, pp. 207-214.
[12]P.K. Kapur, H. Pham, A.G. Aggarwal, G. Kaur, “Two Dimensional Multi-Release Software Reliability Modeling and Optimal Release Planning”, IEEE Transactions on Reliability, Volume: 61, Issue: 3, Sept. 2012, pp. 758-768.
[13]U. Najeeb, M. Maurizio, V. Antonio, “A Comparative Analysis of Software Reliability Growth Models using Defects Data of Closed and Open Source Software, 2012 35th Annual IEEE Software Engnieering Workshop (SEW), Heraclion, Crete, Greece. 12-13 Oct. 2012, pp. 187 - 192.
[14]Sharma, K., Garg, R. Nagpal, C.K. Garg, R.K.,” Selection of Optimal Software Reliability Growth Models Using a Distance Based Approach”, Reliability, IEEE Transactions on, Volume: 59, Issue: 2, June 2010, pp. 266 – 276.