Chemistry Publications
Chemistry
2002
Surface structures of approximant phases in the
Al-Pd-Mn system
V. Fournée
Iowa State UniversityA. R. Ross
Iowa State UniversityThomas A. Lograsso
Iowa State University, [email protected]
James W. Anderegg
Iowa State University, [email protected]
C. Dong
Iowa State University
See next page for additional authors
Follow this and additional works at:
http://lib.dr.iastate.edu/chem_pubs
Part of the
Biological and Chemical Physics Commons
,
Materials Science and Engineering
Commons
, and the
Physical Chemistry Commons
The complete bibliographic information for this item can be found at
http://lib.dr.iastate.edu/
chem_pubs/41
. For information on how to cite this item, please visit
http://lib.dr.iastate.edu/
howtocite.html
.
This Article is brought to you for free and open access by the Chemistry at Iowa State University Digital Repository. It has been accepted for inclusion in Chemistry Publications by an authorized administrator of Iowa State University Digital Repository. For more information, please contact
Abstract
We present a study of the surface of the ξ′-Al-Pd-Mn approximant phase based upon scanning tunneling
microscopy and low-energy electron diffraction. Several structures are observed on two different samples
grown either by the Bridgman technique or by a self-flux method, and which contain various degrees of
disorder. We also describe some other complex crystalline phases that are sometimes observed on the fivefold
surface of Al-Pd-Mn quasicrystalline samples after the sputter-annealing cleaning process under ultrahigh
vacuum conditions. This includes the T approximant phase resulting from surface decomposition after a
high-temperature annealing.
Keywords
Ames Laboratory, Materials Science and Engineering, Physics and Astronomy
Disciplines
Biological and Chemical Physics | Materials Science and Engineering | Physical Chemistry
Comments
This article is from
Physical Review B
66, no. 16 (2002): 165423, doi:
10.1103/PhysRevB.66.165423
.
Authors
V. Fournée, A. R. Ross, Thomas A. Lograsso, James W. Anderegg, C. Dong, Matthew J. Kramer, I. R. Fisher,
Paul C. Canfield, and Patricia A. Thiel
Surface structures of approximant phases in the Al-Pd-Mn system
V. Fourne´e,*A. R. Ross, T. A. Lograsso, J. W. Anderegg, C. Dong,† M. Kramer, I. R. Fisher,**P. C. Canfield, and P. A. Thiel‡
Ames Laboratory, Departments of Materials Science and Engineering, Physics and Astronomy, and Chemistry, Iowa State University, Ames, Iowa 50011
共Received 8 April 2002; Submitted to Physical Review B April 2002; published 29 October 2002兲 We present a study of the surface of the⬘-Al-Pd-Mn approximant phase based upon scanning tunneling microscopy and low-energy electron diffraction. Several structures are observed on two different samples grown either by the Bridgman technique or by a self-flux method, and which contain various degrees of disorder. We also describe some other complex crystalline phases that are sometimes observed on the fivefold surface of Al-Pd-Mn quasicrystalline samples after the sputter-annealing cleaning process under ultrahigh vacuum conditions. This includes the T approximant phase resulting from surface decomposition after a high-temperature annealing.
DOI: 10.1103/PhysRevB.66.165423 PACS number共s兲: 61.44.Br, 68.35.Bs
I. INTRODUCTION
Quasicrystals 共QC’s兲 are aperiodic intermetallic alloys that possess a long-range positional order, with coherence length that can reach the micron scale.1–3They often exhibit crystallographically forbidden symmetries, most commonly fivefold and tenfold. The composition domain in which they form is usually limited to a small region in the phase dia-gram. This is due to a constraint imposed by the average number of valence electrons per atom (e/a) related to an electronic stabilization mechanism.4
In the neighborhood of this precise chemical composition, one often finds periodic structures with giant unit cells and a local atomic order that is very similar to the local order found in the QC. These alloys are called approximant phases as they are intrinsically related to their parent quasicrystal. More precisely, and in the framework of the cut method, the structures of a QC and its approximants can be derived from the same periodic object in a hyperspace of dimension N
⬎3.5 Depending on the relative orientation of the three-dimensional共3D兲physical subspace embedded in the hyper-space, the same N-dimensional periodic object will lead to either a quasiperiodic structure or a periodic approximant, via the cut and projection method.
So far, surface studies of this class of materials mainly revolve around a few quasicrystalline systems for which single grains can be prepared.6 Besides the physical proper-ties of technological relevance usually associated with these materials7—like low friction, reduced adhesion and high hardness—surface studies are motivated by fundamental in-terest in understanding how the complex atomic structure and the associated physical properties are modified at the 2D surface truncation.8In particular, what is the influence of the atomic clusters usually considered as the building blocks of the 3D structure of both QC’s and their approximants? For QC’s this actually depends on the way the surface has been prepared in the ultrahigh vacuum 共UHV兲chamber, the main options being fracture vs cycles of sputtering and annealing. Scanning tunneling microscopy 共STM兲experiments have been carried out on several QC’s, mostly on high-symmetry surfaces of the Al-Pd-Mn icosahedral phase. A rough and
corrugated surface is observed when it is prepared by fracture.9It is believed that this results from a special stabil-ity of the cluster units that force the fracture plane to circum-vent the clusters. On the other hand, when the same fivefold surface is prepared by cycles of sputtering and annealing, a terrace and step morphology is observed.10–13Both the three step heights measured 共2.4, 4.1, and 6.5 Å兲 and the fine structure observed on the terraces are fully consistent with a bulk-terminated surface. Motifs with fivefold or tenfold sym-metry appear in the high-resolution STM images, corre-sponding to cross sections through the 3D clusters of the bulk.
These recent results on quasicrystalline surfaces raise questions about the relative stability of the atomic clusters, since different preparation methods result in different surface topographies. It is clear that during sputtering by energetic Ar⫹ ions共from 0.5 to 2 keV兲, the ion energy is sufficient to break apart the clusters and produce disorder in the top lay-ers. Sputtering also shifts the composition away from the stability range of the icosahedral phase due to preferential sputtering of Al.14Annealing at sufficiently high temperature is therefore necessary to restore both the composition and the quasiperiodic order. And, it is interesting to note that the formation of flat terraces corresponding to specific dense lay-ers is favored during this surface restoration rather than for-mation of the rough array of clusters that would 共 presum-ably兲mimic the fracturelike surface.
In this paper, we explore the surface structure of various approximant phases, which are also cluster-based materials, both by STM and low-energy electron diffraction 共LEED兲. We point out some key differences when they are compared with the surface of the parent icosahedral QC. The Al-Pd-Mn ternary system is a particularly interesting one as it contains, in addition to the stable icosahedral QC, a metastable de-cagonal QC and also various approximant phases with close chemical composition, both on the Mn-rich side共the T and R approximants兲and on the Pd-rich side共the
⬘
and approxi-mants兲of the phase diagram.15In the following section, we give experimental details about the single crystals of the ⬘
approximant samples used in this study, which were pro-duced by two different growth techniques. Then we presentPHYSICAL REVIEW B 66, 165423 共2002兲
results concerning their surface structure perpendicular to the pseudo-tenfold axis. One sample appears to contain a higher density of structural defects than the other. We also describe some observations of other complex crystalline phases re-sulting from a surface transformation of an icosahedral Al72Pd19.5Mn8.5 quasicrystalline sample. The preparation
process in UHV induces this transformation. The complex crystalline phases are the T approximant phases formed by surface decomposition after a high-temperature annealing, and another phase resulting from a lower-temperature annealing.
II. EXPERIMENTAL DESCRIPTION
The experiments were performed on surfaces of the
⬘
-Al-Pd-Mn approximant crystals extracted from two dif-ferent single grains. The first one was grown by the Bridg-man method using a nominal composition of Al77.5Pd19Mn3.5. The second one was grown by a self-fluxtechnique starting from a ternary melt with a composition of Al80.5Pd17.25Mn2.25.16 The latter sample had a rodlike
mor-phology, the pseudo-tenfold ( p-10f ) symmetry axis being the preferred growth direction. The composition of the re-sulting crystal as determined by energy dispersive x-ray spectroscopy共EDX兲was approximately Al72Pd25Mn3. Such
crystals have dimensions up to 2 cm along the p-10f axis. Transmission electron microscopy 共TEM兲 and x-ray diffrac-tion were used to verify the crystal structure of both types of samples, and TEM was used to check for crystalline imper-fections, especially phason strain.17Selected area diffraction patterns 共SADP’s兲 were obtained for the three diad axes
关100兴, 关010兴, and 关001兴. Lattice images were also obtained from some zones, principally the 关010兴. The flux-grown samples usually showed few phason defects and were mostly perfect
⬘
phase, whereas the density of bulk defects was much higher in the Bridgman-grown samples. The lattice parameters determined from SADP’s were a⬘⫽23.4 Å,b⬘⫽16.5 Å, and c⬘⫽12.4 Å, consistent with previously published values.18The high-energy electron-diffraction pat-terns were consistent with the Pnma space group expected for the
⬘
phase.Both samples were oriented by Laue to within ⫾0.2° of the p-10f axis, and mechanically polished down to 0.25m. The size of the Bridgman-grown sample was fairly large
共over 1 cm2兲and its chemical composition was homogeneous over the entire surface. A contrario, the flux-grown sample presented regions of nearly pure Al detected by scanning electron microscopy and EDX, coexisting with the
⬘
phase, especially in the center of the sample, due to flux inclusions共and eutectic solidification兲. In spite of this inhomogeneity, the LEED pattern was uniform across the sample. This indi-cates that LEED did not sense the regions of Al-rich phase, except perhaps as a contribution to the background intensity. In the following, we will refer to the Bridgman-grown sample as BG and to the flux-grown sample as FG.
The QC sample was grown by the Bridgman method and its chemical composition was Al72Pd19.5Mn8.5.19 A surface
perpendicular to the fivefold symmetry axis was extracted and polished in the same manner as previously described.14
The samples were mounted on Ta plates and loaded into the UHV chamber that was equipped with an Omicron variable temperature STM and a LEED-Auger spectrometer. A clean surface was achieved by cycles of Ar⫹ sputtering at room temperature followed by annealing. The Ar⫹ beam energy was progressively reduced from 2 to 0.5 kV, and the etching time was about 30 min for each cycle. The typical annealing temperatures we used were 820 K for the
⬘
approximant and 900 K for the icosahedral phase. The annealing time prior to a LEED or an STM experiment ranged from 2 to 4 h.III. RESULTS
A. The⬘approximant grown by the Bridgman method
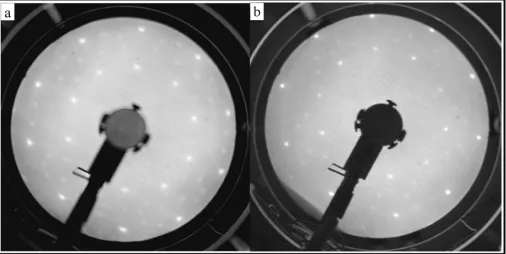
The LEED pattern of the clean surface of the BG sample is shown in Fig. 1共a兲. It is dominated by two rings of bright diffraction spots with apparent tenfold symmetry. The ratio between the diameters of the two rings equals 1.6, consistent with the golden mean ⬃1.618. More diffraction spots with faint intensity are also visible. All diffraction spots form lines that are periodically spaced, which is an essential difference from the diffraction pattern of the fivefold surface of the icosahedral QC shown in Fig. 1共b兲. Also, the diffraction spots forming the decagonal ring are of equal intensity in the case of the
⬘
approximant, whereas two sets of five spots with different intensities can be distinguished in the case of the QC for the same energy.STM examination of the BG sample surface after a few sputter-annealing cycles reveals a terrace and step morphol-ogy. This structure, which is found over the whole surface, displays several differences from the terrace and step struc-ture usually associated with the quasicrystalline termination of the fivefold QC sample. First, the terraces are exception-ally large, sometimes bigger than 1 m2, as shown in Fig. 2共a兲.共While similar-sized terraces have been reported for the fivefold surface of a QC sample by another group,6 we find that they are typically smaller.兲 Second, the step edges ap-pear relatively smooth on the surface of the
⬘
approximant, whereas step edges are usually irregular and meandering on the fivefold surface of the QC. Third, line profiles across the
⬘
step edges reveal a single step height as expected for a periodic crystal. This is unlike the three step heights found on the quasiperiodic surface. Height histograms, such as that shown in Fig. 2共b兲, were used to determine the step height of the ⬘
sample, h⫽8.07 Å 共the root-mean-square value is⫽0.16 Å). 共This approach is more accurate than using line profiles.兲 The measured value of h corresponds roughly to half the period (b⬘⫽16.5 Å) along the p-10f axis, which is the b⬘axis.
Further insight into the nature of the steps is provided by examining the
⬘
structure model proposed by Boudardthe most favorable atomic layers for surface termination cor-respond to a particular pair of layers, which are related by a mirror plane.
Higher magnification in STM reveals a fine structure on the terraces, which can also be understood in light of the Boudard et al.18 model. Figure 2共b兲 presents a 100
⫻100 nm2 STM image recorded on one of the terraces. The inset includes a height histogram and the fast-Fourier trans-form 共FFT兲 of this same image. The height histogram sug-gests that STM actually probes two different layers: the white dots correspond to groups of atoms that form an in-complete top layer atop a more dense共darker兲bottom layer. In addition, line profiles in the darker regions of the image reveal that the bottom layer has an intrinsic corrugation of 0.7 Å 共equal to the difference between the minimum and
maximum of the line profiles兲. Also, line profiles across white dots show that they lie about 1.39 Å above the top of the bottom layer.
[image:5.612.56.562.60.314.2]The interpretation of this fine structure is as follows. First, the 1.39 Å distance is only slightly shorter than the distance between the planes y⫽0.16 and y⫽0.25 of the bulk model, which is 1.49 Å. Second, the corrugation of the bottom layer itself 共measured as 0.7 Å兲 corresponds to the distance be-tween planes y⫽0.12 and y⫽0.16, which is 0.66 Å. Third, the plane at y⫽0.16 has a very low atomic density. We there-fore postulate that the bottom layer seen in the STM image
FIG. 1. LEED pattern at 85 eV of the Bridgman-grown 共BG兲 ⬘-Al77.5Pd19Mn3.5 sample in共a兲 and of the five-fold surface of the
[image:5.612.317.559.503.650.2]icosahedral Al72Pd19.5Mn8.5QC in共b兲.
FIG. 2. a兲STM image (2⫻2m2) showing the terrace and step
morphology of the p-10f surface of the 共BG兲 ⬘-Al77.5Pd19Mn3.5
approximant. b兲STM image (100⫻100 nm2) of the fine structure
on a terrace. Inset: height histogram and FFT of the same image. The principal spots in the FFT have been enhanced for clarity, and appear as black dots.
FIG. 3. The layer structure perpendicular to the b⬘axis of the ⬘phase according to the structure model by Boudard et al.18The four different layer types at y⫽0, 0.12, 0.16 and 0.25 in units of b⬘ are represented. The distances between consecutive layers are men-tioned in parenthesis. Black circles are Al atoms, white circles are Pd atoms, gray circles are Mn atoms. The unit cell in the (a⬘,c⬘) is outlined.
SURFACE STRUCTURES OF APPROXIMANT PHASES IN . . . PHYSICAL REVIEW B 66, 165423 共2002兲
[image:5.612.72.279.559.664.2]originates from both the y⫽0.12 and y⫽0.16 planes, and that the top layer corresponds to an incomplete version of the
y⫽0.25 layer of the Boudard et al.18 model.
Because of the multiple layer morphology of the terraces, which produces roughness, we could not succeed in obtain-ing atomic resolution images. Still, some fine structure can be observed in the bottom layer, and the FFT of the STM image共Fig. 2兲shows ten spots describing a squeezed deca-gon emphasizing the p-10f symmetry of the surface.
Figure 4共a兲shows the same STM image as in Fig. 2, but a ‘‘height filter’’ has been applied in order to select only the top layer, which remains as a nonuniform pattern of black dots. The inset is a schematic of the FFT of the filtered im-age, and it is still composed of ten spots describing a squeezed decagon. This implies that the positions of the dots are not random but ordered, with the p-10f rotational sym-metry. The closer view in Fig. 4共b兲shows that each dot has the same nearly circular geometry and a diameter of 10.03 Å (⫽0.59 Å). They must therefore correspond to groups of atoms forming a specific geometric motif. The closest dis-tance between the centers of two adjacent groups is 12.3 Å (⫽1.1 Å).
The next step is to compare these observations concerning the top layer directly with the equivalent plane at y⫽0.25 of the bulk model. This plane is composed of Al decagonal rings surrounding a central Pd atom, outlined in Fig. 3.18The rings are located close to the vertices and the center of the rectangular 2D unit cell. The diameter of the decagons is 9.6 Å. The distance between centers of adjacent decagons is 12.5 Å. These values match reasonably well with our observations and we can therefore identify the groups of atoms forming the top layer observed in our STM image as these decagonal rings of Al atoms. In the bulk model, the rings are parts of 3D clusters of the Mackay type. The clusters are composed of a central Pd atom surrounded by a first icosahedral shell formed by Al 共and Mn兲atoms. A second shell is made of a larger icosahedron of Pd and an icosidodecahedron of Al. The clusters are connected by smaller and slightly distorted icosahedra. In the 2D plane at y⫽0.25, this 3D cluster struc-ture results in decagonal rings interconnected by glue atoms forming slightly distorted pentagons. In our experiment, we observe that in the incomplete top layer, only the decagonal rings are restored after the sputter-annealing cleaning pro-cess. This suggests that the cluster sites are energetically
more favorable than the glue sites, explaining why the de-cagonal rings—the black dots in Fig. 4—appear isolated from each other in the STM image.
B. The⬘approximant grown by the self-flux technique
We now describe the surface structure of the FG sample. We mentioned already that this sample presents regions of an Al-rich phase detected by scanning electron microscopy and EDX, coexisting with regions where the chemical composi-tion corresponds to the
⬘
phase. This sample was first loaded into a UHV chamber dedicated to LEED experiments. The resulting diffraction pattern at 75 eV is shown in Fig. 5. Similar to the BG sample, the brightest spots comprise two rings, the ratio between the diameters of the two rings again being close to the golden mean,⬃1.618. Furthermore, the positions of the diffraction spots in the LEED patterns of both samples are compatible with an orthorhombic crystal, and the spot intensities reflect the expected p-10f symmetry produced by the local icosahedral order of the structurally complex⬘
phase. But differences also exist between the two samples. First, more diffraction spots are visible in between the main p-10f rings for the FG sample than for the BG sample. This may be due to differences in short-term sample history 共e.g., number of annealing cycles to which the sample had been subjected prior to LEED兲, or due to the coexistence of several phases contributing to the LEED pat-tern in the case of the FG sample. The higher intensity and abundance of these ‘‘extra’’ spots makes the diffraction pat-tern in Fig. 5 look more periodic than the diffraction patpat-tern of the BG sample. We will argue later, in light of TEM re-sults, that this is probably due to the higher density of bulk structural defects contained in the BG sample, leading to incommensurate structures that emphasize the aperiodic ‘‘as-pect’’ of the pattern. The local probe of the STM also reveals clear differences between the surface structures of the BG and FG samples, as described in the remainder of this sec-tion. [image:6.612.70.277.57.165.2]After several sputter-annealing cycles, the FG surface was composed of flat regions with a terrace and step morphology, separated by very rough regions impossible to image with the STM. The flat regions themselves were of two different types. Figures 6 and 7 show the two different terrace-step
FIG. 4. a兲 Same as Fig. 2共b兲 but a ‘‘height filter’’ has been applied to select only the top layer. Inset: corresponding FFT. b兲 Enlarged view (30⫻30 nm2) of the image in a兲showing the regular
[image:6.612.351.523.58.200.2]structures. Each was encountered in homogeneous domains of the order of several microns in size. The tip had to be shifted by several tens of microns to change from one type of structure to the other. Therefore at least two different types of microstructures coexist on the surface of the FG sample.
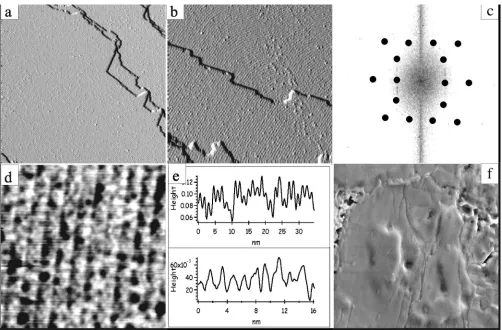
We first describe the type of structure whose characteris-tics are shown in Fig. 6. The flat terraces are separated by straight step edges with a single step height of about 8 Å
关Fig. 6共a兲兴. This value is similar to the step height measured for the BG sample, but the average terrace size is smaller and
the multiple layer morphology on a single terrace is not ob-served. The fine structure关Fig. 6共c兲兴is characterized by pen-tagonal motifs with bright contrast. A closer view is pre-sented in Fig. 6共d兲, with a different contrast to enhance the pentagonal features. The pentagons are about 0.4 Å above the average height of the surface. The side of the pentagons is about 5.7 Å (⫽0.26 Å). This is deduced from the STM images by measuring the peak-to-peak distance between ad-jacent maxima in line profiles taken along the edges of the pentagons. Although the pentagonal features seem to be lo-cated at random, the surface is actually quite well ordered. This is shown by the FFT of the STM image, which is com-patible with an orthorhombic lattice关a schematic of which is shown in Fig. 6共b兲兴. In addition, all the pentagons point in the same direction.
Here again, we can relate the pentagonal motifs observed experimentally to geometrical features in the different layers of the bulk model by Boudard et al.18Local pentagonal sym-metry is found in each of the layers 共see Fig. 3兲, but suffi-ciently large pentagons only appear at y⫽0.12 and y
[image:7.612.319.558.58.215.2]⫽0.16. Their edge length is equal to 4.89 Å. This is smaller by about 1 Å than the experimental value共5.7 Å兲, but is still within about 3 associated with the lengths measured by STM. Noting that surface relaxation effects could also take place, we believe that both pentagons outlined in Fig. 3 are reasonable candidates. We must now decide which of these two is the most consistent with our observations. According to the bulk model, the pentagons at y⫽0.12 are made of one Mn central atom surrounded by five Pd atoms. This layer is dense and puckered, the atomic positions actually lying in a range 0.08⭐y⭐0.12. The Pd atoms are about 0.6 Å above the central Mn atom and about 0.3 Å above the average height of the surface, consistent with the values reported above. The pentagons at y⫽0.16 are made of five Al atoms and there is no central atom. As mentioned above in the analysis of the BG sample surface, this layer has a very low atomic density such that the STM tip should also probe the
FIG. 6. STM images showing the first type of terraced morphol-ogy and fine structure observed on the surface of the flux-grown 共FG兲 ⬘-Al72Pd25Mn3 approximant. a兲 500⫻300 nm2; b兲 FFT, c兲
70⫻48 nm2; d兲 17⫻17 nm2. The principal spots in the FFT have
been darkened for clarity.
FIG. 7. STM images showing the second type of terraced mor-phology and fine structure observed on some regions at the surface of the flux-grown 共FG兲 ⬘-Al72Pd25Mn3 approximant. a兲 200 ⫻200 nm2; b兲FFT; c兲50⫻50 nm2; d兲30⫻30 nm2. The principal
[image:7.612.54.297.58.257.2]spots in the FFT have been darkened for clarity.
FIG. 8. HREM micrographs 共top兲 and corresponding SADPs 共bottom兲along the p-10f axis of the⬘approximant共FG samples兲 containing various degree of disorder. The left column共a,d兲 corre-sponds to the perfect ⬘ single crystal. The HREM image reveals the flattened hexagons arranged in zigzag. 共b,e兲 and 共c,f兲 corre-spond to two typical regions where phason-induced defects lead to new orderings.
SURFACE STRUCTURES OF APPROXIMANT PHASES IN . . . PHYSICAL REVIEW B 66, 165423 共2002兲
[image:7.612.73.279.468.675.2]next layer at y⫽0.12. If this were the case, then the corru-gation of the terraces would be larger than that observed experimentally. Also, adjacent pentagons connected by verti-ces are present in the layer at y⫽0.16 but not in the STM images. These arguments suggest that the layers at y⫽0.12 are favorable atomic planes for surface termination in the case of the FG sample. Then the bright features with pen-tagonal symmetry are identified as small rings made of five Pd atoms on top of a central Mn atom.
For the BG sample, the bright features seen in the STM images were identified as Al decagonal rings that are cross sections, at y⫽0.25, of the bulk Mackay-type clusters of the model of Boudard et al. For the FG sample, the motifs of bright contrast with fivefold symmetry are identified as Pd pentagonal rings that are also cross sections, at y⫽0.12, of the same clusters. In the surface plane perpendicular to the
关010兴⬘axis, the cross sections of these clusters are located at the nodes and at the center of the rectangular unit cell. Accordingly, if the surface structure, like the one shown in Fig. 6, was a perfect truncation of the bulk along the y
⫽0.12 layer, then the set of bright pentagonal motifs should
form a perfect rectangular centered lattice, which is not ob-served. However, the positions of the pentagons in the STM images are consistent with this scheme. For example, it is possible to superimpose a set of unit cells on the STM im-age, from which we see关Fig. 6共d兲兴that the pentagonal rings are located either at the nodes or at the center of the rectan-gular lattice. These sites appears to be either occupied by a complete pentagonal ring or they are completely vacant.
[image:8.612.71.277.55.391.2]This fact—that the pentagonal rings are either completely present or completely absent—again suggests that rebuilding
[image:8.612.329.547.58.312.2]FIG. 9. HREM micrographs taken perpendicular to the p-10f axis of the⬘approximant共FG sample兲. a兲low magnification im-age showing terraces crossed by linear defects. b兲 higher magnifi-cation showing the arrangement of the flattened hexagons arranged in zigzag. In the region of linear defects共darker regions兲, the order is altered. The scale is given by the rectangular unit cell drawn on the image.
[image:8.612.338.537.486.665.2]FIG. 10. a-c兲STM images obtained on the five-fold icosahedral QC surface after decomposition by annealing at low temperature. a兲 150⫻150 nm2; b兲50⫻50 nm2; c兲40⫻26 nm2.
the Mackay clusters after the sputter annealing is a common tendency on the p-10f surface of the
⬘
crystals. In sum-mary, although the surfaces of the BG and the FG samples terminate at different layers, both surfaces share a common feature, which is that the cluster sites seem energetically fa-vored as compared to the glue sites.The characteristics of the second type of terrace-step structure encountered on the surface of the FG sample are shown in Fig. 7. Again, we find flat terraces with a roughness smaller than 0.6 Å separated by step edges, but here several step heights are measured, which are all equal to an integer number of h⬃2 Å. The FFT of the STM image in Fig. 7共b兲 suggests a square lattice. This is confirmed by the fine struc-ture on the terraces shown in Figs. 7共c兲and 7共d兲. The dimen-sions of the 2D unit cell in the plane of the surface can be deduced from the STM image and is about 19⫻19 Å2. The square lattice contains some structural defects. To the best of our knowledge, the lattice parameters as deduced from our data do not correspond to any identified approximant of the QC phase.
The results presented above revealed differences between the BG and the FG samples at their surfaces. Also the FG sample seems to contain an extra phase. To gain insight into the possible origin of these differences, a TEM study on both types of samples was undertaken. Approximant structures formed in this region of the phase diagram have already been
studied by TEM.17,18,20In particular, Klein et al. showed that the
⬘
phase was related to anotherapproximant by a phase transformation occurring through plastic deformations.17 An-other approximant phase named⬙
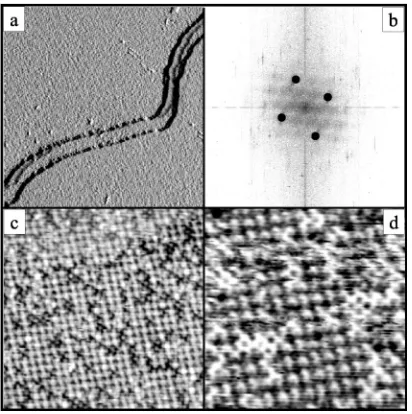
and containing structural defects 共phason defects兲was also observed by TEM and in-terpreted as an intermediate state of such a phase transforma-tion.Figure 8 shows some examples of high-resolution elec-tron microscopy共HREM兲micrographs and their correspond-ing SADP’s viewed along the p-10f axis for a FG sample
共left column兲and a BG sample共central and right columns兲. These samples were extracted from the same ingots as the particular samples used in the surface study. The FG sample appears as a mostly perfect
⬘
phase 关Fig. 8共a兲兴, although some limited regions contained linear defects. Evidence for a much higher density of defects is found for the BG samples关Figs. 8共b兲and 8共c兲兴.
[image:9.612.57.559.54.384.2]Finally, because two different types of structure were ob-served on the FG sample by STM, this particular sample was further analyzed by TEM after the STM experiments, to check whether the bulk structure had remained intact. A thin slice was cut perpendicular to the p-10f axis and mechani-cally thinned, then dimpled and ion milled. The typical SADP pattern taken along the关010兴⬘direction confirms that the sample is, in general, still a good
⬘
single crystal withFIG. 12. a-d兲 STM images showing the terraced morphology and some fine structure for the T-approximant of Al-Pd-Mn. a兲 150
⫻150 nm2; b兲100⫻100 nm2; c兲FFT; d兲15⫻15 nm2. e兲height profiles across共top兲and along共bottom兲the lines of bright contrast. f兲SEM image (8.5⫻8.5m2). The principal spots in the FFT have been darkened for clarity.
SURFACE STRUCTURES OF APPROXIMANT PHASES IN . . . PHYSICAL REVIEW B 66, 165423 共2002兲
large defect-free areas. Some spots corresponding to a thin
B2 cubic layer with a lattice parameter equal to 3.15 Å are
also present in the diffraction pattern. Another type of dif-fraction pattern was observed less frequently, which corre-sponds to a 1D-incommensurate modulated structure based on the
⬘
lattice. The parameters of the modulated lattice are (amod⫽a⬘⫽23.4 Å and cmod⫽6.81c⬘⫽87.8 Å). TheHREM image at low magnification in Fig. 9共a兲 shows the presence of terraces crossed by linear defects. The density of defects is rather low over most of the sample but can be high in some limited areas, like the one shown in Fig. 9共a兲. Figure 9共b兲is a higher magnification of a typical region crossed by linear defects. The packing of the flattened hexagonal units arranged in zigzag, which is characteristic of the
⬘
phase, can be observed. In the region of linear defects, the phase of the hexagons is altered. The defects develop along the关100兴⬘ direction because the defect structure has the same periodicity (amod⫽a⬘). The growth along the关001兴⬘
direc-tion is quite limited because of the incommensurability (cmod⫽6.81c⬘).
These observations by TEM shed some light on the STM results presented earlier. First, the square lattice with param-eter⬃19 Å deduced from the STM images共Fig. 7兲could be related in some way to the thin B2 cubic layer with param-eter⬃3.15 Å seen in the SADP’s. The formation of the cubic layer could result from the ion milling used to prepare the sample for TEM. It could also have been formed during the surface preparation process in the STM chamber. Indeed, the formation of a metastable B2 overlayer on the high-symmetry surfaces of the icosahedral Al-Pd-Mn QC is a fre-quent phenomenon.21For the fivefold surface, the orientation relationship corresponds to the 关110兴B2 axis parallel to the
fivefold axis of the underlying QC.22In the present case, the
关110兴B2 axis would be parallel to the p-10f 关010兴⬘ axis.
Then, perpendicular to the surface plane, the distance be-tween共110兲consecutive planes共i.e., the step height兲should be about 3.15/&⫽2.2 Å, which is consistent with the ex-perimental step heights being integral multiples of about 2 Å. In the共110兲surface plane, the unit cell should be a rectangle with edge lengths equal to 3.15 and 3.15&⫽4.5 Å. Then the ratio between the parameters of the square lattice共19 Å兲and of the rectangular (110)B2 lattice are close to integral values
(19/3.15⬃6, 19/4.5⬃4), suggesting that the surface struc-ture in Fig. 7 could be a (6⫻4) superstructure on the (110)B2 surface. This hypothesis is supported by a previous LEED study of a single-grain sample of this material, which showed several reconstructions of the 共110兲surface.22
Finally, the TEM analysis shows that the main difference between the BG and the FG single crystals is the density of bulk structural defects that they contain, with the BG sample containing a higher defect density. The STM images shown in Figs. 2 and 6 both correspond to the
⬘
phase or a disor-dered version of it. At present there are insufficient data to correlate the various types of surface terminations observed by STM to the degree of structural quality of the bulk struc-tures as observed by TEM. However, the high density of linear defects corresponding to 1D-incommensurate modu-lated structures in the BG samples could account for the differences noted above between the LEED patterns of bothsamples. In general, our work demonstrates the variability of results that can be obtained when studying surfaces of samples that nominally belong to the same bulk phase in such complex materials.
C. Other crystalline phases induced by sputter annealing on the fivefold surface of an Al72Pd19.5Mn8.5icosahedral
quasicrystal
We now turn to a description of several periodic structures that appeared as overlayers on the fivefold surface of an Al72Pd19.5Mn8.5icosahedral QC sample after specific
anneal-ing conditions.
The first one was observed in the central part of the QC sample surface after annealing at a relatively low tempera-ture共770 K兲, while regions closer to the edges of the sample presented the usual characteristics of the fivefold quasiperi-odic surface. We mention that the sample surface had a lus-terless appearance after the annealing, which is unusual as it normally retains the mirrorlike finish given by the mechani-cal polishing.
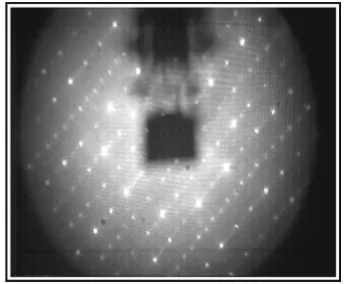
STM images of this ‘‘low-temperature’’ phase are shown in Fig. 10. Terraces are separated by steps that are 1.9
⫾0.1 Å high. Incomplete rows of bright spots appear on the terraces that look, therefore, anisotropic. The diameter of a bright spot is about 7 Å (⫽0.40 Å). The distance between two adjacent rows is A⫽11.3 Å (⫽0.73 Å). Along the rows, the distance between two adjacent bright spots is B
⫽9.6 Å (⫽0.22 Å). In areas where the bright spots are missing, the STM can resolve additional smaller features. Line profiles taken either along or perpendicular to the direc-tion of the rows leads to the structural model proposed in Fig. 11. In that scheme, the underlying lattice would be rect-angular with parameters a⫽1.9 Å and b⫽4.8 Å. Then the bright dots would form a rectangular lattice identified as a
p(6⫻2) reconstruction on the underlying lattice. The posi-tions along the B direction tend to be more frequently occu-pied than the positions along the A direction, explaining the apparent anisotropy on the STM images.
Note that on the right side of the STM image in Fig. 10共c兲, the lattice formed by the bright dots looks hexagonal rather than rectangular. This was observed in limited areas of the sample surface. The occurrence of this hexagonal struc-ture can be understood using the same structural model as in Fig. 11. Indeed, the transformation from the rectangular to the hexagonal lattice only requires that one row of bright dots out of every two be shifted by the translation vector B/2. This is illustrated schematically in Fig. 11. If this interpreta-tion is correct, the edge length of each hexagon formed by the bright dots should equal
冑
A2⫹(B/2)2⫽12.2 Å, which is very close to the value of 11.8 Å 共⫽0.56 Å兲measured from the STM images. At present we cannot identify this structure further; its characteristics do not correspond to a known bulk phase.Finally, we describe the surface of another type of approx-imant structure that appeared after annealing the fivefold sur-face of an Al72Pd19.5Mn8.5 icosahedral QC at a higher
extracted from the same ingot as the sample used above. We believe that the surface transformation described below is similar to previous observations by Ledieu et al.23
Flat areas with a terrace and step morphology could be observed with am size, separated by rough regions impos-sible to image with the STM. Figure 12 is a montage of STM images of terraces and their fine structure. The step edges are straight, forming segments that are sometimes perpendicular to each other. The single step height equals 6.2 Å. As for the
, approximant 共BG sample兲, we observed consistently, across several STM images, that a small terrace is usually followed by a larger one. Lines of bright contrast can be seen in Figs. 12共a兲and 12共b兲, and a closer view is shown in Fig. 12共d兲. Atomic resolution could not be achieved but the FFT of one such image possesses symmetry compatible with an orthorhombic lattice. Furthermore, the height profiles in Fig. 12共e兲, taken parallel and perpendicular to these lines, show a periodicity in both directions, with a period equal to 15 and 13 Å, respectively. These values match very well with the lattice parameters of the T-Al72/3Pd3.2Mn24.5 approximant,
aT⫽14.72 Å, bT⫽12.51 Å, cT⫽12.59 Å, as described by
Klein et al.24Its structure can be described as the stacking of three different layers along the bT p-10 f symmetry axis. It
seems natural to expect that the bT axis would parallel the
fivefold axis of the underlying quasicrystal and therefore the surface plane would correspond to the (aT,cT) plane. Then
the experimental step height roughly equals half the value of the bTparameter. We speculate that the most favorable atomic plane for surface termination also corresponds to a particular pair of layers related by a mirror plane, just as in the
⬘
phase.After the STM experiment, the sample was removed from the chamber and loaded in another UHV chamber equipped with a scanning Auger microscope 共SAM兲 and a scanning electron microscope 共SEM兲. The surface had to be exposed to air during the transfer and therefore it was covered by an oxide layer. This surface as seen by SEM关see Fig. 12共f兲兴is made of plain and smooth areas coexisting with some other rough and porous regions. The surface composition give by Auger spectroscopy is Al74Pd3Mn23, but this includes the
contribution of the oxide layer to the Auger signal. After Ar⫹ sputtering to remove the air contamination, the composition is Al52Pd13Mn35 in the flat areas and Al52Pd22Mn26 in the
rough regions. These chemical compositions are derived us-ing elemental sensitivity factors and are especially low in Al due to the well-known preferential sputtering effect in this system. It was not possible to anneal the sample in this UHV chamber. Nevertheless, the data show that the surface has decomposed into two phases, one of which is Mn rich and rather flat. The Mn enrichment is consistent with the hypoth-esis that part of the surface of the QC sample has trans-formed into the T approximant.
The Mn enrichment of the surface during the sputter-annealing cleaning process was observed on several samples issued from the same ingot. One of these samples was ana-lyzed after the surface decomposition by EDX, along the sample thickness共perpendicular to the surface plane兲. It was found that the chemical composition was exactly that of the icosahedral phase, and no second phase could be detected.
Noting that the spatial resolution of EDX is about 1m, and hence is unable to resolve the surface from the bulk along the surface normal, this result implies that the precipitation of second phase occurs only in the near-surface region. Finally, this sample was post-annealed in a sealed evacuated tube at 970 K for 7 days. It was then repolished down to 0.25 m and loaded again in the STM chamber. No surface decompo-sition was observed for annealing temperatures up to 920 K, which is 20° higher than the annealing temperature we use to obtain the perfect quasicrystalline surface.13We suggest that this type of surface transformation, which has been reported by a few other groups23,25 is not only determined by the annealing temperature but also by the long-term thermal his-tory of the sample.
In summary, the Mn enrichment of the surface, the lattice parameters deduced from the STM images, and the FFT’s compatibility with an orthorhombic lattice, all suggest that the complex crystalline phase formed by decomposition at high temperature corresponds to the T approximant. Our other observations suggest that a combination of the imme-diate and long-term thermal histories of the sample deter-mine whether it will form. When it does form, it nucleates first at the sample’s surface.
IV. CONCLUSIONS
We have observed the surface structure of several com-plex crystalline phases related to the icosahedral Al-Pd-Mn quasicrystal. Some of them appear as overlayers induced by sputtering and annealing on the five-fold QC surface. This includes the Mn-rich T approximant as well as a recon-structed surface probably corresponding to another complex orthorhombic phase. In these cases, the chemical composi-tion in the near-surface region was driven out of the stability range of the icosahedral phase. The temperature at which the composition change occurred seems to depend on the sam-ple’s thermal history.
We also have presented results on the different mospho-logies observed on the p-10 f surface of
⬘
single crystals, grown either by Bridgman or by a self-flux technique. For both samples, the LEED pattern shows the expected p-10 f symmetry. Under the local probe of STM, the surface of the BG sample appears homogeneous but the FG contains one extra phase. The latter has a nearly square lattice with pa-rameters that do not match any known approximant structure in this system, but could be related to the formation of a cubic B2 layer oriented with the 关110兴B2axis parallel to thep-10 f axis of the
⬘
crystal. This difference in phase purity, plus other differences in details of the LEED and STM data for the two samples, illustrates the variability that can arise in surface of samples derived from the same bulk phase, especially in such complex materials.In spite of the differences, for both the BG and the FG samples, we have seen that details of the STM images can be identified as specific planes perpendicular t the p-10 f axis of the bulk structure model derived by Boudard et al.18 Just as for the fivefold QC, the surface obtained after sputter-annealing can thus be interpreted as arising directly from the
⬘
bulk model. In particular, the incomplete top layer seen inSURFACE STRUCTURES OF APPROXIMANT PHASES IN . . . PHYSICAL REVIEW B 66, 165423 共2002兲
the high-resolution STM images actually corresponds to the preferential re-growth of decagonal rings 共BG sample兲 or pentagonal motifs共FG sample兲of atoms that are part of the same 3D cluster units of the
⬘
phase. This is in contrast with the fivefold QC where the surface regrowth encompasses not only the cluster sites but also the ‘‘glue sites,’’ forming to-gether a relatively dense and flat top layer.This leads us back to the question raised in the Introduc-tion about the relative stability of the cluster units. As re-ported in Ref. 18, the atomic structure of the
⬘
shows a close local similarity with the icosahedral phase, and in particular they share similar cluster units. The fact that the cluster sitesseem energetically more favorable than the glue sites for the approximant but not for the QC surface then suggests that the relative stability of the clusters not only depends on the clusters themselves but also on their environment, i.e., on the glue atoms.
ACKNOWLEDGMENTS
This work was supported by the Director, Office of Sci-ence, Office of Basic Energy SciSci-ence, Materials Science Di-vision of the U. S. Department of Energy under Contract No. W-405-Eng-82.
*Present address: LSG2M, CNRS-UMR 7584, Parc de Saurupt, F-54042 Nancy, France.
†On leave from Dalian University of Technology, 116024 Dalian,
China.
**Present address: Geballe Laboratory for Advanced Materials and Department of Applied Physics, McCullough Bldg. Rm 359, Stanford University, CA 94305-4045, USA.
‡Corresponding author: [email protected]
1D. Shechtman, I. Blech, D. Gratias, and J. W. Cahn, Phys. Rev.
Lett. 53, 1951共1984兲.
2A. P. Tsai, in Physical Properties of Quasicrystals, edited by Z.
M. Stadnik, Springer Ser. Solid-State Sci. Vol. 126, pp. 5–50 共1999兲.
3M. Boudard, M. De Boissieu, C. Janot, G. Heger, C. Beeli, H. U.
Nissen, H. Vincent, R. Ibberson, M. Audier, and J. M. Dubois, J. Phys.: Condens. Matter 4, 10149共1992兲.
4A. P. Tsai, in New Horizons in Quasicrystals: Research and
Ap-plications, edited by A. I. Goldman, D. J. Sordelct, P. A. Thiel, and J. M. Dubois共World Scientific, Singapore, 1997兲, pp. 1– 8.
5M. Boudard, in Quasicrystals: Current Topics, edited by E.
Belin-Ferre´, C. Berger, M. Quiquandon, and A. Sadoc共World Scien-tific, Singapore, 2000兲, pp. 73–90.
6R. McGrath, J. Ledieu, E. J. Cox, and R. D. Diehl, J. Phys.:
Condens. Matter 14, R119–R144共2002兲.
7J.-M. Dubois, J. Phys.: Condens. Matter 13, 7753–7762共2001兲. 8P. A. Thiel, A. I. Goldman, and C. J. Jenks, in Physical Properties
of Quasicrystals, edited by Z. M. Stadnik, Springer Ser. Solid-State Sci. Vol. 126, pp. 327–359,共1999兲.
9
P. Ebert, M. Feuerbacher, N. Tamura, M. Wollgarten, and K. Ur-ban, Phys. Rev. Lett. 77, 3827共1996兲.
10L. Barbier, D. Le Floc’h, Y. Calvayrac, and D. Gratias, Phys. Rev.
Lett. 88, 085506共2002兲.
11Z. Shen, C. R. Stoldt, C. J. Jenks, T. A. Lograsso, and P. A. Thiel,
Phys. Rev. B 60, 14 688共1999兲.
12J. Ledieu, R. McGrath, R. D. Diehl, T. A. Lograsso, D. W.
Delaney, Z. Papadopolos, and G. Kasner, Surf. Sci. Lett. 492, L729共2001兲.
13V. Fourne´e, T. Cai, A. R. Ross, T. A. Lograsso, J. W. Evans, and
P. A. Thiel共in preparation兲.
14C. J. Jenks, D. W. Delaney, T. E. Bloomer, S. L. Chang, T. A.
Lograsso, Z. Shen, C. M. Zhang, and P. A. Thiel, Appl. Surf. Sci.
103, 485共1996兲.
15M. Audier, M. Durand-Charre, and M. De Boissieu, Philos. Mag.
B 68, 607共1993兲.
16I. R. Fisher, M. J. Kramer, Z. Islam, T. A. Wiener, A. Kracher, A.
R. Ross, T. A. Lograsso, A. I. Goldman, and P. C. Canfield, Mater. Sci. Eng., A A294–296, 10–16共2000兲.
17H. Klein, M. Audier, M. Boudard, M. De Boissieu, L. Beraha, and
M. Duneau, Philos. Mag. A 73, 309共1996兲.
18M. Boudard, H. Klein, M. de Boissieu, and M. Audier, Philos.
Mag. A 74, 939共1996兲.
19D. W. Delaney, T. E. Bloomer, and T. A. Lograsso, in New
Hori-zons in Quasicrystals: Research and Applications, edited by A. I. Goldman, D. J. Sordelet, P. A. Thiel, and J. M. Dubois共World Scientific, Singapore, 1997兲, pp. 45–52.
20L. Beraha, M. Duneau, H. Klein, and M. Audier, in Proceedings
of the 6th International Conference on Quasicrystals, edited by S. Takeuchi and T. Fujiwara共World Scientific, Singapore, 1998兲, pp. 207–210.
21Z. Shen, M. J. Kramer, C. J. Jenks, A. I. Goldman, T. Lograsso,
D. Delaney, M. Heinzig, W. Raberg, and P. A. Thiel, Phys. Rev. B 58, 9961共1998兲.
22M. W. Heinzig, O. L. Warren, Z. Shen, C. J. Jenks, T. A.
Lograsso, and P. A. Thiel, in Mater. Res. Soc. Symp. Proc. ed-ited by J. M. Dubois, P. A. Thiel, A.-P. Tsai and K. Urban共 Ma-terial Research Society, Warrendale, Pennsylvania, 1999, Vol.
553兲, pp. 251–256.
23J. Ledieu, C. A. Muryn, G. Thornton, G. Cappello, J. Chevrier, R.
D. Diehl, T. A. Lograsso, D. Delaney, and R. McGrath, Mater. Sci. Eng., A A294–296, 871– 873共2000兲.
24H. Klein, M. Boudard, M. Audier, M. De Boissieu, H. Vincent, L.
Beraha, and M. Duneau, Philos. Mag. Lett. 75, 197共1997兲.
25D. Naumovic, P. Aebi, C. Beeli, and L. Schlapbach, Surf. Sci.