Suppression of transcription factor
PDX-1/IPF1/STF-1/IDX-1 causes no decrease in
insulin mRNA in MIN6 cells.
Y Kajimoto, … , J Miyazaki, Y Yamasaki
J Clin Invest.
1997;
100(7)
:1840-1846.
https://doi.org/10.1172/JCI119712
.
The insulin gene transcription factor PDX-1/IPF1/STF-1/ IDX-1 plays a key role in directing
beta cell-specific gene expressions. Recently, impairment of PDX-1 expression or activity
has been observed in beta cell-derived HIT cells cultured under high glucose
concentrations, and this has been suggested as a possible cause of the decrease in insulin
gene transcription. To investigate the pathophysiological significance of PDX-1 as a
determinant of the rate of insulin gene transcription, we suppressed its expression in beta
cell-derived MIN6 cells using an antisense oligodeoxynucleotide (ODN) and searched for
possible changes in the beta cell-specific gene expression. Treatment of MIN6 cells with an
18-mer phosphorothioate ODN complementary to a sequence starting at the translation
initiation codon of PDX-1 caused a potent, concentration-dependent reduction in PDX-1
expression; addition of 2 microM antisense ODN could reduce PDX-1 expression to
14+/-4% of the control. There was also a decrease in its DNA binding to the insulin gene A
element. Despite such suppression of PDX-1, Northern blot analysis revealed no decrease
in the amount of insulin mRNA in the MIN6 cells. Similarly, no changes were detected in the
transcription of the glucokinase or islet amyloid polypeptide gene, for which PDX-1 was
shown to function as a transcription factor. Thus, our findings dispute the physiological
significance of PDX-1 in determining the rate of insulin gene transcription. This […]
Research Article
Find the latest version:
http://jci.me/119712/pdf
J. Clin. Invest.
© The American Society for Clinical Investigation, Inc. 0021-9738/97/10/1840/07 $2.00
Volume 100, Number 7, October 1997, 1840–1846 http://www.jci.org
Suppression of Transcription Factor PDX-1/IPF1/STF-1/IDX-1 Causes No Decrease
in Insulin mRNA in MIN6 Cells
Yoshitaka Kajimoto,* Hirotaka Watada,* Taka-aki Matsuoka,* Hideaki Kaneto,* Yoshio Fujitani,* Jun-ichi Miyazaki,‡
and Yoshimitsu Yamasaki*
*First Department of Medicine, and ‡Department of Nutrition and Physiological Chemistry, Osaka University School of Medicine, Suita
565, Japan
Abstract
The insulin gene transcription factor PDX-1/IPF1/STF-1/ IDX-1 plays a key role in directing b cell–specific gene ex-pressions. Recently, impairment of PDX-1 expression or ac-tivity has been observed in b cell–derived HIT cells cultured under high glucose concentrations, and this has been sug-gested as a possible cause of the decrease in insulin gene transcription. To investigate the pathophysiological signifi-cance of PDX-1 as a determinant of the rate of insulin gene transcription, we suppressed its expression in b cell–derived MIN6 cells using an antisense oligodeoxynucleotide (ODN) and searched for possible changes in the b cell–specific gene expression. Treatment of MIN6 cells with an 18-mer phos-phorothioate ODN complementary to a sequence starting at the translation initiation codon of PDX-1 caused a potent, concentration-dependent reduction in PDX-1 expression; addition of 2 mM antisense ODN could reduce PDX-1 ex-pression to 1464% of the control. There was also a decrease in its DNA binding to the insulin gene A element. Despite such suppression of PDX-1, Northern blot analysis revealed no decrease in the amount of insulin mRNA in the MIN6 cells. Similarly, no changes were detected in the transcrip-tion of the glucokinase or islet amyloid polypeptide gene, for which PDX-1 was shown to function as a transcription factor. Thus, our findings dispute the physiological signifi-cance of PDX-1 in determining the rate of insulin gene tran-scription. This means that other components constituting the transcription-controlling machinery need to be evalu-ated in order to understand the molecular basis of impaired insulin biosynthesis such as that observed due to glucose toxicity. (J. Clin. Invest. 1997. 100:1840–1846.) Key words:
gene expression regulation • transcription factors • homeo-domain protein • antisense oligodeoxynucleotide
Introduction
Non–insulin-dependent diabetes mellitus (NIDDM)1 is a
mul-tifactorial disease characterized by insulin resistance and
im-paired insulin secretion (1). Characterization of NIDDM model animals has revealed extensive degranulation of pan-creatic b cells that can be observed simultaneously with the on-set of overt diabetes, thus suggesting the significance of the im-pairment of insulin synthesis as a cause of disturbed b cell function (2, 3). To understand the molecular background for such a decrease in insulin synthesis, we need to identify the molecular components that determine the rate of insulin gene transcription and how their function is disturbed in NIDDM cases.
Among various factors that potentially inhibit insulin bio-synthesis, glucose toxicity has been the main focus of recent re-search. Prolonged exposure of pancreatic b cells to high glu-cose levels exerts toxic effects on the cells (gluglu-cose toxicity), which can be characterized by impaired insulin biosynthesis and extensive degranulation (4). Recently, the pancreatic b
cell–derived HIT cell has been used as a model to show that exposure of the cells to chronic high glucose concentration (5–7) or to D-ribose (8), which induces a glycation reaction, causes reduction of insulin gene promoter activity and, subsequently, decreases in insulin mRNA and insulin content. These studies also revealed a reduction in the DNA-binding activity of the b
cell–specific transactivating factor PDX-1/IPF1/STF1/IDX-1 (9–11). Thus, the possibility arose that the impaired PDX-1 function per se is pathophysiologically responsible for the de-crease in insulin gene promoter activities. A similar reduction in PDX-1 expression was observed in pancreatic b cells in vivo; in 90% pancreatectomized diabetic rats, chronic hyperglyce-mia was associated with decreased mRNA levels of both insu-lin and PDX-1 (12).
PDX-1 is a homeodomain-containing transcription factor which binds to the A element motif of the insulin genes and contributes to directing the genes’ b cell–specific expression (9). Among the various transcription factors of the insulin gene, including those yet to be cloned, such as RIPE3b1 (13), the physiological significance is most evident for PDX-1 (14, 15). The transcription factor appears before insulin during the ontogeny of the mouse pancreas, and its expression eventually becomes restricted to the b cells in the adult (15). Besides its role in insulin gene expression, PDX-1 has been suggested to be involved in glucokinase and islet amyloid polypeptide (IAPP) gene expressions (16–18).
As a step toward elucidating the machinery that deter-mines the rate of insulin gene transcription and understanding the molecular basis of the impaired insulin biosynthesis ob-served in NIDDM patients, we investigated the role of PDX-1 in determining the transcriptional rate of insulin and other b
cell–specific genes. To suppress PDX-1 expression in b cell–
Y. Kajimoto and H. Watada contributed equally to this study. Address correspondence to Dr. Y. Kajimoto, First Department of Medicine, Osaka University School of Medicine, 2-2 Yamadaoka, Suita City, Osaka Pref. 565, Japan. Phone: 879-3633; FAX: 81-6-879-3639; E-mail: [email protected]
Received for publication 31 December 1996 and accepted in re-vised form 14 August 1997.
derived MIN6 (19) and bTC1 (20) cells, we used an antisense oligodeoxynucleotide (ODN) strategy and then evaluated the effects on gene expression. We report here that, unlike sup-pression of another insulin gene transcription factor, E2A/Pan (21), which constitutes E element–binding IEF1 (13), suppres-sion of PDX-1 expressuppres-sion causes no changes in insulin gene ex-pression.
Methods
Materials. Radioisotopes were purchased from Amersham Japan (Tokyo, Japan). Tissue culture media were purchased from Nacalai Tesque, Inc. (Kyoto, Japan), and FBS was from ICN Biomedicals, Inc. (Costa Mesa, CA). The anti–PDX-1 (IPF1) antiserum was estab-lished recently by us (16) after immunizing a rabbit with the synthetic peptide SPQPSSIAPLRPQE representing amino acid residues 269– 282 of the PDX-1 peptide (GenBank accession number X74342) (9). The anti-NeuroD polyclonal antibody (sc-1084) was purchased from Santa Cruz Biotechnology, Inc. (Santa Cruz, CA). Basic laboratory procedures were performed according to standard protocols (22) un-less otherwise stated.
ODNs. An 18-mer phosphorothioate antisense ODN comple-mentary to a sequence starting at the ATG initiation codon of mouse PDX-1 (59-CTGCTCCTCACTGTTCAT-39) and control sense and reverse phosphorothioate ODNs (59 -ATGAACAGTGAGGAG-CAG-39 and 59-TACTTGTCACTCCTCGTC-39, respectively) were synthesized using an automated DNA synthesizer (model 391; Ap-plied Biosystems, Foster City, CA).
Cell culture and ODN treatment of cells. b Cell–derived cell line MIN6 cells (19) were grown in DME supplemented with 15% heat-inactivated FBS, penicillin, and streptomycin. b Cell–derived cell line
bTC1 (20) and HIT-T15 cells (1777; American Type Culture Collec-tion, Rockville, MD) were grown in RPMI 1640 supplemented with 10% heat-inactivated FBS, penicillin, and streptomycin. For ODN treatment, MIN6 and bTC1 cells (z 80% confluent in 60-mm dishes)
were washed twice with 6 ml DME (for MIN6) or RPMI 1640 (for
bTC1) containing no serum. Appropriately diluted aliquots of ODN in 288 ml DME or RPMI 1640 (no serum) were preincubated at room temperature for 15 min with 288 ml DME or RPMI 1640 (no serum) containing 26 ml of LipofectAMINE® reagent (Life Technologies,
Inc., Gaithersburg, MD). This mixture was added to the cells together with an additional 2.3 ml of DME or RPMI 1640 (no serum). The fi-nal concentrations of ODN were as indicated. Cells were incubated for 5 h at 378C in the presence of 5% CO2. Next, the serum-free
me-dium containing LipofectAMINE was removed, and the incubation was continued with fresh (serum-containing) medium which also in-cluded appropriate concentrations of ODN. The medium was re-placed every 48 h with fresh medium of the same content.
Western blot analysis. Nuclear extracts were prepared following the procedure described by Sadowski and Gilman (23). 3 mg of nu-clear extract was separated by SDS-PAGE (10% resolving gel) using a Minigel® apparatus (Bio-Rad Laboratories, Hercules, CA), and
transferred to polyvinylidene fluoride membranes (Immobilon-P; Ni-hon Millipore, Tokyo, Japan) using transfer buffer containing 20% methanol, 25 mM Tris base, and 192 mM glycine and a Mini-trans-electrophoretic transfer cell (Bio-Rad Laboratories) (100 V, 1 h). Af-ter blocking the membranes for 1–2 h at room temperature in PBS containing 3% BSA, the membranes were incubated at room temper-ature for 60 min in TBS buffer (20 mM Tris-HCl, 150 mM NaCl, pH 7.5) containing 1:5,000 dilution of anti–PDX-1 (IPF1) antiserum (16) or anti-NeuroD polyclonal antibody, and washed three times (10 min each time) in TBS with 0.2% Tween-20 (TBS-T). The membranes were then incubated for 60 min at room temperature in TBS contain-ing 1:5,000 dilution of goat anti–rabbit IgG antibody (for PDX-1 de-tection) or porcine anti–goat IgG antibody (for NeuroD dede-tection) coupled to horseradish peroxidase, followed by two 30-min washings with TBS-T. Immunoreactive bands were visualized by incubation
with luminol (ECL® Western Blotting Kit; Amersham Japan) and
ex-posed to XAR-5 film (Eastman Kodak Co., Rochester, NY). Quanti-fication was achieved by densitometric scanning.
Gel mobility–shift analysis. 3 mg of nuclear extract was preincu-bated with 2 mg of poly(dI-dC) at 48C in a 20-ml reaction mixture con-taining 20 mM Hepes, pH 7.9, 75 mM KCl, 2.5 mM MgCl2, 1 mM
DTT, 1 mM EDTA, and 3% Ficoll-Hypaque (vol/vol%). 15 min later, the binding reaction was initiated by adding 100 pg (104 cpm) of
59-end 32P-labeled ODN probes and, when required, nonradioactive
competitor double-stranded ODNs, followed by incubation at room temperature for 30 min. In some of the binding assays, 2 ml of preim-mune serum or anti–PDX-1 antiserum was added to the binding reac-tions 30 min before addition of the DNA probes. The samples were fractionated on 5% PAGE precooled to 48C in 0.53 TBE (45 mM Tris base, 45 mM boric acid, 1 mM EDTA). Quantification was achieved by densitometric scanning after exposure to Kodak XAR-5 film.
[image:3.612.319.520.341.648.2]Northern blot analysis. Northern blots followed standard proce-dures using 25 mg of total RNA isolated from MIN6 cells or 10 mg of total RNA isolated from bTC1 or HIT-T15 cells. A mouse glucoki-nase cDNA (nucleotides 152–725) (24) and a mouse IAPP cDNA (nucleotides 24–245) (25) were prepared by reverse transcription– PCR using MIN6 total RNA as a template and subcloned individually into the pBluescript II plasmid. The mouse PDX-1 cDNA had been generated by us previously (18). The plasmid pMIn2C containing a mouse insulin II cDNA was a generous gift from Drs. J.M. Chirgwin
(University of Texas Health Science Center) and M.A. Permutt (Washington University School of Medicine).
Results
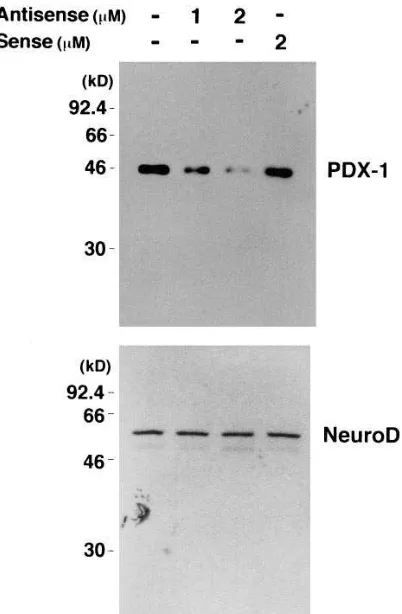
Suppression of PDX-1 expression by antisense ODN.Using the antisense ODN strategy, we suppressed the expression of PDX-1 in the pancreatic b cell–derived MIN6 cells (19). A set of antisense, sense, and reverse ODNs was designed to include the 18-nucleotide coding sequences starting with the first me-thionine codon of the PDX-1 mRNA. To investigate whether the antisense ODN can efficiently suppress the expression of PDX-1, Western blotting analyses were performed using nu-clear extracts which were isolated after incubation with the ODN for 48 h. As shown in Fig. 1, the antisense ODN could substantially suppress PDX-1 expression. The expression of another insulin gene transcription factor, NeuroD, examined as a control, was not affected (Fig. 1). We also examined the amount of PDX-1 mRNA by Northern blot analysis, but found no decrease by the antisense ODN (data not shown). This may indicate that the antisense ODN used in this study functioned via a hybrid-arrested translation rather than via RNase H–driven mRNA cleavage as suggested in the literature (21, 26).
Results of more detailed analyses of antisense PDX-1 ef-fects are shown in Figs. 2–4. In terms of the efef-fects of different concentrations of the antisense ODNs, representative results
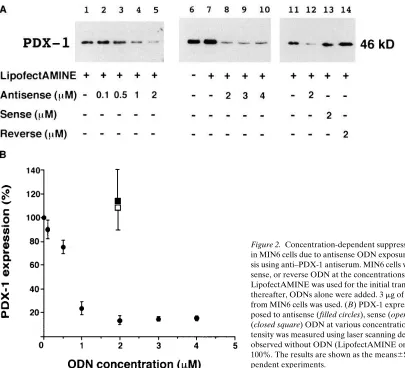
[image:4.612.58.463.55.423.2]are shown in Fig. 2 A, and average data are shown as a graph in Fig. 2 B. The substantial suppression of PDX-1 expression was observed in MIN6 cells when kept for 48 h in the presence of a supramicromolar concentration of antisense ODN [down to 1464% (mean6SE) under 2 mM antisense ODN]. No fur-ther decrease was observed even when concentrations . 2 mM were used (Fig. 2, A and B, lanes 8–10). In contrast to the sup-pressive effect of antisense ODN, no effect was observed after addition of 2 mM sense or reverse ODN (Fig. 2 A, lanes 11, 13,
Figure 2. Concentration-dependent suppression of PDX-1 expression in MIN6 cells due to antisense ODN exposure. (A) Western blot analy-sis using anti–PDX-1 antiserum. MIN6 cells were exposed to antisense, sense, or reverse ODN at the concentrations indicated below for 48 h. LipofectAMINE was used for the initial transfection of ODNs, and thereafter, ODNs alone were added. 3 mg of nuclear extracts prepared from MIN6 cells was used. (B) PDX-1 expression in MIN6 cells ex-posed to antisense (filled circles), sense (open square), and reverse (closed square) ODN at various concentrations for 48 h. The band in-tensity was measured using laser scanning densitometry. The amount observed without ODN (LipofectAMINE only) was set arbitrarily at 100%. The results are shown as the means6SE of at least three inde-pendent experiments.
[image:4.612.315.556.572.659.2]and 14, and B). Also, the gene transferring agent Lipo-fectAMINE itself did not affect the expression level of PDX-1 (Fig. 2 A, lanes 6 and 7).
The time course of the PDX-1 suppression after addition of antisense ODN to MIN6 cells was examined. As shown in Fig. 3, exposure of MIN6 cells to 2 mM antisense ODN caused a rapid decrease in PDX-1 expression within 24 h, and the sup-pressive effects continued until at least 144 h after the initial addition of antisense ODN. Considering the half-life of insulin mRNA, which is 6–12 h according to results obtained previ-ously with b cell–derived RIN-5F and bTC6 cells (27, 28), this time course of suppression by 2 mM antisense ODN was suit-able for evaluating the effects of PDX-1 diminution on insulin mRNA amounts. Thus, we used MIN6 cells that had been kept with antisense ODN for 96 h to evaluate the potential role of PDX-1 in determining the rate of insulin gene transcription.
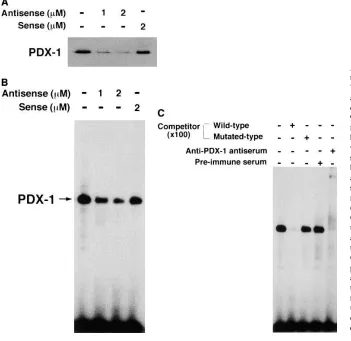
Suppression of PDX-1 binding to A element by antisense ODN. To examine whether the antisense ODN–dependent reduction of PDX-1 expression in MIN6 cells would lead to a decrease in its binding to the cis-acting motifs, we performed gel mobility–shift analyses using the human insulin gene A3 el-ement (hInsA3) as a probe. The results revealed that, in accor-dance with the reduction of the amount of PDX-1 protein ob-served by Western blot analysis (Fig. 4 A), the intensity of the band formed with the hInsA3 probe and a nuclear protein in MIN6 cells was reduced in a dose-dependent manner by addi-tion of antisense ODN (Fig. 4 B). The average band intensities in gel mobility–shift analyses for 1 and 2 mM antisense and 2
mM sense ODN lanes were 2865, 1865, and 8067%,
respec-tively, of that for the control lane. The gel–shift complex was shown to include PDX-1, because the addition of anti–PDX-1 (IPF1) antiserum to the binding reaction caused diminution in band intensity (Fig. 4 C). These results indicated that the re-duction in the protein amount of PDX-1 by antisense ODN caused a comparable reduction in its DNA-binding capacity.
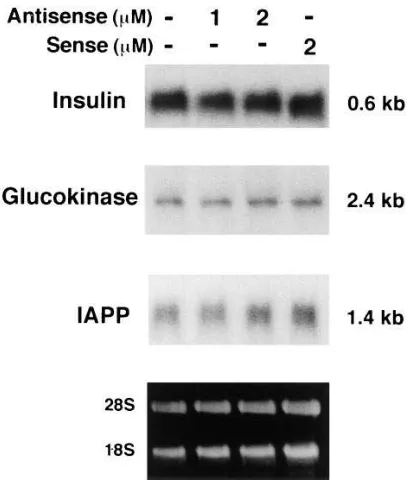
Effect of PDX-1 reduction on insulin, glucokinase, and IAPP mRNA amounts. We examined whether the decrease in PDX-1 protein and DNA-binding capacity would reduce the expression of insulin gene or other potential target genes. As shown in Fig. 5, the amount of insulin mRNA did not change in cells in which PDX-1 expression was suppressed. When the band intensity for the control lane was arbitrarily set at 100%, the average intensities for 1 and 2 mM antisense and 2 mM sense ODN lanes were 8269, 94613, and 113622%, respec-tively (n5 3; representative data shown in Fig. 5). Similarly, no changes were observed in the amount of glucokinase (10466, 114611, and 119616%, n5 3; Fig. 5) or IAPP mRNA (10167, 112610, and 121614%, n5 3; Fig. 5). Thus, these ob-servations suggest that suppression of PDX-1 expression does not affect the transcriptional rate of these genes.
Suppression of PDX-1 and expression of insulin gene in
[image:5.612.56.407.62.403.2]bTC1 cells. To investigate whether similar observations would be obtained with some other immortalized b cell–derived lines, we suppressed the PDX-1 expression in bTC1 cells and investigated the expression of insulin mRNA. With the same methods and ODNs used for MIN6 cells, the expression of PDX-1 was suppressed substantially in bTC1 cells (Fig. 6; down to 2464% with 2 mM antisense ODN, n5 3). Despite
this, no changes in the insulin mRNA amount were observed (control, arbitrarily set at 100%; 1 mM antisense, 10964%; 2
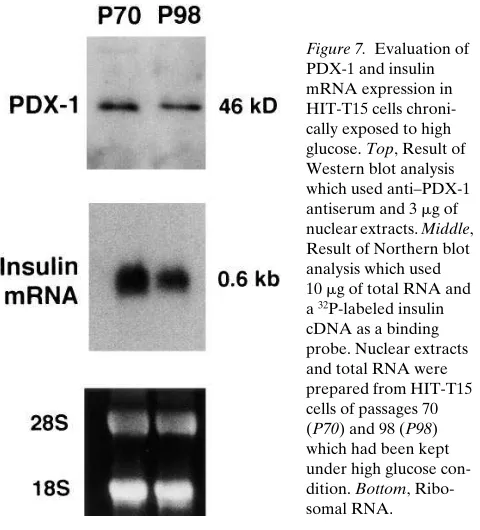
mM antisense, 121614%; 2 mM sense, 9667%; n5 3). Comparison of PDX-1 expression with that in HIT-T15 cells chronically exposed to high glucose conditions. Suppres-sion of PDX-1 expresSuppres-sion was coidentified with the suppres-sion of insulin gene expressuppres-sion in HIT cells which had been ex-posed to high glucose concentration for a very long period (7, 29), and therefore was suggested to be responsible for the de-crease in insulin gene expression. To allow comparison of our results with this observation in HIT-T15 cells, we examined whether the degree of decrease in PDX-1 in our study was comparable to that observed in the chronic high glucose– exposed HIT cells.
As shown in Fig. 7, the HIT-T15 cells of a late passage number (P98) showed substantial decrease in insulin mRNA content (down to 5065% of the control [P70]; n5 3). The PDX-1 amount in the cells may also have decreased slightly (down to 78612% of the control [P70]; n5 3); however, the degree of decrease in PDX-1 was definitely greater in our anti-sense ODN–treated MIN6 cells than in the HIT-T15 cells ex-periencing impaired insulin biosynthesis due to chronic high glucose condition. This disputes the idea that the suppression of PDX-1 is primarily responsible for the impaired insulin bio-synthesis in such HIT-T15 cells.
Discussion
Loss of PDX-1 results in loss of the pancreas, showing that PDX-1 has an important physiological role in the development
of this organ (14, 15). Recently, Serup et al. and we ourselves reported that PDX-1 can contribute to the expression of a sub-set of b cell–specific genes when exogenously expressed in cell lines derived from pancreatic a cells (18, 30). Thus, the pres-ence of PDX-1 is clearly important in directing the expression of b cell–specific genes. However, whereas multiple transcrip-tion factors are known to be involved in insulin or glucokinase gene expression, the physiological significance of PDX-1 as a determinant of the transcriptional rate of those genes has re-mained unknown.
In this study, we succeeded in substantially reducing PDX-1 expression in MIN6 cells using the antisense ODN strategy (Figs. 1–3 and 6). The reduction in protein amount also caused diminution of PDX-1 binding to the target DNA (Fig. 4). Nev-ertheless, we found no changes in the expression of insulin or other b cell–specific genes. Also, this seemed conserved in an-other b cell–derived cell line, bTC1. Although these findings dispute the physiological significance of PDX-1 in determining the rate of insulin gene transcription, they do not completely deny its involvement in driving insulin gene expression in b
cells. We assume it is possible that PDX-1 may be a sufficiently abundant protein in b cell–derived cells such that diminishing its expression levels by 80–90% does not impede its overall function as a transcription factor. In this case, as long as the minimally required amount of PDX-1 is expressed in the cells, no remarkable changes in gene expression would occur in the PDX-1–suppressed b cell–derived cells. Thus, we consider it safe to conclude that the moderate suppression of PDX-1
ex-Figure 5. Absence of reduction of insulin, glucokinase, or IAPP gene expression in PDX-1–suppressed MIN6 cells. Northern blot analyses were used to evaluate a subset of b cell–specific gene expression. The binding probe was 32P-labeled glucokinase, IAPP, or insulin cDNA.
[image:6.612.58.265.57.297.2]25 mg of total RNA was isolated from MIN6 cells which had been ex-posed for 96 h to LipofectAMINE alone (lane 1), 1 mM antisense (lane 2), 2 mM antisense (lane 3), and 2 mM sense ODN (lane 4). Bot-tom, Ribosomal RNA.
Figure 6. Absence of reduction of insulin gene expression in PDX-1– suppressed bTC1 cells. bTC1 cells were exposed to 1 or 2 mM anti-sense or 2 mM sense ODN for 96 h. LipofectAMINE was used for the initial transfection of ODNs, and thereafter, ODNs alone were added. Top, Result of Northern blot analysis which used anti–PDX-1 antiserum and 3 mg of nuclear extracts. Middle, Result of Northern blot analysis which used 10 mg of total RNA and a 32P-labeled insulin
[image:6.612.319.519.58.289.2]pression such as that achieved in this study is not likely to af-fect the gene expression pattern in the cells.
Our observation provides useful information for the under-standing of b cell glucose toxicity. To date, a decrease of PDX-1 protein or its binding to the target DNA has been coidentified with a decrease in insulin biosynthesis in HIT cells kept under chronic high glucose condition (7, 29) or with D-ribose, which induces a glycation reaction (8). Therefore, PDX-1 has been suggested to be responsible for the decrease in insulin gene transcription due to glucose toxicity. Although the cell lines used were not the same, the degree of reduction in PDX-1 ex-pression in our antisense ODN–treated cells was greater than that observed in the HIT-T15 cells of passage 98 (P98), which had reduced insulin gene expression caused by chronic high glucose condition (Figs. 1–3 and 7). We would like to note that Moran et al. seem to have found a similar phenomenon cently using HIT-T15 cells of the same age (31). Thus, our re-sults suggest that the reduction of PDX-1 is not a primary cause for the decrease in insulin gene transcription in HIT-T15 cells.
In contrast to these observations on PDX-1–suppressed
b cells, the suppression of another insulin gene transcription factor, E2A/Pan, in b cell–derived RIN cells caused dramatic attenuation of insulin gene transcription (21). E2A (E47/E12)/ Pan (Pan-1/Pan-2) are ubiquitously expressed basic helix-loop-helix proteins which constitute a heterodimer, called IEF1, with the recently described tissue-specifically expressed basic helix-loop-helix protein, BETA2/NeuroD (32, 33). The het-erodimer IEF1 binds to an important cis-motif of the insulin gene promoter E element (IEB/Nir, Far) (13), and activates transcription. Although both IEF1-binding E elements and PDX-1–binding A elements play a major role in the b cell–spe-cific expression of the insulin gene (34, 35), their physiological roles may differ in terms of their commitment to the rate of transcription. We assume that this difference may be related to the fact that PDX-1 is a homeodomain-containing protein.
Usually, the physiological function of a homeodomain-con-taining transcription factor is exerted by switching its expres-sion on and off; whether it is completely absent or present in a cell is important, for example, in the determination of cell fate (36, 37). Although speculative, this may also be the case with PDX-1; the existence of only a small amount of PDX-1 may be essential and adequate for acquiring the b cell trait in terms of the gene expression pattern. In this regard, the PDX-1 amount may be of little physiological significance as long as it is above a certain critical level.
If PDX-1 is not primarily responsible for the decrease in in-sulin gene transcription due to glucose toxicity, what is the re-sponsible factor? Although E2A/Pan suppression has been shown to cause a decrease in insulin gene transcription (21) as described above, the DNA binding activity to the E element (IEF1 activity) was not reduced in HIT or bTC6 cells that had been exposed to chronic high glucose concentrations (7, 28). Therefore, it still remains obscure whether the E2A/Pan-dependent suppression of insulin gene transcription can be in-volved pathophysiologically in the decreased insulin synthesis in some NIDDM cases. On the other hand, the DNA-binding activity of another insulin gene transcription factor, RIPE3b1, also seemed to be suppressed by chronic exposure of HIT (38) or bTC6 cells (28) to high glucose concentrations. In the case of bTC6 cells, the binding of PDX-1 was not decreased despite the reduction of insulin gene promoter activity (28), providing support for the pathophysiological significance of reduction of RIPE3b1 activity.
In this study, we used b cell–derived cell lines rather than primary pancreatic b cells. Although both of the two cell lines used (MIN6 and bTC1) gave similar results in terms of the ef-fects of PDX-1 suppression on insulin gene transcription, it is still possible that normal regulation of the insulin gene is al-tered in those cell lines. As support for this possibility, Melloul et al. showed previously that at least some portions of the insu-lin gene–regulating machinery may be altered in the b cell– derived cell lines (39). Therefore, similar experiments need to be performed with primary pancreatic islet cells in order to ob-tain conclusive evidence for the physiological role of PDX-1 in vivo.
In conclusion, our observations obtained from antisense ODN experiments indicate that a moderate decrease in PDX-1 causes no change in the expression of b cell–specific genes such as the insulin gene. Thus, the amount of PDX-1 per se does not seem to be relevant to the rate of insulin gene expres-sion at least as long as it is above a certain level, and it is unlikely to primarily explain the decrease in insulin gene tran-scription caused by chronic high glucose exposure. To under-stand the molecular basis of b cell glucose toxicity, research needs to be aimed at other components of the insulin gene– regulating machinery.
Acknowledgments
We thank Dr. John M. Chirgwin and Dr. M. Alan Permutt for kindly providing the mouse insulin II cDNA plasmid. We also thank Ms. Noriko Fujita for excellent technical assistance.
[image:7.612.58.298.58.323.2]H. Watada is a recipient of a fellowship and grant from the Japan Society for the Promotion of Science for Japanese Junior Scientists. This study was supported in part by a Grant-in-Aid for Scientific Re-search and grants from Japan Diabetes Foundation (to Y. Kajimoto) and Kyowa Hakko Kogyo Co. Ltd. (to Y. Kajimoto and Y. Yamasaki).
Figure 7. Evaluation of PDX-1 and insulin mRNA expression in HIT-T15 cells chroni-cally exposed to high glucose. Top, Result of Western blot analysis which used anti–PDX-1 antiserum and 3 mg of nuclear extracts. Middle, Result of Northern blot analysis which used 10 mg of total RNA and a 32P-labeled insulin
References
1. Porte, D., Jr. 1991. Banting lecture 1990: b-cells in type II diabetes melli-tus. Diabetes. 40:166–180.
2. Tokuyama, Y., J. Sturis, A.M. DePaoli, J. Takeda, M. Stroffel, J. Tang, X. Sun, K.S. Polonsky, and G.I. Bell. 1995. Evolution of b-cell dysfunction in the male Zucker diabetic fatty rat. Diabetes. 44:1447–1457.
3. Hummel, K.P., D.L. Coleman, and P.W. Lane. 1972. The influence of ge-netic background of expression of mutations at the diabetes locus in the mouse. I. C57BL/KsJ and C57BL/6J strains. Biochem. Genet. 7:1–13.
4. Eizirik, D.L., G.S. Korbutt, and C. Hellerstrom. 1992. Prolonged expo-sure of human pancreatic islets to high glucose concentration in vitro impairs the b-cell function. J. Clin. Invest. 90:1263–1268.
5. Zhang, H.J., T.F Walseth, and R.P. Robertson. 1989. Insulin secretion and cAMP metabolism in HIT cells. Reciprocal and serial passage-dependent relationships. Diabetes. 38:44–48.
6. Robertson, R.P., H.J. Zhang, K.L. Pyzdrowski, and T.F. Walseth. 1992. Preservation of insulin mRNA levels and insulin secretion in HIT cells by avoidance of chronic exposure to high glucose concentrations. J. Clin. Invest. 90:320–325.
7. Olson, L.K., J.B. Redmon, H.C. Towle, and R.P. Robertson. 1993. Chronic exposure of HIT cells to high glucose concentrations paradoxically de-creases insulin gene transcription and alters binding of insulin gene regulatory protein. J. Clin. Invest. 92:514–519.
8. Matsuoka, T., Y. Kajimoto, H. Watada, H. Kaneto, M. Kishimoto, Y. Umayahara, Y. Fujitani, T. Kamada, R. Kawamori, and Y. Yamasaki. 1997. Glycation-dependent, reactive oxygen species–mediated suppression of the in-sulin gene promoter activity in HIT cells. J. Clin. Invest. 99:144–150.
9. Ohlsson, H., K. Karlsson, and T. Edlund. 1993. IPF1, a homeodomain-containing transactivator of the insulin gene. EMBO (Eur. Mol. Biol. Organ.) J. 12:4251–4259.
10. Leonard, J., B. Peers, T. Johnson, K. Ferreri, S. Lee, and M.R. Mont-miny. 1993. Characterization of somatostatin transactivating factor-1, a novel homeobox factor that stimulates somatostatin expression in pancreatic islet cells. Mol. Endocrinol. 7:1275–1283.
11. Miller, C.P., R.E. McGehee, and J.F. Habener. 1994. IDX-1: a new ho-meodomain transcription factor expressed in rat pancreatic islets and duode-num that transactivates the somatostatin gene. EMBO (Eur. Mol. Biol. Organ.) J. 13:1145–1156.
12. Zangen, D.H., S.B. Weir, C.H. Lee, J.B. Latimer, C.P. Miller, J.F. Ha-bener, and G.C. Weir. 1997. Reduced insulin, GLUT2, and IDX-1 in b-cells af-ter partial pancreatectomy. Diabetes. 46:258–264.
13. German, M., S. Ashcroft, K. Docherty, H. Edlund, T. Edlund, S. Goodi-son, H. Imura, G. Kennedy, O. Madsen, D. Melloul, et al. 1995. The insulin gene promoter. A simplified nomenclature. Diabetes. 44:1002–1004.
14. Jonsson, J., L. Carlsson, T. Edlund, and H. Edlund. 1994. Insulin-pro-moter-factor 1 is required for pancreatic development in mice. Nature (Lond.). 371:606–609.
15. Guz, Y., M.R. Montminy, R. Stein, J. Leonard, L.W. Gamer, C.V. Wright, and G. Teitelman. 1995. Expression of murine STF-1, a putative insulin gene transcription factor, in b cells of pancreas, duodenal epithelium and pan-creatic exocrine and endocrine progenitors during ontogeny. Development (Camb.). 121:11–18.
16. Watada, H., Y. Kajimoto, Y. Umayahara, T. Matsuoka, H. Kaneto, Y. Fujitani, T. Kamada, R. Kawamori, and Y. Yamasaki. 1996. The human glu-cokinase gene beta-cell-type promoter: an essential role of insulin promoter factor 1 (IPF1)/PDX-1 in its activation in HIT-T15 cells. Diabetes. 45:1478– 1488.
17. Watada, H., Y. Kajimoto, H. Kaneto, T. Matsuoka, Y. Fujitani, J. Miyazaki, and Y. Yamasaki. 1996. Involvement of the homeodomain-contain-ing transcription factor PDX-1 in islet amyloid polypeptide gene transcription.
Biochem. Biophys. Res. Commun. 229:746–751.
18. Watada, H., Y. Kajimoto, J. Miyagawa, T. Hanafusa, K. Hamaguchi, T. Matsuoka, K. Yamamoto, Y. Matsuzawa, R. Kawamori, and Y. Yamasaki. 1996. PDX-1 induces insulin and glucokinase gene expressions in aTC1 clone 6 cells in the presence of betacellulin. Diabetes. 45:1826–1831.
19. Miyazaki, J., K. Araki, E. Yamato, H. Ikegami, T. Asano, Y. Shibasaki,
Y. Oka, and K. Yamamura. 1990. Establishment of a pancreatic beta cell line that retains glucose-inducible insulin secretion: special reference to expression of glucose transporter isoforms. Endocrinology. 127:126–132.
20. Hamaguchi, K., and E.H. Leiter. 1990. Comparison of cytokine effects on mouse pancreatic a-cell and b-cell lines. Viability, secretory function, and MHC antigen expression. Diabetes. 39:415–425.
21. Vierra, C.A., and C. Nelson. 1995. The pan basic helix-loop-helix pro-teins are required for insulin gene expression. Mol. Endocrinol. 9:64–71.
22. Sambrook, J., E.F. Fritsch, and T. Maniatis. 1989. Molecular Cloning: A Laboratory Manual. 2nd ed. Cold Spring Harbor Laboratory, Cold Spring Har-bor, NY.
23. Sadowski, H.B., and M.Z. Gilman. 1993. Cell-free activation of a DNA-binding protein by epidermal growth factor. Nature (Lond.). 362:79–83.
24. Andreone, T.L., R.L. Printz, S.J. Pilkis, M.A. Magnuson, and D.K. Granner. 1989. The amino acid sequence of rat liver glucokinase deduced from cloned cDNA. J. Biol. Chem. 264:363–369.
25. Nishi, M., S.J. Chan, S. Nagamatsu, G.I. Bell, and D.F. Steiner. 1989. Conservation of the sequence of islet amyloid polypeptide in five mammals is consistent with its putative role as an islet hormone. Proc. Natl. Acad. Sci. USA. 86:5738–5742.
26. Probst, J.C., and T. Skutella. 1996. Elevated messenger RNA levels af-ter antisense oligodeoxynucleotide treatment in vitro and in vivo. Biochem.
Biophys. Res. Commun. 225:861–868.
27. Welsh, M., A.N. David, A.J. MacKrell, and D.F. Steiner. 1985. Control of insulin gene expression in pancreatic b-cells and in an insulin-producing cell line, RIN-5F cells. J. Biol. Chem. 260:13590–13594.
28. Poitout, V., L.K. Olson, and R.P. Robertson. 1996. Chronic exposure of
bTC-6 cells to supraphysiologic concentrations of glucose decreases binding of the RIPE3b1 insulin gene transcription activator. J. Clin. Invest. 97:1041–1046.
29. Olson, L.K., A. Sharma, M. Peshavaria, C.V.E. Wright, H.C. Towle, R.P. Robertson, and R. Stein. 1995. Reduction of insulin gene transcription in HIT-T15 b-cells chronically exposed to a supraphysiologic glucose concentra-tion is associated with loss of STF-1 transcripconcentra-tion factor expression. Proc. Natl. Acad. Sci. USA. 92:9127–9131.
30. Serup, P., J. Jensen, F.G. Andersen, M.C. Jorgensen, N. Blume, J.J. Holst, and O.D. Madsen. 1996. Induction of insulin and islet amyloid polypep-tide production in pancreatic islet glucagonoma cells by insulin promoter factor 1. Proc. Natl. Acad. Sci. USA. 93:9015–9020.
31. Moran, A., H. Zhang, L.K. Olson, J.S. Harmon, V. Poitout, and R.P. Robertson. 1997. Differentiation of glucose toxicity from beta cell exhaustion during the evolution of defective insulin gene expression in the pancreatic islet cell line, HIT-T15. J. Clin. Invest. 99:534–539.
32. Naya, F.J., C.M. Stellrecht, and M.J. Tsai. 1995. Tissue-specific regula-tion of the insulin gene by a novel basic helix-loop-helix transcripregula-tion factor.
Genes Dev. 15:1009–1019.
33. Lee, J.E., S.M. Hollenberg, L. Snider, D.L. Turner, N. Lipnick, and H. Weintraub. 1995. Conservation of Xenopus ectoderm into neurons by NeuroD, a basic helix-loop-helix protein. Science (Wash. DC). 268:836–844.
34. Ohlsson, H., O. Karlsson, and T. Edlund. 1988. A beta-cell-specific pro-tein binds to the two major regulatory sequences of the insulin gene enhancer. Proc. Natl. Acad. Sci. USA. 85:4228–4231.
35. Boam, D.S., A.R. Clark, and K. Docherty. 1990. Positive and negative regulation of the human insulin gene by multiple transacting factors. J. Biol.
Chem. 265:8285–8296.
36. Morgan, B.A., and C. Tabin. 1993. The role of Hox genes in limb devel-opment. Prog. Clin. Biol. Res. 383A:1–9.
37. Davis, A.P., D.P. Witte, H.M. Hsieh-Li, S.S. Potter, and M.R. Capecchi. 1995. Absence of radius and ulna in mice lacking hoxa-11 and hoxd-11. Nature (Lond.). 375:791–795.
38. Sharma, A., L.K. Olson, R.P. Robertson, and R. Stein. 1995. The reduc-tion of the insulin gene transcripreduc-tion in HIT-T15 b cells chronically exposed to high glucose concentration is associated with the loss of RIPE3b1 and STF-1 transcription factor expression. Mol. Endocrinol. 9:1127–1134.