INTERNATIONAL JOURNAL OF PHARMACEUTICAL, CHEMICAL AND BIOLOGICAL SCIENCES
Available online at
www.ijpcbs.com
ESTIMATION OF SITAGLIPTIN IN K
2EDTA HUMAN
PLASMA USING UHPLC-MS/MS METHOD
K. Md Ismail
1, A. Lakshmana Rao
2*and MV. Basaveswara Rao
31
Faculty of Pharmaceutical Sciences, Krishna University,
Machilipatnam – 521 001, Andhra Pradesh, India.
2
Department of Pharmaceutical Analysis, V. V. Institute of
Pharmaceutical Sciences, Gudlavalleru – 521 356, Andhra Pradesh, India.
3
Department of Chemistry, Krishna University,
Machilipatnam – 521 001, Andhra Pradesh, India.
1. INTRODUCTION
Sitagliptin (STG) is an oral hypoglycemic agent of the dipeptidyl peptides-4 (DPP-4) enzyme inhibitor used in the treatment of type 2 diabetes mellitus. It is a potent agonist of PPAR-ᵞ and inhibits the inactivation of glucagon like peptide-1 (GLP-1) and glucose dependent insulinotropic polypeptide (GIP). It acts by stimulating the insulin release by the reduction
of glucagon level in pancreas1,2. Steady state
plasma concentration of Sitagliptin half-life is 10-12 hours at doses of 25mg-100mg. Sitagliptin has been shown to be effective well tolerated and safe in the treatment of type 2 diabetes mellitus in monotherapy or in combination with
metformin or thiozolidediones with minimal side effects. Minimum dose is 25mg and maximum recommended dose for sitagliptin is 100mg daily and it is most effective for
treatment3-5.
It has been found that very less literature was observed for estimation of STG as an individual
drug in human plasma by liquid
chromatography mass spectrometric method6.
Most of the analytical methods available for the estimation of sitagliptin in human plasma were
in combination with drugs like metformin7-11,
simvastatin12-13, pioglitazone14 and dasatinib15.
These are estimated by several techniques
including protein precipitation16, capillary zone
Research Article
ABSTRACT
Sitagliptin is an oral hypoglycemic agent of the dipeptidyl peptides-4 (DPP-4) enzyme inhibitor used in the treatment of type 2 diabetes mellitus. It acts by stimulating the insulin release by the reduction of glucagon level in pancreas. The main objective of the present study was to develop and validate a simple and rapid liquid chromatography-mass spectrometric method for estimation of Sitagliptin in human plasma using Sitagliptin D4 as
internal standard, K2EDTA as anticoagulant and a combination of ethyl acetate and
n-hexane as extraction solvent. Sitagliptin and Sitagliptin D4 were separated on Shimadzu UHPLC using Phenomenex, Gemini C18, 3µ, 100x4.6mm column and mobile phase
composed of acetonitrile and 5mM ammonium formate pH 3.5 in a ratio of 50:50% V/V.
UHPLC was operated at a flow rate of 0.8ml/min, run time of about 2.20mins, at column oven temperature of 35±1ºC and with isocratic flow mode. API-4000 (AB SCIEX) mass spectrometer was operated with positive polarity, turbo spray ionization and in multiple reaction monitoring (MRM) scan mode. The linearity was found to be in between 2.002ng/ml-797.473ng/ml and the retention times of Sitagliptin and Sitagliptin D4 was found to be at 1.07min and 1.06min respectively. The Q1/Q3 values for Sitagliptin and Sitagliptin D4 was found to be 408.000/174.000 and 412.000/174.000 respectively. Both Sitagliptin and Sitagliptin D4 are stable for about 53hrs 32mins in auto sampler. The developed method was found to be specific, accurate, precise, linear and stable with high recovery and less matrix effect as per standard guidelines.
electrophoresis17, in urine18-19, RP-HPLC20,
Spectrophotometry21. The present study has
been aimed to develop and validate a new method with less matrix effect, high recovery
and stable in K2EDTA human plasma. The
extraction method used was liquid-liquid extraction to extract STG and STG D4 from human plasma.
2. MATERIALS AND METHODS 2.1 CHEMICALS AND REAGENTS
Sitagliptin (Figure 1) and Sitagliptin D4 HCl (Figure 2) were purchased from Vivan Life Sciences Pvt Ltd, Mumbai, India. HPLC grade acetonitrile, ethyl acetate, n-hexane, methanol and water were obtained from E-Merck India. Ammonium formate was purchased from Finar Limited, India. Disodium hydrogen phosphate and formic acid were from E-Merck India. Human plasma was collected from National Institute of Nutrition, Hyderabad, Telangana, India.
2.2 Preparation of calibration curve (CC) Standards and Quality control (QC) samples
STG master stock solutions (1000µg/ml) and STG D4 master stock solutions (400µg/ml) were prepared discretely in methanol and stored at 2-8ºC. The STG D4 master stock solution was further diluted to achieve final concentration
2.000µg/ml using the diluent
(Acetonitrile:Water 50:50 V/V). From STG master stock solutions, CC standards and QC samples were prepared. CC standards are a set of eight non zero concentrations of STG master
stock solution spiked with blank K2EDTA human
plasma to acquire final eight concentrations in between 2.000ng/ml to 799.775ng/ml. Similarly QC samples were prepared by spiking STG
master stock solution with blank K2EDTA
human plasma to acquire final concentrations 634.873ng/ml, 317.436ng/ml, 5.460ng/ml and 2.000ng/ml and they were labeled as high quality control (HQC), medium quality control (MQC), low quality control (LQC) and lower limit of quantification quality control (LLOQ QC) (Figure 3) respectively. All the CC standards and QC samples were stored at 2-8ºC till use.
2.3 Sample preparation
The liquid-liquid extraction method was preferred to extract STG and STG D4 from CC standards and QC samples. The required numbers of samples were collected from deep freezer, thaw and maintained at room temperature. 0.2ml of the thaw samples were collected in pre-labeled polypropylene tubes and 50µl of STG D4 dilution (2µg/ml) was added except to blank. The solution was alkalinized by adding 0.2ml of 50 mM disodium hydrogen
phosphate and vortexed to mix the contents. 2ml of extraction solvent containing ethyl acetate and n-hexane (80:20%V/V) was added to all the tubes, vortexed for 15mins at 2000rpm. These vortexed samples were then
centrifuged at 3500rpm for 10mins.
Supernatants were collected in pre-labeled tubes and evaporated under nitrogen gas at 40ºC till dryness. The dried samples were reconstituted with 0.4ml solution containing acetonitrile and 5mM ammonium formate at pH 3.5 in the ratio of 50:50%V/V, vortexed and transferred in pre-labeled auto sampler vials.
2.4 Liquid chromatographic optimization
Sitagliptin and Sitagliptin D4 was separated on Shimadzu UHPLC on Phenomenex, Gemini C18, 3µ, 100x4.6mm column using a mobile phase composed of acetonitrile and 5mM ammonium
formate pH 3.5 in a ratio of 50:50%V/V. The
retention times of STG and STG D4 was found to be at 1.07min and 1.06min respectively when conditions are optimized to isocratic flow, 0.8ml/min flow rate and with a run time of about 2.20min. The auto sampler temperature and column oven temperature have been adjusted to 10.0ºC and 35.0ºC respectively throughout the process.
2.5 LC-MS/MS instrument and conditions
STG and STG D4 were detected on API-4000 (AB SCIEX) mass spectrometer at MRM scan mode, positive polarity and turbo spray ionization. The source parameters were optimized as curtain gas (CUR) at 30 psi, collision associated dissociation (CAD) at 6psi, nebulizer gas(GS1) at 40psi, turbo gas(GS2) at 45psi and ion spray voltage(IS) 5500V. The optimized compound parameters for both STG and STG D4 were declustering potential (DP) 70mV, entrance potential (EP) 10V, collision Energy (CE) 36V and collision cell exit potential (CXP) 18V. The source temperature was maintained at 500ºC and the dwell time was at 200msec. Chromatographic data analysis and mass spectrum interpretation was performed using analyst software 1.6.2 version. The m/z values of STG and STG D4 were found to be at
408.000/174.000 (Q1/Q3) and
412.000/174.000 (Q1/Q3) respectively.
2.6 Method validation22
solution to the end of validation process. The results of validation parameters, stabilities in aqueous solutions and stabilities in biological matrix are compared with the acceptance criteria as per the standard validation guidelines (USFDA guidelines).
2.7 System suitability
System suitability was performed with six replicate injections of AQ STD equivalent to MQC concentration levels of STG and STG D4. The mean retention time of STG, mean retention time of STG D4 and mean area ratio (STG/STG D4) were compared with the acceptance criteria as per standard guidelines.
2.8 Selectivity and specificity
Selectivity was performed to estimate the interferences from blank plasma lots, lipidemic lots and from hemolyzed lots of STG and STG D4
at LLOQ. Ten blank K2EDTA plasma batches
were (out of which 2 lipidemic lots and 2 hemolyzed lots) were selected to test for their endogenous interferences.
Specificity was estimated by replicate injections of standard blank, concomitant blank and standard zero were set and compared the percentage of interference with mean response of LLOQ sample.
2.9 Linearity- goodness of fit
Eight calibration curve standards in K2EDTA
human plasma were prepared in between
concentrations from 2.002ng/ml to
797.473ng/ml with STG. All the CC standards were back calculated from their respective responses. An eight point calibration curve was constructed between peak area ratios of STG and STG D4 on Y-axis and plasma concentration on X-axis. A linear equation was established
using 1/conc2 weighing factor to provide the
best fit for concentration versus detector response. The goodness of fit was greater than 0.99 during the course of validation.
2.10 Precision and accuracy
Accuracy of the method was measured by percentage difference of back calculated mean concentrations of quality control samples to
their respective nominal concentrations.
Accuracy of the method was assessed with minimum of six repeated injections of all quality control samples range (HQC, MQC, LQC and LLOQ QC). Precision for the method was performed to calculate percentage of coefficient of variation (%CV) of all the quality control samples for their intra-day and inter-day responses. The intra-day and inter-day precision was performed with six repeated injections of quality control samples.
2.11 Sensitivity
The lower limit of quantification of STG was found to be 2.002ng/ml. The sensitivity of the method was estimated by six replicate injections of LLOQ concentration level. Finally the sensitivity was represented in terms of signal to noise ratio (SNR) of LLOQ concentration level which must be ≥5 as per standard guidelines.
2.12 Matrix Factor
Aqueous samples of STG and STG D4, post extracted samples of STG and STG D4 at high quality control (HQC) and low quality control (LQC) levels were evaluated for matrix effect. Peak areas obtained from aqueous samples of STG and STG D4 at HQC and LQC levels were compared with peak areas of post extracted samples at HQC and LQC levels of STG and STG D4.
Matrix factor and ISTD normalized matrix factor was calculated by,
2.13 Recovery
The mean areas of extracted HQC, MQC and LQC samples of STG were compare with mean areas of post extracted quality control (HQC, MQC and LQC) samples of STG. The mean areas of middle quality control samples of STG D4 were compared against mean areas of post extracted middle quality control samples of STG D4. The percentage of mean recovery of STG or STG D4, percentage recovery with factor was calculated by,
2.14 Stability of Sitagliptin in Aqueous solutions
assessing at ULOQ levels stored at 2-8ºC for 6days 1hr for both STG and STG D4, long term working solution stability was evaluated at ULOQ and LLOQ levels of STG stored at 2-8ºC for 5days 23hrs and for STG D4 stored at 2-8ºC for 5days 23hrs.
2.15 Stability of Sitagliptin in Biological matrix
Bench top stability was performed at HQC and LQC levels stored at ambient temperature (25±5ºC) for 7hrs 8mins after reconstitution.
Freeze stability was determined after
completing 5 freeze thaw cycles at -70±5ºC and at -20±5ºC separately accessing at HQC and LQC levels. Wet extract stability was checked by assessing at HQC and LQC levels stored at ambient temperature for 7hrs00 mins. Auto sampler stability was performed with high and low quality control samples by storing the wet extracts for about 53hrs 32mins in auto sampler. About 47hrs 20mins at 2-8ºC of storage in refrigerator, the quality control (HQC and LQC) samples were evaluated for dry extract stability. Calibration curve stability was evaluated by accessing upper limit (ULOQ) and lower limits (LLOQ) of linearity calibration curve standard levels after 4days 20hrs of storage after reconstitution.
All the stabilities of sitagliptin in aqueous and in biological matrix were estimated by minimum of 6 replicate injections at different concentration levels of quality control samples at different temperatures as per requirement.
3. RESULTS AND DISCUSSION 3.1 Method validation
The method was validated for entire linearity
concentration range of 2.002ng/ml to
797.437ng/ml. The sequential validation
parameters including system suitability,
selectivity, specificity, matrix effect, linearity,
precision, accuracy, sensitivity, recovery and
stability were evaluated under validation segment as per USFDA guidelines.
3.2 System suitability
System suitability was evaluated with six repeated injections of AQ STD equivalent to MQC concentration. The %CV for STG retention time and STG D4 retention time were 0.8% and 1.0% respectively where as the %CV for area ratio (STG and STG D4) was 1.4% as per acceptance criteria.
3.3 Selectivity and specificity
Ten plasma lots including 2 lipidemic and 2 hemolyzed lots were spiked with STG and STG D4 at LLOQ sample, analyzed for selectivity of the method. These plasma lots did not show any considerable interference at the retention times of STG and STG D4 at LLOQ level. The percentage of interference at the RT of STG and metabolites were less than 20% at LLOQ level; the percentage of interference at RT of STG D4 was less than 5% at LLOQ level.
Specificity was estimated by two standard blank injections, two concomitant blank injections and two standard zero injections spiked with STG and STG D4 at LLOQ concentration level. No interference peaks were observed with standard blank, concomitant blank and standard zero samples at the retention times of STG and STG D4 at LLOQ quality control level.
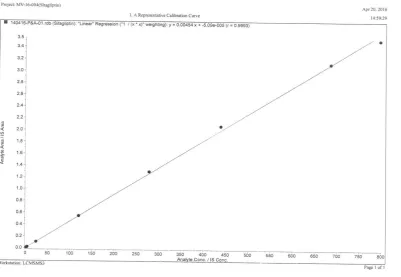
3.4 Linearity- goodness of fit
A linear calibration curve was developed by plotting STG concentration on X-axis and peak area ratio of STG/STG D4 on Y-axis. The curve was linear over 2.002ng/ml to 797.473ng/ml of STG. A linear regression equation was established to provide best fit for the concentration versus detector response using 1/x*x as weighing factor. The method has LLOQ 2.002ng/ml for STG. Correlation coefficient(r) for the calibration curve was 0.99 throughout the validation process. All the back calculated concentrations were within ±15% (except for LLOQ ±20%) of their respective nominal concentrations (Figure 3).
3.5 Precision and accuracy
The intra-day and inter-day accuracy and precision was determined by six replicates injections of overall concentration range of quality control (HQC, MQC, LQC and LLOQ QC) samples. The intra-day and inter-day accuracies for HQC, MQC, LQC and LLOQ QC samples were ranged from 96.4% to 102.2% to the nominal concentrations. The intra-day and inter-day precision (%CV) for HQC, MQC, LQC and LLOQ QC (Figure 4) samples were ranged from 1.6% to 3.9% (Table 1).
3.6 Sensitivity
3.7 Matrix effect
At high quality control (HQC) and low quality control (LQC) levels of 6 lots of aqueous samples of STG and STG D4 and 10 lots (including 2 lipidemic and 2 hemolyzed lots) of post extracted plasma samples of STG and STG D4 at HQC and LQC concentration levels were evaluated for matrix effect. No matrix effect was found with STG with all the six plasma lots. The percentage of coefficient of variation (%CV) for ISTD normalized matrix factor for both HQC and LQC levels were 1.4% and 2.1% respectively (Table 2).
3.8 Recovery
The mean areas of six replicate injections of extracted quality control samples (HQC, MQC and LQC levels) of STG were compared with six replicate injections of post extracted quality control samples (HQC, MQC and LQC levels) of STG. Similarly the mean areas of six replicate injections of extracted MQC level of STG D4 was compared with six replicate injections of post extracted MQC level of STG D4. The % mean recovery for STG at HQC, MQC and LQC levels were 65.9, 66.2 and 66.2 respectively. The % mean recovery for STG D4 at MQC level was found to be 73.35 (Table 3).
3.9 Stability
Sitagliptin was found to be stable at ambient temperature (25±5ºC) in blood plasma till 3hrs 34mins, on bench top till 7hrs 8 mins and in wet extract till 7hrs 00mins. In biological matrix STG at HQC and LQC levels was stable after 5 freeze thaw cycles at -70±15ºC and -20±5ºC. The final % found concentrations were 101.6% and 95.1% at 70±15ºC and 101.2% and 98.1% at -20±5ºC. No evidence of degradation of STG was found in auto sampler at 10±1 ºC till 53hrs 32mins and in dry extracts at 2-8ºC till 47hrs
20mins. The STG stock solution at ULOQ concentration level was found to be stable at 25±5ºC for 7hr 00min and at 2-8ºC for 6days 1hr, the final % found concentrations were 94.9% and 98.6% respectively. Calibration curve was found to be stable for 4days 20 hrs at ULOQ and LLOQ levels and the found % concentrations were 99.3% and 100%. The stabilities of STG and STG D4 in aqueous solutions and in
biological matrixes at their respective
conditions were ranged from 93.6% to 104.4% which were within acceptable limits (Table 4 & Table 5).
4. CONCLUSION
The developed method was a simple, rapid, specific, selective, accurate and reproducible, with less matrix effect and with high recovery for STG. Moreover the developed method is highly sensitive and for analysis each sample needs less than 2.20mins. The method was found to be linear between 2.002ng/ml to 797.473ng/ml by using back calculated
concentrations and 1/conc2 as weighing factor.
Both sitagliptin and sitagliptin D4 HCl are stable for about 53hrs 32mins in auto sampler at 10±1ºC. No evidence of degradation of master stock solution was observed storage till 6days 1hr at 2-8ºC. Working solution was also stable up to 5days 23hrs at 2-8ºC. Both sitagliptin and sitagliptin D4 HCl are stable till 47hrs 20 mins in dry extract at 2-8ºC. Thus, the results of the study suggest that the method developed and validated can be used for analysis of single dose or multiple dose pharmacokinetics with desired accuracy, precision and high throughput.
5. ACKNOWLEDGEMENT
The authors are thankful to Jeevan Scientifics Pvt Ltd, Hyderabad, for their unstinged technical support.
Table 1: Precision and accuracy
QC Conc.
Level Parameter Intra-day Inter-day
HQC(n=6)
Nominal Concentration (ng/ml) Mean Estimated Concentration (ng/ml)
% Accuracy %CV
643.416 645.5192
100.3% 1.6%
643.416 657.7502
102.2% 1.2%
MQC(n=6)
Nominal Concentration (ng/ml) Mean Estimated Concentration ( ng/ml)
% Accuracy %CV
321.708 328.5477
102.1% 1.7%
321.708 327.9198
101.9% 3.2%
LQC(n=6)
Nominal Concentration (ng/ml) Mean Estimated Concentration (ng/ml)
% Accuracy %CV
5.469 5.2695 96.4% 2.7%
5.469 5.4043 98.8% 3.9%
LLOQ QC(n=6)
Nominal Concentration (ng/ml) Mean Estimated Concentration (ng/ml)
% Accuracy %CV
2.004 1.9650 98.1% 3.7%
2.004 2.0422 101.9% 2.5%
Table 2: Matrix factor
Biological. lot No
Matrix Factor (MF)
ISTD Normalized MF Analyte ISTD
HQC LQC HQC LQC HQC LQC
1 2 3 4 5 6 L-1 L-2 H-1 H-2 Mean SD %CV 0.96 0.98 0.97 0.98 0.98 0.99 0.96 0.94 1.01 0.94 0.971 NA NA 0.99 1.00 0.98 0.97 0.97 0.92 0.91 0.91 0.50 0.92 0.907 NA NA 0.97 0.96 0.97 0.98 0.97 1.00 0.96 0.95 0.99 0.97 0.973 NA NA 0.99 0.97 0.94 0.96 0.95 0.91 0.94 0.90 0.48 0.90 0.895 NA NA 0.99 1.01 1.00 1.00 1.01 1.00 0.99 0.99 1.02 0.97 0.998 0.0138 1.4% 1.00 1.02 1.04 1.00 1.02 1.02 0.98 1.02 1.03 0.98 1.010 0.0211 2.1%
1 to 6: blank plasma lots; ISTD: Internal standard; MF: Matrix factor; L-1 &L-2: Lipidemic lots; H-1 & H-2: Hemolyzed lots
Table 3: Recovery
Qc Conc. Level Sample Mean area % Mean Recovery
HQC (n=6) Post extracted Extracted 1322151.7 2006898.0 82.4%
MQC(n=6) Post extracted Extracted 1048849.8 694188.8 82.7%
LQC (n=6) Post extracted Extracted 10523.8 15889.8 82.8%
ISTD (n=6) Post extracted Extracted 465969.8 635238.5 91.7% Extraction solvent added to sample= 2ml;
Superntant transferred for evaporation= 1.6ml
Table 4: Stability of Sitagliptin in aqueous solutions (n=6)
Stability Check Conditions Comparison Stock %CV stock %CV Stability % Stability Short term stock solution 25±5ºC 2.1 1.1 94.9 %
Long term stock solution 2-8ºC 1.1 1.2 98.6 %
Short term working solution 25±5ºC 25±5ºC 1.0 0.7 0.7 3.1 98.1% 97.5%
Long term working solution 2-8ºC2-8ºC 1.3 5.7 2.9 1.8 104.4% 97.9%
HQC: High quality control; MQC: Medium Quality control; LQC: Low Quality control ; ULOQ: Upper limit of Quantification; LLOQ : Lower limit of Quantification
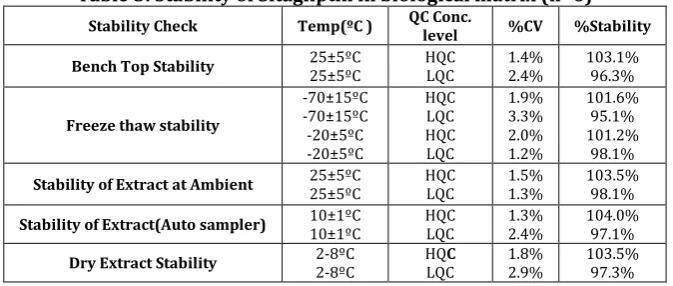
Table 5: Stability of Sitagliptin in biological matrix (n=6)
Stability Check Temp(ºC ) QC Conc. level %CV %Stability
Bench Top Stability 25±5ºC 25±5ºC HQC LQC 1.4% 2.4% 103.1%96.3%
Freeze thaw stability
-70±15ºC -70±15ºC -20±5ºC -20±5ºC HQC LQC HQC LQC 1.9% 3.3% 2.0% 1.2% 101.6% 95.1% 101.2% 98.1%
Stability of Extract at Ambient 25±5ºC 25±5ºC HQC LQC 1.5% 1.3% 103.5% 98.1%
Stability of Extract(Auto sampler) 10±1ºC 10±1ºC HQC LQC 1.3% 2.4% 104.0% 97.1%
Fig. 1: Structure of Sitagliptin
Fig. 2: Structure of Sitagliptin D4 HCl
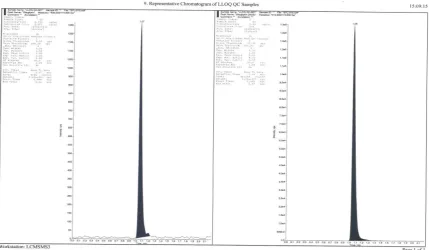
Fig. 4: Representative chromatograms of Sitagliptin and Sitagliptin D4
6. REFERENCES
1. Hermansen M, Kipnes M, Luo E,
Fanurik D, Khatami H and Stein P. Efficacy and safety of the dipeptidyl peptidase-4 inhibitor, sitagliptin, in patients with type 2 diabetes mellitus
inadequately controlled on
glimepiride alone or on glimepiride and metformin. Diabetes Obes Metab. 2007;9(5):733-45.
2. Disease management a guide to
clinical pharmacology, edited by Michael D Randall and Karen E Neil,
London, Pharmaceutical Press.
2009;2:431-432.
3. Basic and Clinical Pharmacology,
edited by Bertram G. Katzung, New York NY, McGraw-Hill. 2018;14:880-883.
4. Stockley's Drug Interactions edited by
Karen Baxter and CL Preston,
London, Pharmaceutical press.
2008;8:513.
5. The Complete Drug Reference edited
by Sean C Sweetman, Paul B. Martindale, London, Pharmaceutical press. 2009;36:431-432 and 460.
6. Zhao Q, Wang BY, Jiang J and Hu P.
Quantification of sitagliptin in human plasma and urine by LC-MS/MS method and its application. Acta Pharm Sin. 2015;50(6):714-718.
7. Bonde SL, Bhadane RP, Avinash G,
Deepak K, Sumit G and Narendiran AS. Simple and sensitive method for determination of metformin and sitagliptin in human plasma using liquid chromatography and tandem mass spectrometry. Int J Pharm Pharm Sci. 2013;5(3):463-470.
8. Mohammed AlB, Hassan AA, Sadique
AJ, Lalitha KG, Asmari M, Jessica W and El DS. Development and validation of LC-MS/MS method for
simultaneous determination of
metformin and four gliptins in human
plasma. Chromatographia.
2017;80(6):891-899.
9. Srinivasa R, Imran A, Iqbal A,
Arindam M and Saral T. Development and validation of a method for
simultaneous estimation of
metformin and sitagliptin in human plasma by LC–MS-MS and its application in a bioequivalence study. J Chrom Sci. 2015;53(9):1549-1556.
10. Priyanka Shah A, Jaivik Shah V,
11. John GS, Richard TG, Mark D and
Raimund MP. Simultaneous
quantitation of metformin and sitagliptin from mouse and human dried blood spots using laser diode thermal desorption tandem mass spectrometry. J Pharm Biomed Anal. 2011;55(3):544-551.
12. Laxminarayana B, Ramesh M,
Nageshwara Rao P, Ajitha M, Durga Srinivas L and Rajnarayana K.
Simultaneous determination of
sitagliptin and simvastatin in human plasma by LC-MS/MS and its
application to a human
pharmacokinetic study. Biomed
Chrom. 2013;27(1):80-87.
13. Ramesh B, Manjula N, Bijargi SR,
Sarma VUM and Sitadevi P.
Comparison of conventional and supported liquid extraction methods for the determination of sitagliptin and simvastatin in rat plasma by LC-ESI-MS/MS. J Pharm. 2015;5(3):161-168.
14. Gananadhamu S, Laxmikanth V,
Shantikumar S, Sridhar V, Geetha C and Sandhya CH. Rapid LC-ESI-MS-MS
method for the simultaneous
determination of sitagliptin and pioglitazone in rat plasma and its application to pharmacokinetic study. Am J Anal Chem. 2012;3:849-858.
15. Prinesh Patel N, Ganadhamu S,
Sridhar V, Rambabu A, Kiran K, Varanasi VS and Swaroop Kumar. Validated LC-MS/MS method for
simultaneous determination of
dasatinib and sitagliptin in rat plasma
and its application to
pharmacokinetic study. Anal Meth. 2014;6(2): 433-439.
16. Zeng W, Xu Y, Marvin C and Woolf EJ.
Determination of sitagliptin in human plasma using protein precipitation
and tandem mass spectrometry. J Chrom B. 2010;878(21):1817-1823.
17. Salim M, El-Enany N, Belal F, Walash
M and Patonay G. Simultaneous determination of sitagliptin and
metformin in pharmaceutical
preparations by capillary zone electrophoresis and its application to human plasma analysis. Anal Chem Insigh. 2012;7:31-46.
18. Ucakturk E. Development of a gas
chromatography-mass spectrometry method for the analysis of sitagliptin in human urine. J Pharm Biomed Anal. 2013;74(23):71-76.
19. Nageshwara Rao R, Pawan Maurya K
and Khalid S. Development of a molecularly imprinted polymer for selective extraction followed by
liquid chromatographic
determination of sitagliptin in rat
plasma and urine. Talanta.
2011;85(2):950-957.
20. Anil D, Rizwan Basha K, Jayasankar K,
Venkat M and Samanta MK. Bioanalytical method development
and validation of sitagliptin
phosphate by RP-HPLC and its application to pharmacokinetic study.
Int J Pharm Pharm Sci.
2012;4(2):691-694.
21. Jeyabalan G and Narendra N.
Analytical method development and validation of sitagliptine phosphate monohydrate in pure and tablet
dosage form by derivative
spectroscopy. J App Pharm Sci. 2013;3(1):95-98.
22. Guidance for industry. Bioanalytical