Original Research Article
Exploring the determinants of catastrophic health expenditure and
socioeconomic horizontal equity in relation to it: a rural community
based longitudinal study in West Bengal
Abhishek Paul
1*, Suresh Chandra Malick
2, Shatanik Mondal
3, Saibendu Kumar Lahiri
4INTRODUCTION
Health and health care, a fundamental human right, is integral to people‟s capability to function and flourish as human beings, and establishing equity in health care has long been considered an important goal.1 Starting from the goal of „Health for All by 2000 AD‟ set in 30th
World Health Assembly in May 1977 through Millennium Development Goals (MDGs) set in Millennium Summit in September 2000 to today‟s Sustainable Development
Goals (SDGs) to be achieved by 2030 and the discussions on Universal Health Coverage (UHC) – equity has always remained the central theme and dogma.2-5 Equity in health care is defined as equal access to available care for equal need; equal utilization for equal need and equal quality of care for all.6,7 There are two forms of health equity; (a) “Horizontal” equity which refers to equal treatment for equal needs, and (b) “Vertical equity” which refers to unequal treatment for unequal needs.8 It must be recognized that human beings vary in health as ABSTRACT
Background: Equity in health care is defined as equal access to available care for equal need. Out-of-pocket expenditures are the most inequitable means of health care financing. These payments become catastrophic health expenditure (CHE) if it exceeds the household‟s „Capacity to Pay‟. As fairness is one of the fundamental objectives of the health system, identification of the factors responsible for these expenditures is important. Hence this study was conducted to find out the determinants of CHE and to explore the socioeconomic horizontal equity in relation to it.
Methods: Total 352 households from 9 villages of Amdanga block, North 24 Parganas, were studied for 12 months. Annual out-of-pocket healthcare expenditure exceeding 40% of annual household non-food expenditure was classified as CHE and determinants of the same were identified using logit-model. Equity was measured by Concentration index and modified Kakwani measure (MDK).
Results: Overall prevalence of CHE was 20.7% and highest (39.3%) in the second income quintile. The odds of incurring CHE were highest (35.43) for the households with member/s requiring inpatient treatment followed by households having more than five members (12.81). Negative value of concentration index and MDK indicated that the probability of incurring CHE was disproportionately concentrated among the poor and the financing system was degressive, however some amount of equity was noted in the poorest quintile.
Conclusions: Apart from the poorest section in the community the poorer and middle income sections are still exposed to healthcare expenditure shocks and the health care spending was diverse and less equitable.
Keywords: Catastrophic health expenditure, Concentration index,Equity
Department of Community Medicine, 1Burdwan Medical College, Burdwan, 2Calcutta National Medical College, Kolkata, 3Malda Medical College, Malda, 4R.G. Kar Medical College, Kolkata, West Bengal, India
Received: 29 March 2018
Accepted: 04 May 2018
*Correspondence:
Dr. Abhishek Paul,
E-mail: [email protected]
Copyright: © the author(s), publisher and licensee Medip Academy. This is an open-access article distributed under the terms of the Creative Commons Attribution Non-Commercial License, which permits unrestricted non-commercial use, distribution, and reproduction in any medium, provided the original work is properly cited.
they do in every other attribute; hence not all the differences and inequalities in health care are biased.6,8 The term inequity has a moral and ethical dimension and solely refers to the differences which are not only unnecessary and avoidable but also unfair and unjust.6 But the pluralistic sources of funding health systems as well as its consequences are highly debated policy issues.9 These funding sources can be broadly grouped into three categories i.e. public sources, private sources and external financing/flows.10-14 The most concerned part of private health expenditure is the direct payment by households while accessing health which is also known as Out-of-Pocket (OOP) expenditure.11-13,15 The health system financing of almost all low- and middle-income countries including India rely heavily on these payments.16-19 As per national health accounts (2004-05) in India in 2004-05, 71.13% of total health expenditure came from OOP payments and the recent data by World Bank suggests that it remains among the highest in the world (In 2014-OOP payments had accounted for 89.20% of private health expenditure).12,20,21 As far as the scenario of West Bengal is concerned, a study done by Mondal et al in three districts i.e. Malda, North 24 Parganas and Bankura, reported that 23.4% of households of hospitalized people made catastrophic expenditure (expenditure more than the capacity to pay) and demonstrated wide chances of tripping into poverty, and rural people were more vulnerable to such payment.22 These payments are the most inequitable means of health care financing as these are regressive and can make health systems less efficient.14,16,23,24 Requirement of high OOP payments are particularly hard on the poor, whose illness will either remain untreated or partially treated or may force them into deeper levels of poverty and as a result they may remain trapped in the vicious cycle of illness and poverty.17,25 These inequities are likely to adversely affect not only income distribution but also access to health services, which in long run can lead to greater inequality in health status.9 Therefore policymakers consider that health care payments should be set according to household‟s ability-to-pay.9,26,27
The Rashtriya Swasthya Bima Yojana (RSBY) was launched by ministry of labour and employment, government of India on April 2008 with the objective to provide protection to BPL (below poverty level) households from financial liabilities arising out of health shocks that involve hospitalization. But it has its own shortcoming like the criteria of enrolling maximum five members of a family, coverage of only in-patient care etc.28-31 Moreover study on the magnitude and factors responsible for expenditures made for accessing health care and the socioeconomic inequity in relation to it is important as fairness is one of the fundamental objectives of the health system.9,26,27
Hence with the above background a longitudinal study was conducted in a rural setting of West Bengal with the
objectives to find out the determinants of catastrophic health expenditure and to explore the socioeconomic horizontal equity in relation to these expenditures.
METHODS
Study type and design
The study was of observational descriptive type with longitudinal design.
Study settings and period
The study was conducted in selected villages of Amdanga Community Development (C.D.) Block of North 24 Parganas district, West Bengal for a period of 12 months from August 2015 to July 2016.
Study population
All households of Amdanga CD Block.
Sample size and sampling procedure
As even after extensive and thorough search of articles, research papers, studies etc., an appropriate estimate could not be found to support the estimation of sample size, a pilot study was undertaken in May 2015 in ten percent households of one randomly selected village (Kundapara; 10% of total 432 households i.e. 44) out of the total 81 villages of Amdanga CD Block. The head of the household or available adult respondent were enquired or relevant document checked to find out the magnitude of out-of-pocket health care expenditure in last 6 months. It was estimated that 13 out of 44 i.e. 29.5% households had over shot the catastrophic threshold i.e. more than 40% of the household‟s Capacity To Pay (CTP). Taking 29.5% as prevalence, with 95% confidence interval, 5% allowable error and 10% attrition rate in longitudinal design, the sample size came out to be 352(rounded off) households. It was pre-decided that the study would cover 10% of all the villages (81) of Amadanga C.D. Block; hence 9 (rounded off) villages were selected by simple random sampling technique out of total 81villages. The number households from the selected villages were included in the sample using probability proportion to size (PPS) technique (Table 1).
The estimated numbers of households from each village were selected by simple random sampling.
Study variables
population groups. It includes non-reimbursable cost sharing, deductibles, co-payments, fee-for service transport costs for accessing healthcare, over-the-counter medicines and supplies, but does not include pre-paid fees for health-related taxes or insurance, payments made by enterprises which deliver medical and paramedical benefits, mandated by law or not, to their employees.14,15,32,33 If total annual out-of-pocket expenditure for healthcare exceeds 40% of annual household non-food expenditure then it classified as catastrophic health expenditure (CHE).14,15,22,32,33
Table 1: Number of households selected from each village by probability proportion to size.
Village Total number of
households
Number of households selected
Adhata 1139 67
Sikira 981 57
Kharu 363 21
Rafipur 665 39
Uludanga 547 32
Kamdevpur 720 42
Kumerduni 483 28
Baikunthapur 516 30
Bijoypur 617 36
Total 6031 352
This indicator is calculated as: (Household out-of-pocket expenditure for health during the past 12 months / Total household non-food expenditure in past 12 months) x 100
Household non-food expenditure is used as a proxy measure for a household's capacity to pay (CTP).14,15,22,32,33 The explanatory variables used were household‟s socio-economic and socio-demographic characteristics, household having any form of health insurance, an elderly member (age >65 years), an under-five child, a member with chronic illness, a female member delivering a baby or having an abortion or miscarriage and at least one member who was hospitalized anytime during the reference period.
Study tool and method of data collection
Data were collected by house-to-house visit with the help of a pre-designed pre-tested schedule. During first visit, after explaining the purpose, process and nature of the study, informed consent was taken and interview was carried out with the head of the household or any available responsible adult member. The respondents were enquired about necessary details and the magnitude of out-of-pocket health care expenditure in last three months. Available relevant documents were also checked with permission whenever required. Each household was visited for total four times with an interval of three months in a period of one year for collecting relevant data.
Statistical analysis
Multinomial logistic regression was carried out to estimate the probability and identify the determinants of CHE using the logit equation, i.e.
Where, y is the presence of CHE. X1, X2,…Xn are explanatory variables, β1, β2,… βn are the coefficients of the explanatory variables and β0 is the intercept.
Socioeconomic inequity in relation to CHE was assessed by the following measures:
(i) Concentration index and concentration curve: The concentration index, which is one of the most widely accepted method of defining health inequalities, was employed to measure the extent of socioeconomic inequality in CHE.1,34-37 It is defined as twice the area between the concentration curve and the line of equality (the 450 line running from the bottom-left corner to the top-right).1,34-37 Its value ranges from -1 to +1. Its positive value here indicates that the variable is more disproportionately concentrated among the advantaged, and vice versa. The larger the absolute value of concentration index, the greater is the inequality and a zero value implies a state of horizontal equity in respect to CHE. The formula for computing the concentration index is: C= (p1L2
- p2L1) + (p2L3 - p3L2) + … + (pT-1LT - pTLT-1),
where C stands for concentration index, p is the cumulative percent of the sample ranked by income status, L(p) is the corresponding concentration curve ordinate, and T is the number of socioeconomic groups.1,34-36
(ii) Modified Kakwani measure (MDK): It is the ratio of the concentration index to the Gini coefficient (Gini coefficient measures the income related inequality.37,38 It is defined as twice the area between the Lorenz curve and the line of equality. Its value ranges from 0 i.e. complete equality, to 1 i.e. complete inequality).37,38
The interpretation of MDK is as below:
MDK < 0 Degressive
MDK = 0 Constant payment
0 < MDK < 1 Accessible
MDK = 1 Proportional payment
MDK > 1 Less accessible
RESULTS
All the 352households were followed up for 12 months with no attrition from the initial sample. The prevalence of CHE was found to be 20.7% as out-of-pocket health care payments of 73 households in one year was estimated to over-shoot the 40% cut-off mark. Mean (SD) age of the head of the household at the beginning of the survey was 41.67(14.72) years. Other socio-demographic and socio-economic characteristics of the households along with prevalence of incurring CHE were given below (Table 2).
Table 2: Socio-demographic and socio-economic characteristics of the households (n=352).
Variables No (%) CHE
No (%) @
Sex of the head of the household
Male 343 (97.4) 68 (19.8)
Female 9 (2.6) 5 (55.6)
Religion
Hindu 128 (36.4) 7 (5.5)
Muslim 224 (63.6) 66 (29.5)
Caste
General 243 (69.1) 57 (23.5)
Schedule caste 41 (11.6) 5 (12.2) Other backward classes 68 (19.3) 11 (16.17)
Educational status of head of the household
Primary and below 245 (69.6) 58 (23.7) Above primary 107 (30.4) 15 (14.0) Type of family
Nuclear 110 (31.2) 31 (28.2)
Joint 242 (68.8) 42 (17.4)
Economic status (per-capita monthly income quintile)
Quintile 1 (poorest) 75 (21.3) 16 (21.3) Quintile 2 (poorer) 61 (17.3) 24 (39.3) Quintile 3 (middle) 77 (21.9) 14 (18.2) Quintile 4 (richer) 72 (20.5) 12 (16.6) Quintile 5 (richest) 67 (19.0) 7 (10.4)
Any health insurance
Present* 108 (30.7) 26 (24.1)
Absent 244 (69.3) 47 (19.3)
Total 352 (100.0) 73 (20.7)
*all the present health insurance were under Rashtriya Swasthya Bima Yojana (RSBY); @row percentage.
The quintile wise percentage expenditure was given in Figure 1.
Figure 1 shows that none of the households from poorest quintile had OOP expenses below 10% of their CTP, while more than 2/3rd of these households had OOP expenses in range of 10-20% of CTP. The CHE proportion was highest (39.3%) in the second quintile with gradual decrease from there to upper quintiles.
Figure 1: Per-capita monthly income quintile wise and overall annual out-of-pocket health care expenditure
of the households in proportion to their annual non-food expenditure (n=352).
Figure 2: Concentration curves of incurring catastrophic health care expenditure.
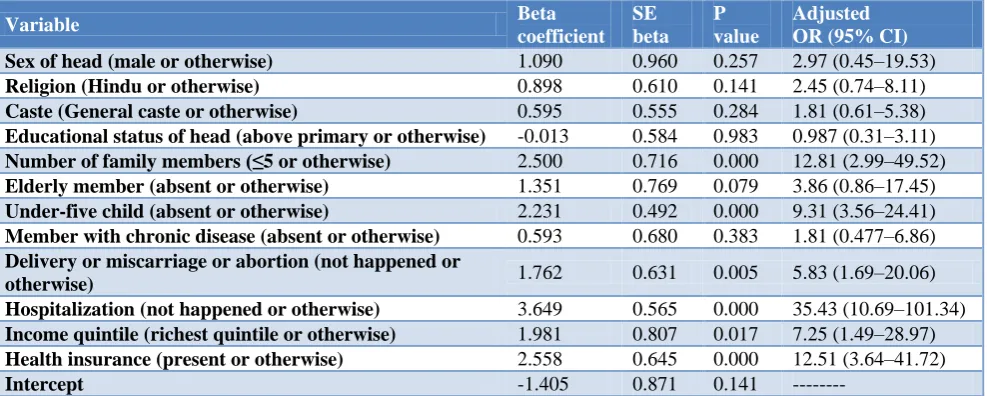
The association between households incurring CHE in a year was found to be statistically significant (p<0.05) with households having; (i) more than five members, (ii) at least one under-five child, (iii) an event of a delivery or miscarriage or abortion in that year, (iv) at least one instance of hospitalization in that year, (v) households belonging to lower income quintiles in respect to the richest quintile, and (vi) households not having any form of health insurance (Table 3). The estimated odds ratios (95% CIs) of different explanatory variables were given in Table 3.
The socioeconomic inequality in incurring CHE is evident from the concentration curve shown in Figure 2.
The concentration curves lies mostly above the line of equality except in the initial part and the concentration index value estimated was -0.0756. Negative value indicated that households with low economic status had a higher probability of incurring CHE than the rich.
8.2 16.9 30.6
4.5 12.2
68 23
44.1 40.3
46.3 45.2
10.7
26.2 20.8
9.7
23.9 17.9
3.3
2.8 14.9 4 21.3
39.3
18.2 16.6 10.4 20.7
0% 20% 40% 60% 80% 100%
Quintile 1
Quintile 2
Quintile 3
Quintile 4
Quintile 5
Overall > 40%
30 - 40%
20 - 30%
10 - 20%
< 10 %
0 20 40 60 80 100
0 20 40 60 80 100
Cum
m
ula
tive
pro
po
rtion
o
f
CH
E
by
pcm
i
quintiles
Cummulative percentage of households by pcmi quintiles
As the Gini coefficient value estimated was 0.48, hence the value of modified Kakwani measure (MDK) came out to be -0.1575 which indicates a degressive health care
financing system i.e. relatively poor people pay more relative to their income than do relatively rich people.
Table 3: Multinomial logistic regression model results using annual catastrophic health care expenditure as dependent variable and different characteristics of the households as explanatory variables (n=352).
Variable Beta
coefficient SE beta
P value
Adjusted OR (95% CI)
Sex of head (male or otherwise) 1.090 0.960 0.257 2.97 (0.45–19.53)
Religion (Hindu or otherwise) 0.898 0.610 0.141 2.45 (0.74–8.11)
Caste (General caste or otherwise) 0.595 0.555 0.284 1.81 (0.61–5.38)
Educational status of head (above primary or otherwise) -0.013 0.584 0.983 0.987 (0.31–3.11)
Number of family members (≤5 or otherwise) 2.500 0.716 0.000 12.81 (2.99–49.52)
Elderly member (absent or otherwise) 1.351 0.769 0.079 3.86 (0.86–17.45)
Under-five child (absent or otherwise) 2.231 0.492 0.000 9.31 (3.56–24.41)
Member with chronic disease (absent or otherwise) 0.593 0.680 0.383 1.81 (0.477–6.86)
Delivery or miscarriage or abortion (not happened or
otherwise) 1.762 0.631 0.005 5.83 (1.69–20.06)
Hospitalization (not happened or otherwise) 3.649 0.565 0.000 35.43 (10.69–101.34)
Income quintile (richest quintile or otherwise) 1.981 0.807 0.017 7.25 (1.49–28.97)
Health insurance (present or otherwise) 2.558 0.645 0.000 12.51 (3.64–41.72)
Intercept -1.405 0.871 0.141 ---
-2 Log LR = 148.921 Pseudo R- Square (Cox and Snell) = 0.435; LR Chi-Square, df, p* value = 200.877, 12, 0.000 SE – Standard Error; OR – Odds Ratio; CI – Confidence Interval; LR- Likelihood Ratio.
DISCUSSION
In the present study the prevalence of CHE was found to be 20.7% and income quintile wise it was highest (39.3%) in second quintile; even more than the prevalence (21.3%) found in poorest quintile. The possible explanation could be that, 77.3% households of poorest quintile were covered under RSBY in comparison to 49.2% households of the second quintile. Study done by Mondal et al reported that 25.3% of the rural household had to incur CHE.22 Estimates of present study showed that odds of incurring CHE was highest for household with member/s requiring inpatient treatment (35.43) followed by households having more than five members (12.81). Study done by Piroozi et al in West Iran and Xu et al in rural areas of Shaanxi Province of China reported that households receiving inpatient services had the odds of facing CHE, 129.7 and 3.69 times more than other households.36,39 Pal analyzed the data of 61st round of National Sample Survey and showed that socially deprived classes, household size, number of children and elderly persons in house increased the probability of catastrophic spending while education level of primary and above had significant negative impact on this probability, in rural sectors.40 The present study did not found any significant difference in probability of CHE with these factors, however, presence of an under-five member and one/more events of delivery/ miscarriage/abortion were found to have significantly increased the probability of incurring CHE. The negative value of concentration index and MDK indicated that probability of incurring CHE was disproportionately concentrated among the poor and the financing system was degressive. However the absolute values were small
i.e. close to zero and the concentration curve for the poorest quintile was almost directed along the line of equality indicating a state of near perfect horizontal equity in CHE. It might be due to the fact that majority of households belonging to poorest quintile had some form of health insurance (RSBY) as estimates showed that households not having any health insurance had 12.51 times higher odds of having CHE.
CONCLUSION
Inpatient treatment, household size, having an under five or an event of delivery and not having any health insurance were the most significant determinants of CHE. RSBY like scheme had provided some form of immunity for the poorest households and helped in establishing equity in health spending. However, as the poorer and middle income sections of the community are still exposed to financial health shocks, the health care spending in the rural area studied was diverse, less equitable and degressive.
ACKNOWLEDGEMENTS
The authors want to acknowledge the cooperation to the members of the participant households and local villagers for their help and support.
Funding: No funding sources Conflict of interest: None declared
REFERENCES
1. Owen O‟Donnell O, Doorslaer EV, Wagstaff A, Lindelow M. Analyzing Health Equity Using Household Survey Data - A Guide to Techniques and Their Implementation. Washington, DC: The World Bank; 2008: 220.
2. Park K. Park‟s textbook of preventive and social medicine. 22nd ed. Jabalpur: M/s Banarashidas Bhanot; 2013.
3. United Nations. The Sustainable Development Goals Report 2016. New York: United Nations; 2015: 29. Available at: https://www.google.co.in/ search?q=sustainable+development+goals&oq=su& aqs=chrome.0.69i59j69i61j69i59j69i57j0l2.1567j0j 7&sourceid=chrome&ie=UTF-8#q=sustainable+ development+goals+pdf. Accessed on 21 August 2016.
4. World Health Organization. Universal health coverage: supporting country needs. Geneva: World Health Organization; 2013. Available at: http://www.who.int/contracting/UHC_Country_Sup port.pdf. Accessed on 24 August 2014.
5. High Level Expert Group. High Level Expert Group Report on Universal Health Coverage for India. New Delhi: Planning Commission, Government of India; 2011: 326. Available at: http://planning commission.nic.in/reports/genrep/rep_uhc0812.pdf. Accessed on 26 August 2016.
6. Whitehead M. The concepts and principles of equity and health. Copenhagen: WHO Regional Office for Europe; 1985. Available at: http://publicaciones.ops. org.ar/publicaciones/piezas%20comunicacionales/c ursoDDS/cursoeng/Textos%20Completos/the%20co ncepts%20and%20principles%20of%20equity%20a nd%20health.pdf. Accessed on 26 November 2016. 7. Leenan H. Equality and equity in health care. Paper
presented at the WHO/Nuffield Centre for Health Service Studies meeting; Leeds: 1985.
8. Bhalwar RV. The Text Book of Public Health and Community Medicine.1st ed. Pune: Department of Community Medicine, AFMC, Pune in Collaboration with WHO, India Office, New Delhi; 2009.
9. Cavagnero E, Bilger M. Equity during an economic crisis: financing of the Argentine health system. Geneva: World Health Organization; 2009: 25. Available at: http://www.who.int/health_financing/ documents/dp_e_09_03-equity_crisis_arg.pdf. Accessed on 11 September 2016.
10. Andargie G. Introduction to Health Economics. Ethiopia Public Health Training Initiative. University of Gondar; 2008 Sep. Available at: https://www.cartercenter.org/resources/pdfs/health/e phti/library/lecture_notes/health_science_students/ln _intro_to_health_economics_final.pdf. Accessed on 30 August 2016.
11. Xu K, Saksena P, Holly A. The Determinants of Health Expenditure: A Country-Level Panel Data
Analysis. A Working Paper of the Results for Development Institute. 2011.
12. National Health Accounts Cell. National Health Accounts India 2004–05. New Delhi: Ministry of Health and Family Welfare, Government of India; 2009: 73. Available at: http://planningcommission. nic.in/reports/genrep/health/National_Health_Accou nt_04_05.pdf. Accessed on 21 January 2016. 13. National Health Accounts Cell. Health Sector
Financing By Centre and States/UTs in India (Revised) 2009-10 to 2012-13. New Delhi: Ministry of Health and Family Welfare, Government of India; 2014: 53. Available at: http://www.mohfw. nic.in/WriteReadData/l892s/883514734NHA.pdf. Accessed on 26 August 2016.
14. Culyer AJ, Newhouse JP. Handbook of Health Economics; Volume 1A. Amsterdam: Elsevier Science BV; 2000.
15. The World Bank. World Development Report; 2011.Washington, DC: The World Bank; 2011. 384 p Available at: http://siteresources.worldbank.org/ INTWDRS/Resources/WDR2011_Full_Text.pdf. Accessed on 26 August 2014.
16. World Health Organization. Health Systems Financing: Toolkit on monitoring health systems strengthening. Geneva: WHO Press; 2008 Jun. 8 p. Available at: http://www.who.int/healthinfo/ statistics/toolkit_hss/EN_PDF_Toolkit_HSS_Financ ing.pdf. Accessed on 26 July 2016.
17. Lorenz C. Out-of-pocket household health expenditures and their use in National Health Accounts: Evidence from Pakistan. Asia Health Policy Program, Working paper series on health and demographic change in the Asia-Pacific#9.Walter H. Shorenstein Asia-Pacific Research Center. Available at: http://iis-db.stanford.edu/pubs/22555/ lAHPPwp9.pdf. Accessed on 15 July 2014.
18. The World Bank. Health policy research in South Asia: Building capacity for reform. Human development network, health, nutrition and population series. Washington, DC: The World Bank; 2003: 232. Available at http://documents. worldbank.org/curated/en/840211468779068549/pd f/279270PAPER0Health0economics.pdf Accessed on 16 March 2016
19. O‟Donnell O, Doorslaer EV, Eliya RPR, Somanathan A, Adhikari SR, Akkazieva B, et al. Who pays for health care in Asia? J Health Econ 2008;27(2):460-75.
20. The World Bank. Out-of-pocket health expenditure (% of private expenditure on health). World Bank Data Catalogue. Available at: http://data.worldbank. org/indicator/SH.XPD.OOPC.ZS?end=2014&start= 2004. Accessed on 10 July 2016.
21. World Health Organization. Global Health Expenditure Database; 2014. [updated 2016 Sep 5] Available at: http://apps.who.int/nha/database. Accessed on 10 July 2016.
and its impact on households: Experience from West Bengal, India. 2010 Jun. Available at: http://www.chronicpoverty.org/uploads/publication_ files/mondal_et_al_health.pdf. Accessed on 10 March 2016
23. OECD Health Data 2001. A Comparative Analysis of 30 Countries; data sources, definitions and methods. Paris: OECD; 2001.
24. Doorslaer EV, O‟Donnell O, Eliya RPR. Effect of payments for health care on poverty estimates in 11 countries in Asia: an analysis of household survey data. Lancet. 2006;368(9544):1357-64.
25. Sen G. Universal Health Coveragein India - A Long and Winding Road. Econ Polit Weekly. 2012;47(8):45-52.
26. Wagstaff A, Doorslaer EV. Chapter 34. Equity in health care finance and delivery. In: Culyer AJ, Newhouse JP, Eds. Handbook of Health Economics. Elsevier; 2000: 1803-1862.
27. Xu K, Klavus J, Kawabata K, Evans D, Hanvoravongchai P, Ortiz J. Household health systems contributions and capacity to pay: definitional, empirical, and technical challenges. In: Murray C, E. D. (Ed.), Health systems performance assessment debates, methods and empiricism: World Health Organization; 2003. 533-542.
28. Government of India. Rashtriya Swasthya Bima Yojana; Guidelines. Ministry of Labour and Employment, Government of India: New Delhi; 2008. Available at: http://www.rsby.gov.in/docs/ RSBY.Guidelines13.3.08_rev.pdf. Accessed on 30 July 2016.
29. Devadasan N, Swarup A. Rashtriya Swasthya Bima Yojana: an overview. IRDA J. 2008;6:33–6. 30. Basu R. Rashtriya Swasthya Bima Yojana:
Pioneering Public-Private Partnership in Health Insurance. Jamia Millia Islamia; New Delhi. Available at: http://www.napsipag.org/PDF/ RUMKI%20BASU.pdf. Accessed on Accessed on 10 September 2016.
31. Das J, Leino J. Evaluating the RSBY: lessons from an experimental information campaign. Econ Polit Weekly. 2011;46(32):85–93.
32. Definition of Out-of-Pocket Expenditure. Available at: http://www.indexmundi.com/facts/indicators/
SH.XPD.OOPC.TO.ZSOop. Accessed on 09 August 2014.
33. Measure Evaluation. The ratio of household out-of-pocket payments for healthcare to household income. Available at: http://www.cpc.unc.edu/ measure/prh/rh_indicators/crosscutting/hss/the-ratio-of-household-out-of-pocket-payments-for. Accessed on 09 August 2014.
34. Xu K, Evans DB, Kawabata K, Zeramdini R, Klavus J and Murry CJL. Household catastrophic health expenditure: a multicountry analysis. Lancet. 2003;362:111-7.
35. Kakwani N, Wagstaff A, Van Doorslaer E. Socioeconomic inequalities in health: measurement, computation, and statistical inference. J Econometrics. 1997;77:87–104.
36. Xu Y, Gao J, Zhou Z, Xue Q, Yang J, Luo H, et al. Measurement and explanation of socioeconomic inequality in catastrophic health care expenditure: evidence from the rural areas of Shaanxi Province. BMC Health Services Res. 2015;15:256.
37. Fukushige M, Ishikawa N, Maekawa S. A modified Kakwani measure for health inequality. Health Economics Rev. 2012;2:10.
38. Toyoda T. Tax progressivity and coefficient for income redistribution. Economic Res. 1987;38(2):166–70.
39. Piroozi B, Moradi G, Nouri B, Bolbanabad AM, and Safari H. Catastrophic Health Expenditure After the Implementation of Health Sector Evolution Plan: A Case Study in the West of Iran. Int J Health Policy Manag. 2016;5(7):417–23.
40. Pal R. Analysing Catastrophic OOP Health Expenditure in India: Concepts, Determinants and Policy Implications. WP-2010-001. Indira Gandhi Institute of Development Research, Mumbai; 2010. Available at: http://www.igidr.ac.in/pdf/publication/ WP-2010-001.pdf. Accessed on 24 July 2016.