Content Based Image Retrieval using the
Generalized Gamma Density to model BEMD‟s
IMFs.
A
ziza
Benkuider
LESSI, Faculty of sciences Dhar el mahraz P.Box 1796 Department of physic, Fez, Morocco.
Email: [email protected]
A
bdellah
Aarab
LESSI, Faculty of sciences Dhar el mahraz P.Box 1796 Department of physic, Fez, Morocco.
Email: [email protected]
Abstract—In this paper, we present a texture-image
retrieval approach, which is based on the idea of to characterize images without extracting local features, by using global information extracted from the image Bidimensinal Empirical Mode Decomposition (BEMD) together with the Generalized Gamma (GG) Density. The BEMD method decompose image into a set of functions named Intrinsic Mode Function (IMF) and residue. The Generalized Gamma (GG) Density is used to represent the coefficients derived from each IMF and the Kullback-Leibler Distance (KLD) compute the similarity between Gamma Generalized function’s coefficients. The experimental results indicate that our approach can achieve higher retrieval rates.
Index Terms—Content Based Image Retrieval (CBIR),
Empirical Mode Decomposition (EMD), Bidimensional Empirical Mode Decomposition (BEMD), Fast and Adaptive Bidimensional Empirical Mode Decomposition (FABEMD), Intrinsic Modes Functions (IMF), Generalized Gamma (GG), Kullback-Leibler (KL).
I. INTRODUCTION
Nowadays, we see the advancement in image acquisition technologies and storage systems which always encourages us to design a sophisticated system to retrieve the images effectively. Fast access to such huge database requires efficient indexing algorithms. CBIR system is one of possible solutions to effectively manage image databases [1,2]. The purpose is to retrieve desired images from database using only the numerical content of images. Typical CBIR systems is decomposed in two steps: the first is feature extraction (FE), where a set of features, called image signatures, is generated to accurately represent the content of each image in the database and stored in a feature database. The second is
similarity measurement (SM), where a distance between the query image and each image in the database using their signatures is computed. For definition and extraction of visual features, many classical approaches in the field of texture-image retrieval leave the spatial domain including image characterization using a transform domain such as wavelet transform and Gabor filter [3,4].
Recently, a novel multiresolution decomposition method, The Empirical Mode Decomposition (EMD) originally proposed by Huang [5] for one dimensional signal and extended specifically to image processing two years after (BEMD) [6]. The BEMD is a very powerful tool in image retrieval [7,8]. It is based on the characterization of the image through its decomposition in IMFs where the image can be decomposed into a redundant set of signals and a residue, adding all the IMF‟s together with the residue reconstructs the original image without information loss or distortion.
Some researchers used BEMD for image processing. Nunes and al. [6] applied BEMD to texture extraction and image filtering. Linderhed used BEMD for image compression [9]. Liu and al. presented the definition and framework of Directional Empirical Mode Decomposition (DEMD) and applied DEMD to texture segmentation [10]. The BEMD process cause massive computation time and complexity. In this context, Sharif. M and all. suggested a new simple, efficient and fast method of envelope estimation that replaces the surface interpolation (Fast and Adaptive BEMD: FABEMD) [11].
algorithm, based on Roland Kwitt work, using FABEMD decomposition instead of wavelet transform. In order to evaluate the proposed FABEMD using the Generalized Gamma (FABEMD-GG), we presented a comparison study with the Gabor Wavelet transform (GWT), the classical pyramidal Discrete Wavelet Transform (DWT) or the Dual-Tree Complex Wavelet Transform (DT-CWT). The results showed that FABEMD-GG texture can achieve encouraging retrieval precision and recall.
The remainder of this paper is structured as follows: In the first section, we introduce the BEMD with FABEMD. In the next section, we introduce the Generalized Gamma density functions (GG) model of the IMFs. Section 3 then briefly review the connection between the KLD and the principle of maximum-likelihood selection. In section 4, we present the approach and provide closed-form solutions for the corresponding KLD. Section 5 and 6 presents a comparison of the experimental retrieval results. Finally, concludes the paper with a brief summary and an outlook on further research.
II. THE BIDIMENSIONAL EMPIRICAL
DECOMPOSITION.
The EMD method is an adaptive decomposition and suitable for analysis of non-linear and non-stationary processes. This decomposition technique extracts a finite number of oscillatory components or (well-behaved) AM-FM functions, called IMF, directly from the data. IMFs are monocomponent functions that have well defined instantaneous frequencies. EMD does not use any pre-determined filter or basis functions; which is quite different from Gabor analysis [13] and Wavelet analysis [14]. This technique extended to analyse two-dimensional data is known as Bitwo-dimensional EMD (BEMD), the process being called 2D sifting process. The procedure of decomposition is iterative. The 2D sifting process is performed in two steps: extrema detection by neighboring windows or morphological operators and surface interpolation by radial basis functions [15] or multigrid B-spline. Its principle is to decompose adaptively an image into its IMFs. This technique has been applied successfully on real data in areas such that the Oceanography and the Climatically phenomenon study [16, 17], the Seismology [18], the Control No-Destructive [19, 20], the Acoustic submarine [21, 22], or Biology [23, 24].
A. The BEMD steps 1. Algorithm
Given an image I, the sifting process of BEMD can be defined as follows [6]:
Step 1) Fixed.
,
i
1
Step 2)
r
i1
I
(residue) Step 3) Extract the ithIMF:
a)
h
i,j1
r
i1,
j
1
(j, iteration of the loop of sifting).b) Extract local maxima and minima of
h
i,j1.c) Compute upper envelope and lower envelope functions
U
i,j1 andL
i,j1by interpolating, respectively, local minima and local maximaof
h
i,j1.d) Compute local mean surface:
e) Update:
h
i,j
h
i,j1
m
i,
j
j
1
.
2 L U
mi,j1 i,j1 i,j1
f) Calculate stopping criterion: (Standard Deviation):
g) Repeat steps (b)-(f) until
SD
(
j
)
, let.). IMF i ( h IMFi i,j eme
Step 4) Update residue: riri1IMFi
Step 5) Repeat steps (3) with ii1 until the number of extrema in
r
i is less than 2 i.e., the residue does not contain any extrema points.The Standard Deviation (SD) is the criteria to stop sifting process, computed from two consecutive sifting (1).
T
1 i
2 1 j , i
2 1 j , i j , i
h h h ) j (
SD (1)
T: the number of iterations.
When the decomposition is complete, the original image may be reconstruct by adding all the IMFs and the last residue (2)
k 1
i i te
reconstrui C
I (2)
where,
C
i is thei
th IMF or residue and k is the number of IMFs.Extraction of each IMF requires several iterations
Because the surface interpolation method itself fits a surface in an iterative optimization approach, it makes the
BEMD process complex and excessively time consuming, so to overcome this problem we can
accelerate the process and minimize the computational
time by the use of the New Bidimensional Empirical Mode Decomposition (NBEMD) [25], the Olympics
Bidimensional Empirical Mode Decomposition (OBEMD) [26], the Lapped Block Bidimensional
Empirical Mode Decomposition (LBBEMD) [27] and
FABEMD [11].
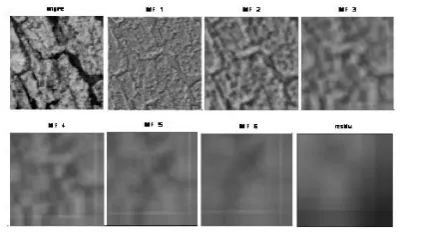
Figure 1. Example of decomposition an image of the vistex base by FABEMD.
The first step of the sifting process in the BEMD is to locate the local extrema points (maxima and minima) of the image intensity. The simple way is to use the pixel neighbouring information in the image; so a point is maxima (respectively minima) if its value is strictly higher (respectively strictly lower) than all its 8-connected closer neighbours.
3. Surface interpolation
The interpolation is regarded as a delicate stage in the sifting process and has a remarkable influence on the results of the decomposition. A natural extension for the interpolation method used in the EMD for one dimensional is the cubic spline interpolation for the bidimensional signals. Unfortunately, this method decomposes the two dimensional down to residue with a many number of extrema points and it creates distortions near the end points. All this is because the data we have to interpolate is often described as scattered. Radial Basis Functions provide well-established tools for solving interpolation problems of the above form in any space dimension. An RBF is a function of the form:
( )
( )
(
)
,
1
N
d
s x
p
m
x
i
x
x
i
x
R
i
R
i
(3)where s is the RBF, m
p
is a low-degree polynomial, typically linear or quadratic, a member of the mth degreepolynomials in d variables, denotes the Euclidean
norm, The
i ‟s are the RBF coefficients,
is thebasis function and i
x
are the RBF centers. For this interpolation method we should fix in advance the basis function and since there are many functions that can be used as a basis function we can consider the Thin-Plate [28] as an extension of the cubic spline function as in the case of one dimension:)
log(
)
(
r
r
2r
(4)For the BEMD interpolation, the RBF offers several advantages over piecewise polynomial interpolates because the geometry of the known points is not restricted and the resulting system of linear equations is guaranteed to be invertible under very mild conditions.
4. Stopping criteria for the sifting process
The sifting process in the BEMD decomposition consist on decomposing an input signal into set of functions defined by the signal itself, these functions are called IMFs. An IMF is characterized by some specific properties [6, 29]:
Each IMF is expected to have the following properties The number of zero crossings and the number of
extrema points is equal or differs by only one, The envelopes defined by the local maxima and
minima, respectively, are locally symmetric around the envelope mean.
The sifting process stops when the resulting image satisfied the characteristics of an IMF, as it is described above. In other term, it stops when the envelope mean signal is close enough to zero. After an IMF is found, we define the residue as the result of subtracting this IMF
from the input image and then we iterate on the residue. The BEMD is completed when the residue, ideally, does not contain any extrema points. This is if we suppose that the sifting process will converge, things that never been rigorously demonstrated. So, we have to determine a criterion for the sifting process to stop, this can be accomplished by limiting the size of the SD, computed from the two consecutive sifting results as:
In practice, we have used SD between 0.02 and 0.3 and this stop criterion gives satisfying results.
5. Stopping criteria for the decomposition
Generally, the decomposition stops when the number of extrema is less than 2; that‟s mean that there is no more oscillations to extract. In some case we can have a high number of IMFs without meeting this condition, so we should set a maximal number of IMF to extract. We can stop the decomposition depending on the need; for example, in image denoising we will need only the first IMF [7].
B. FABEMD steps
The decomposition FABEMD is a new simple, efficient and fast method of envelope estimation that replaces the surface interpolation step by a direct envelope estimation method precisely we used a filter. The FABEMD has the same steps as the BEMD except that the construction of the mean envelope is different from that of the BEMD.
Construction of the mean envelope by FABEMD: • calculate a max-min filter.
• calculate the upper and lower envelope after smoothing. • Determine the mean envelope.
To determine the filtering window, FABEMD uses an adaptive method to each IMF [11]. Fig. 1 shows an example of decomposition of an image by FABEMD.
III. MODELLING WITH GENERALISED GAMMA
DISTRIBUTION.
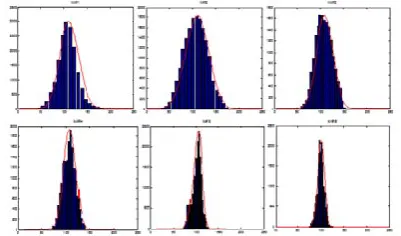
Figure 2. IMFs coefficients distribution for image of Fig .1.
subbands of the Dual-Tree Complex Wavelet Transform (DT-CWT) modelled by a generalized gamma law. Empirically, we noticed that the histogram derived from each IMF seems also to follow a generalized gamma law as illustrated below.
The probability density function of the GG distribution is:
0 , , , 0 y , e y , , // y f y 1 (5)
where Γ (. ) is the Gamma function , and are shapes
parameters, and
a scale parameter.The measure of KLD between two Generalized Gamma as follows
, ,
, ,
(6) log log p // p KL 0 0 0 GGamma
,
,
and
p
GG
,
,
.
GG
p
with
0
0
0
0
0
1 , , , , 0 0 0: The moment of order 1 of the gamma generalized.
,
,
log
1
: The geometric mean of gamma generalized.
We propose to characterize images by using the coefficients
(
,
,
)
of the distribution law for all IMFs of the BEMD decomposition.IV. PROBABILISTE IMAGE RETRIEVAL
Let‟s assume that we have N images
I
i,1
i
N
inour database. Each image is represented by a data
vector
x
i
x
i1,...,
x
in
, which is an element of some feature space Xn and is obtained by feature extraction (FE). The retrieval task is to search the K mostsimilar images to a given query image
q
I
. We assume thequery image is represented by data vector
q
x
. From theprobabilistic point of view, each data vector contains n
realizations i.i.d. random variables
n 1
,...,
x
x
whichfollow a parametric distribution with probability density
function (PDF)p(x),n. Given that we have a
consistent estimator
for the parameter vector
, wecan use
without limitations. Under these premises, it is natural to select the most similar imageI
r toI
q as the one, whose parameter vector
r leads to a maximization of the likelihood/ log-likelihood function, i.e.)) / x ( p log( n 1 max arg
r j j
j
(7)
Note, that the additional factor
n
1
does not affect themaximization result. By applying the weak law of large numbers to (7) as
n
(asymptotic case), we obtain)) / x ( p log( max arg
r P(x ) i
i q
(8)
argmax p(x )log(p(x/ q))dx
D q i
(9)where the term P(xq)(.)denotes the expectation with respect to p(x q) and D denotes the domain ofp(x .).
By observing that p(x q)is an independent term for maximization, we can rewrite Eq.(8) as the following minimization problem:
i
i D
q)log(p(x/ ))dx
x ( p min arg r
(10))dx ) / x ( p ) / x ( p log( ) x ( p min arg i q D q i
(11)We note that the term )dx
) / x ( p ) / x ( p log( ) x ( p i q D q
of (11)is simply the measure of KL distance KL
pq pi
betweenp
(
x
/
q)
andp
(
x
/
i)
withp
i
p
(
x
/
i)
. So, the problem of maximizing the log-likelihood function can be seen as a minimization of the KL measure.A reasonable similarity measure between images is one of the essential parts of every image retrieval and classification system. To compute the distance between two signatures, we estimate the KLD of the coefficient distribution law.
V. PROPOSED METHOD
Figure 3. Four possible outcomes of CBIR experiment.
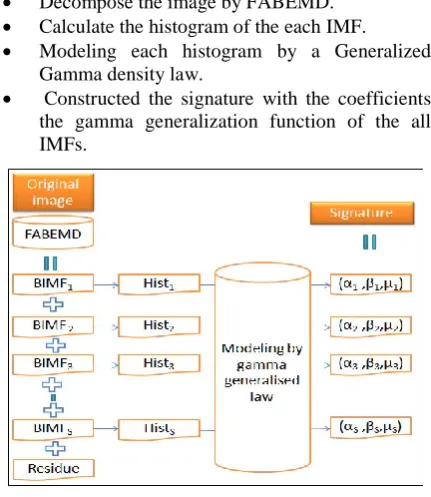
Figure 4. Diagram of construction the signature using the Gamma Generalized and FABEMD.
obtain the K most similar image from a given image database, according to some similarity criterion.
Extraction of each IMF in the BEMD requires several iterations. Because the surface interpolation method itself fits a surface in an iterative optimization approach, it makes the BEMD process complex and excessively time consuming. For this, we used the FABEMD.
A. Signature
The algorithm for construction of the signature is (The diagram of this construction is presented in Fig. 3):
Decompose the image by FABEMD.
Calculate the histogram of the each IMF.
Modeling each histogram by a Generalized Gamma density law.
Constructed the signature with the coefficients the gamma generalization function of the all IMFs.
B. Distance
The distance is a weighted sum of the KLD between corresponding IMF‟s signature of two images.
The distance between two images
I
1andI
2is the sum of the balanced distance between IMFs.
N
1 k
0 0 0 k
2
1,I ) KLpy// , , ,py// , , I
(
D (12)
where
kthe adjustment weights and N are is the numberof IMFs.
VI. SYSTEMATIC EVALUATION
A retrieved image is considered a match if it belongs to the same category of the query image.
To evaluate the performance of these texture-image retrieval algorithm we have used two well know parameters precision and recall derived from all four possible outcomes of CBIR experiment as show in fig.4. Precision: precision is the fractal of the relevant images which has been retrieved (from all retrieval)
Precision= A/(A+B).
where A is relevant retrieved and A+B is all retrieved images.
Recall: recall is the fraction of the relevant images which has been retrieval (from all relevant).
Recall=A/(A+D).
where A is relevant retrieved and A+D is all relevant images.
We used the evaluation criteria which is the mean precision at 16, which is the ratio between the number of pertinent images recalled (same class than the query) and the total images.
Each image in the database is used as a query image.
The algorithms find the 16 first images of the database closest to the query image.
Precision is computed for this query.
Finally, we compute the mean precision.
VII. RESULTS AND COMPARATIVE STUDY
We aim to compare our approach with those proposed in [3], [4] and [12]. For this, we kept the same experimental conditions; using the database Vistex consisting of 40 classes with size 512x512 pixels. They were downloaded from MIT vision textures database [30]. We take the K-nearest images to our query image and calculate how many they are really in the same class.
We used our algorithm for constructed image signatures.
From TABLE I we can see that a method based adapted FABEMD-GG achieved the highest rates as the GWT, DWT and DTCWT.
To see the differences in retrieval rates for 40 textures of our experiments, we additionally provide the texture-specifics rates in TABLE II. For 90% of the texture, the FABEMD-GG approach achieves higher retrieval rates.
TABLE I.
MEANPRECISIONAT16.
0 0.1 0.2 0.3 0.4 0.5 0.6 0.7 0.8 0.9 1 0.5
0.55 0.6 0.65 0.7 0.75 0.8 0.85 0.9 0.95 1
Recall
pr
ec
is
io
n
FABEMD-GG
DTCWT-GG
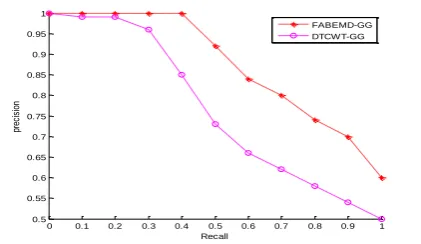
Figure 5. Performance evaluation of retrieval result in terms of precision and recall
Figure 6. .
In case of the gamma assumption, the results look similar, although we cannot provide a full listing of the results here, due to space limitations.
Fig. 5 shows the Performance evaluation of retrieval result using our approach FABEMD-GG and DTCWT-GG in terms of precision and recall.
VIII. CONCLUSION
In this paper, we proposed a new method to characterize the numerical content of texture images, where BEMD coefficients in each IMF are independently modeled by a Generalized Gamma density law. To compute the measure of similarity between GGs, we used the Kullback-Leibler Distance. We use the FABEMD because it has two advantages. On the one hand, as a fully data-driven, adaptive signal decomposition method, FABEMD can extract texture information from images efficiently. on the other hand, FABEMD can be implemented easily. FABEMD-GG functions proposed in this paper achieved encouraging experimental results. So, our future work is to try to enhance retrieval results, first by, optimizing adjustment weights (genetic algorithms). Second by, studying other database. And,
finally by, using the Directional Bidimensional Empirical Mode Decomposition.
REFERENCES
[1] C. Naster, “Indexation d‟images par le contenu: un etat de l‟art,” in CORESA‟97, March 1997.
[2] A. Smeulders, M. Worring, S. Santini, A. Gupta and R. Jain, “Content based image retrieval at the end of the early years,” IEEE Transactions on Pattern Analysis and Machine Intelligence, vol. 22, no. 12, December 2000, pp. 1349-1380.
[3] N. Kingsbury, “The Dual-Tree Complex Wavelet Transform: A new Technique for Shift-Invariance and Directional Filters,” in Proceedings of the 8th IEEE DSP Workshop, Bryce Canyon, Utah, USA, Aug, pp. 9–12, 1998.
[4] R. Kwitt and A. Uhl "Image similarity measurement by Kullback-Leibler divergences between complex wavelet subband statics for texture retrieval," in Proceedings of the IEEE international Conference on Image Processing, (ICIP‟ 2008), pp.933-936, Oct. 2008.
[5] N.E. Huang, Z. Shen, S.R. Long, M.C. Wu, H.H. Shih, Q. Zheng, N.C. Yen, C.C. Tung et H.H. Liu, , “ The empirical mode decomposition and the Hilbert spectrum for non-linear and non-stationary time series analysis,” Proceedings of the Royal Society of London, 454:903–995, 1998.
[6] J. C. Nunes, Y. Bouaoune, E. Delechelle, O. Niang, Ph. Bunel, “Image analysis by bidimensional empirical mode decomposition,” Image and Vision Computing, Vol. 21 pp. 1019–1026, 2003.
[7] A. Sabri, M. Karoud, H. Tairi and A. Aarab, “An efficient image retrieval approach based on spatial correlation of the extrema points of the IMFs,”
International Review on Computer and Software (I.RE.CO.S), ISSN: 1828-6003, Vol.3 N.6, pp. 597-604, November 2008.
[8] A. Benkuider and O. Ait Zemzami, “Indexation d‟images par la BEMD associée à la distance EMD : utilisation de la variance de l‟histogramme des IMFs,” JDTIC conférence, 2009.
[9] A.Lindrhed “2D empirical mode decomposition in the spirit of image compression," proceedings of the SPIE on Wavelet and Independent Component Analysis Applications IX, Vol. 4738, pp. 1-8. [10]Z .X. Liu, S. L. Peng, “Directionnel EMD and its
application to texture segmentation," Science in china Series F. Information Science, Vol.48, pp. 354-365, no.3, 2005.
[11]Sharif M. A. Bhuiyan, Reza R. Adhami and F. Jesmin, “Fast and adaptive bidimensional empirical mode decomposition using a novel approach of envelope estimation," IEEE Internaionl conference, 2008.
[12]A. Drissi El Maliani, M.El Hassouni and Y.Berthoumieu, “Recherche d‟image par le contenu visuel utilisant le modèle Gamma Généralisée,” JDTIC conférence, 2009.
[13]D. Dunn and W. E. Higgins, “Optimal Gabor filters for texture segmentation,” IEEE Trans. Image Proc, 4(7):947–964, July 1995.
[14]M. Unser, “Texture classification and segmentation using wavelet frames,” IEEE Trans. Image Proc., 4(11):1549–1560, November 1995.
TABLE II.
TEXTURE SPECIFIC RETRIEVAL RESULTS.
[15]JC. Carr, WR Fright and RK Beatson, “Surface interpolation with radial basis functions for medical imaging,” In: Computer Graphics Proceedings. Annual Conference Series (SIGGRAPH2001), 67-76. ACM Press, New York, August 2001.
[16]K. Coughlin and K. Tung, “Empirical Mode Decomposition of Climate Variability in the
Atmospheric,” chapiter 10. Hilbert-Huang
Transform: Introduction and Applications, world scientific publishing; edited by N. Huang and S. shen edition, 2004.
[17]P. Kuchi, “Gait Recognition Using Empirical Mode Decomposition Based Feature Extraction,” Master,
Arizona State University, December 2003.
[18]A. Addai, “Bridge sensor data analysis using the
Hilbert-Huang transform,” Rapport technique,
University of Illinois-Urbana Champaign, 2003. [19]M. Feldman, “Nonlinear system vibration analysis
using Hilbert transform,” Forced vibration analysis method ‟forcevib‟. Mechanical Systems and Signal Processing, 8(3): 309–318, Mai 1994.
[20]M. Feldman and S. Seibold, “Damage diagnosis of rotors: Application of Hilbert transform and multi-hypothesis testing,” Journal of Vibration and Control, 1998.
[21]A.O. Boudra, C. Pollet, J.C. Cexus and Z. Saidi, “Caractérisation des fonds marins par décomposition modale empirique,” In Colloque GRETSI 05, pages 559–562, Louvain-La-Neuve, Belgique, septembre 2005.
[22]J.C. Cexus and A.O. Boudraa, “Teager-huang analysis applied to sonar target recognition,”
International Journal of Signal Processing, 1:23–27, mars 2004.
[23]R. Fournier, E. Delechelle and J. Lemoine, “ Analyse du stabilogramme par décomposition modale empirique,” In GdR ISIS Thème à Journée : Décompositions Adaptatives, Université de Paris XII, Créteil, (France), avril 2004.
[24]W. Huang, Z. Shen, N.E. Huang and Y.C. Fung, “Engineering analysis of biological variables: An example of blood pressure over 1 day,” Proc. Natl. Acad. Sci. USA, 95:4816–4821, April 1998. [25] A. Benkuider, H. Tairi and A. Aarab,
“ Bidimensional Empirical Mode Decomposition: a new interpolation method,” Proceedings of 3rd
International Conference Software, Knowledge, Information Management and Application, SKIMA „09, fez, morocco, pp. 284-287, 21-23 October, 2009.
[26]A. Benkuider, H. Tairi and A. Aarab, “Olympics Bidimensional Empirical Mode Decomposition: using a novel approach of envelope estimation”,
International Review on Computers and Software (I.RE.CO.S), Vol 5.N. 4, pp. 429-435, July 2010. [27] M. Karoud, M. A. Sabri, S. J. Andaloussi, H. Tairi
and A. Aarab, “Block Image Analysis using Empirical Mode Decomposition,” journal WSEAS Transactions on Computers. Issue 12, Volume 5, pp. 2903-2911, December 2006.
[28]M. A. Sabri, M. Karoud; H. Tairi and A. Aarab, “Décomposition en Mode Empirique bidimensionnelle : Choix de la fonction d‟interpolation,” Proceding colloque international telecom‟2007 & 5èmes JFMMA 14, 15 & 16 mars 2007 Fez, Morocco.
[29]C. Damerval, S. Meignen and V. Perrier, “A fast algorithm for bidimensional EMD,” IEEE Signal Processing Letters, Vol. 12, No. 10, pp. 701-704, 2005.
[30] “MIT vision and modelling group,” [Online], Available from: http://vismod.www.media.mit.edu.
Aziza Benkuider received her Master‟s degree in 2006 from the faculty of sciences and techniques (FST) Fes Morocco. She is pursuing her Ph.D. degree. Her doctoral study focused on the application of the BEMD for image retrieval.