Energy-efficient task scheduling model based on
MapReduce for cloud computing using genetic
algorithm
Xiaoli Wang
1, Yuping Wang
1, Hai Zhu
21
School of Computer Science and Technology, Xidian University, Xi’an 710071, China
2School of Computer Science and Technology, Zhoukou Normal University, Zhoukou 466001, China
2
School of Management, Xi’an JiaoTong University, Xi’an 710049, China
Email:
{
[email protected], [email protected], [email protected]
}
Abstract— High energy consumption of data centers has become a great obstacle to the development of cloud com-puting. This paper mainly focuses on how to improve the energy efficiency of servers in a data center by appropriate task scheduling strategies. Based on MapReduce, Google’s massive data processing framework, a new energy-efficient task scheduling model is proposed in this paper. To solve this model, we put forward an effective genetic algorithm with practical encoding and decoding methods and specially designed genetic operators. Meanwhile, with a view to accelerating this algorithm’s convergent speed as well as enhancing its searching ability, a local search operator is introduced. Finally, the experiments show that the proposed algorithm is effective and efficient.
Index Terms— Energy-efficient task scheduling, Cloud com-puting, MapReduce, Genetic algorithm
I. INTRODUCTION
Cloud computing [1] is a model for enabling conve-nient, on-demand network access to a shared pool of configurable computing resources (e.g., networks, servers, storage, applications, and services) that can be rapidly provisioned and released with minimal management effort or service provider interaction. As a new business model, while being favored by providing well received services [2] [3] such as on-demand self-service, broad network access and rapid elasticity, cloud computing faces some new challenges. One of the prominent issues is the energy efficiency of data centers.
According to Amazon’s CEMS project [4], energy-related costs amount to 41.62% of the total investmen-t.The largest investment to build data centers for cloud computing is not only to purchase thousands of server equipment, but also to buy the distribution and cooling infrastructure and to pay the bill for energy consumption of all these facilities. In order to illustrate the importance of energy consumption for data centers, we introduce
This work was supported by National Natural Science Foundation of China (No.61272119 and No.61103143) , the PhD Programs Founda-tion of EducaFounda-tion Ministry of China (No.20090203110005), the China Postdoctoral Science Foundation (No. 2012M512008) and the Program for Science Technology Innovation Talents in Universities of Henan Province (No. 2012HASTIT032).
the concept, power usage effectiveness (PUE), which was developed by a consortium called The Green Grid.
Definition 1: Power Usage Effectiveness [5], is the ratio of total amount of power used by a data center facility to the power delivered to computing equipment. It is a measure of how efficiently a computer data center uses its power.
P U E= T otal F acility P ower
IT Equipment P ower
The IT Equipment Power is the power delivered to the critical load, the servers in the data center, while the total facility power in addition to the servers also includes other energy facilities, specifically, the energy consumed by distribution and cooling infrastructure which accounts for the main part. A PUE of 2.0 states that for every watt delivered to the servers, we dissipate 1 watt in cooling system and power distribution.
In the Environmental Protection Agency (EPA)’s report [6] to the U.S. Congress, it is expected that equipment efficiency improvements alone, with current practices, could result in a 2011 PUE of 1.9. Data centers combining these efficiency gains with better operational practices are
expected to reach a PUE of 1.3∼1.7. Beyond that, the
EPA predicted that ”state-of-the-art” data centers could reach a PUE of 1.2. By now, Google has claimed that their data centers, on average for all, have exceeded the EPA’s most optimistic scenario [7], which is of course accompanied by doubt voices from other cloud computing providers [4].
To reduce the energy consumption of data centers and improve energy efficiency, many scholars have done some
related research, such as literature [8]∼[12]. Overall, we
can make efforts in three aspects:
• Reduce power loss during distribution.However, the statistics from Amazon’s CEMS project show that for a data center with a PUE of 1.7, an overall power distribution loss only accounts for 8% of total energy consumption. Even with better technology, the reduction will not exceed 8% [4].
example, you can use Google’s ”free cooling” mode, removing heat from servers by using evaporating water or low temperature ambient air. Google claims that there is no cooling equipment in its data centers in Belgium [13]. The climate in Belgium will support free cooling almost year-round, according to Google engineers, with temperatures rising above the accept-able range for free cooling about seven days per year on average. The average temperature in Brussels during summer reaches 66 to 71 degrees, while Google maintains its data centers at temperatures above 80 degrees. Although the ”free cooling” mode can reduce the energy consumed by cooling system, it has a key prerequisite that the providers have sufficient enough financial and technical strength to run several data centers around the world and the data can backup across those data centers with seamless migration of computing load. This is hardly possible for majority of cloud computing providers.
• Improve energy efficiency of servers. Say a data center with a PUE of 2.0, only 50% of the power can be used on severs. Therefore, it becomes critical whether servers have used all the energy to complete the workload. We are aware that low energy utiliza-tion of a server is mainly due to its idle state caused by low CPU utilization. Even at a very low load, such as 10% CPU utilization, the power consumed is over 50% of the peak power [22]. Thus, the energy efficiency of servers plays an important role for the entire energy efficiency of the data center.
This paper mainly focuses on how to improve the en-ergy efficiency of servers through appropriate scheduling strategies. Taking full consideration of the relationship between the performance and energy consumption of servers, we propose a new energy-efficient task scheduling model based on MapReduce, and design an effective genetic algorithm to solve it. As the basics of our model, section II highlights Google’s MapReduce framework; Section III presents the mathematical description of the problem and its corresponding single objective optimiza-tion model. In order to solve this model, a genetic algo-rithm and its genetic operators are designed in Section IV. Simulation experiments show that the proposed algorithm is effective and efficient in Section V. Finally, Section VI gives the conclusion.
II. BACKGROUNDKNOWLEDGE ABOUTMAPREDUCE
MapReduce [15] is Google’s massive data processing framework. It finishes the computation by mapping and reducing data under cluster environment. Users specify a map function that processes a key/value pair to generate a set of intermediate key/value pairs, and a reduce function that merges all intermediate values associated with the same intermediate key. Many real world jobs are express-ible in this model, for example, counting the frequency of all words appeared in a paper.
For the overflow of the MapReduce framework, the MapReduce library in the user program first splits the
input files into M pieces of typically 64 megabytes (MB) per piece. It then starts up many copies of the program on a cluster of machines. One of the copies of the program is special—the master. The rest are workers that are assigned work by the master. There are M map tasks and R reduce tasks to assign. A worker who is assigned a map task reads the contents of the corresponding input split. It parses key/value pairs out of the input data and passes each pair to the user- defined Map function. The intermediate key/value pairs produced by the Map function are buffered in memory. Periodically, the buffered pairs are written to local disk, partitioned into R regions by the partitioning function. The locations of these buffered pairs on the local disk are passed back to the master, who is responsible for forwarding these locations to the reduce workers. When a reduce worker is notified by the master about these locations, it uses remote procedure calls to read the buffered data from the local disks of the map workers. The reduce worker iterates over the sorted intermediate data and for each unique intermediate key encountered, it passes the key and the corresponding set of intermediate values to the user’s Reduce function. The output of the Reduce function is appended to a final output file for this reduce partition. When all map tasks and reduce tasks have been completed, the master wakes up the user program. At this point, the MapReduce call in the user program returns back to the user code.
III. ENERGY-EFFICIENTTASKSCHEDULINGMODEL
From the above background knowledge, we know that by improving the energy efficiency of servers, the power consumed by servers for accomplishing the same job will be reduced. Accordingly, the energy consumed by distribution and cooling infrastructure will be reduced, which will lead to the enhancement of data centers’ PUE. However, to improve the energy efficiency of servers can not be solved as easy as balancing loads among them so as to make all the servers’ CPU utilization reach 100%. Instead, there exists an optimal performance and energy point for each server [14].
We first give a general mathematical description of the energy-efficient task scheduling problem based on MapReduce for cloud computing, and then build its corresponding single-objective optimization model.
Mathematical description: Assuming that there are
N servers in a data center, denoted by M =
{m1, m2,· · ·, mN}. The current CPU utilization of
sev-er mk is CSk and its optimal point is COk, where
k = 1,2,· · ·, N. The input data D will be divided
into m splits with each size of 64M, denoted by D =
{d1, d2,· · ·, dm}. First, we need to randomly store these
m splits on N servers. To ensure the reliability of data,
each split will choose three different servers for storage.
We use am×3matrixP to represent the storage location
of each split, and the element pij indicates the storage
location of split di, where integer pij ∈ {1,2, . . . , N},
in which i = 1,2,· · ·, m and j = 1,2,3. From the
MapReduce framework, we know that the input data D
will be processed by m map tasks and r reduce tasks,
denoted byT ={t1, t2,· · ·, tm,· · ·, tm+r}. Provided that
the CPU required for every map task isCM, and for every
reduce task isCR . The problem is how to assign these
m+r tasks onN servers, so that the energy efficiency
of all servers reaches the highest.
Optimization model: We use vector S =
{s1, s2,· · ·, sm+r} to represent the final task scheduling
scheme, where the ith element indicates that task ti
is assigned on server msi, where 1 ≤ si ≤ N and
i = 1,2,· · ·, m+r. Traversing through the scheduling
scheme S, we can get the set of all map tasks and
reduce tasks which are assigned on server mk, denoted
as Mk and Rk respectively, where k = 1,2,· · ·, N.
Let N Mk = |Mk| and N Rk = |Rk| . Here we give
the single-objective optimization model for the energy-efficient task scheduling problem based on MapReduce for cloud computing as follows:
N
∑
k=1
(COk−(CSk+N Mk×CM+N Rk×CR))2
Subject to
(1)
{
si∈ {pi1, pi2, pi3} ifi= 1, . . . , m,
sj∈ {1,2, . . . , N} ifj=m+ 1, . . . , m+r.
(2) N Mk =|{si| si=k, i= 1,2, . . . , m}|,
wherek= 1,2, . . . , N.
(3) N Rk =|{si|si =k, i=m+ 1, . . . , m+r}|,
wherek= 1,2, . . . , N.
(4) CSk+N Mk×CM +N Rk×CR≤1,
wherek= 1,2, . . . , N.
The objective function indicates the minimum sum of the difference between server’s optimal point with its CPU utilization after scheduling. Constraints (1) expresses that
if a map task ti (where i = 1,2,· · ·, m) is assigned
on server msi, then server msi must have stored its
corresponding input data. This is because the MapReduce framework is mainly used in massive data processing and the network bandwidth is a relatively scarce resource
in cloud computing environment. MapReduce prefers moving the executive program to the node which stores the data, rather than moving the data as in traditional distributed computing. This scheduling scheme based on data location can avoid a large scale data movement, which not only reduces the network overhead, but also makes the map tasks locally read and process the data. Constrains (2) and (3) compute the number of map tasks
N Mkand reduce tasksN Rkwhich are assigned to server
mk. Constrains (4) indicates that the CPU utilization of
any server should not exceed 100% before and after the task scheduling.
IV. GENETICALGORITHM FORENERGY-EFFICIENT
TASKSCHEDULING
Task scheduling problems (for example, the job-shop scheduling problem) are among the well-known hardest combinatorial optimization problems. They have captured the interest of a significant number of researchers and an amount of literature has been published during the last five decades. Many optimization algorithms have proven useful, such as simulated annealing [16], Artificial neural networks [17], Evolutionary Computation [18]. Here we choose genetic algorithms(GAs), invented by John Holland [19], to solve the above model for the simple reason that genetic algorithms have proven to be a promising technique for many optimization, design, con-trol, and machine learning application [20] and they are well adapted to solving scheduling optimization problems. Although John Holland’s simple GA inspired all subse-quent GAs and provided the basis for theoretical analysis of GAs. For real problem solving and modeling, however, it is clear that the simple GA is limited in its power in several respects. Not all problems should use bit-string encoding, fitness-proportionate selection is not always the best method, and the simple genetic operators are not always the most effective or appropriate ones [21]. Therefore, when one wants to apply the GA to a particular problem, one faces a huge number of choices about how to proceed. Here we give a new genetic algorithm for the above energy-efficient task scheduling model, including the encoding and decoding methods for individuals and other genetic operators. In particular, to make new gen-erated individuals meet the constraints of our model, a modified operator is designed in the proposed algorithm. Meanwhile, in order to accelerate the convergence of the proposed algorithm, a local search operator is introduced. Finally, the overall genetic algorithm flow will be given in this section.
A. Encoding and decoding methods
In genetic algorithm, the encoding method is of great significance. Based on the characteristics of this energy-efficient multi-job scheduling problem, we adopt the
integer coding. Provided that there are m+r tasks need
to be processed, we use vector S = {s1, s2,· · ·, sm+r}
the ith element indicates task t
i is assigned on server
msi. This coding method has the advantages that we
can easily use relatively simple multi-point crossover operator for the evolution of individuals. To initialize the population, we give the following steps for encoding each individual:
Algorithm 3-1:
Step 1. Because it is necessary for map tasks to be as-signed on servers which store their corresponding
input data, for i = 1,2,· · ·, m, take a random
integerj∈ {1,2,3}, letsi=pij.
Step 2. Fori=m+ 1, m+ 2,· · ·, m+r, take a random
integerk∈ {1,2,· · ·, N}and set si=k.
To compute individuals’ fitness value, we need to decode it first. The individual decoding method is as follows:
Algorithm 3-2:
Step 1. For k= 1,2,· · ·, N, empty setsMk andRk.
Step 2. Fori= 1,2,· · ·, m, putiinto setMsi, in which
si is the ith element of individual S; For i =
m+ 1, m+ 2,· · ·, m+r, puti into setRsi.
Step 3. Let N Mk =|Mk| andN Rk=|Rk|.
B. Modified operator.
As the CPU utilization of each server can not exceed 100% after task scheduling, each individual, generated by population initialization or by genetic operators like crossover and mutation, must meet this constraints. Therefore, new generated individuals may need to be modified. Based on different status of each server, we will remove excess map tasks and reduce tasks allocated on it. The following algorithm shows the specific steps of the modified operator:
Algorithm 3-3:
Step 1. Decode individualS according to Algorithm 3-2.
Letk= 1.
Step 2. If k > N, stop; else if CSk +N Mk ×CM +
N Rk ×CR > 1, go to Step 3; otherwise, let
k=k+ 1, go to Step 2.
Step 3. Let d = COk −CSk. If d ≤ 0, go to step 4;
otherwise, go to step 5.
Step 4. Equationd= 0indicates that servermk has been
the best state before task scheduling, so there is
no need to assign more tasks on it, whiled <0
means that the CPU utilization of server k has
already been higher than its optimal point before task scheduling, so the best choice is not to assign more tasks on it. Therefore, in both cases, all
tasks allocated on server mk should be deleted.
LetcutN M=CMk andcutN R=CRk, go to
step 7.
Step 5. If d > 0 , then server k has not been the best
state before scheduling, but its CPU utilization
exceeds 100% after task scheduling, so we need to remove the excess part of its assignment.
Let cutN M = N Mk −d/CM and cutN R =
N Rk−(d−cutN M×CM)/CR. IfcutN R <0,
then go to Step 6; otherwise go to Step 7.
Step 6. Add reduce tasks: cutN R < 0 means that
(−cutN R) more reduce tasks should be added
on servermk, after removingcutN M map tasks
from it. Forp= 1,2,· · ·,(−cutN R), there exists
an integerc∈(m, m+r] which satisfiesc̸=k.
Letsc=k.
Step 7. Remove excess reduce tasks: Randomly take
cutN Rreduce tasks from setRk. For each taken
task ti, where i ∈ Rk, there exists an integer
w ∈ {1,2,· · ·, N} which satisfies w ̸= k. Set
si=w.
Step 8. Remove excess map tasks: Randomly take
cutN M map tasks from setMk. For each taken
taskti, wherei∈Mk, there exists an integerw
which satisfies w ∈ {pi1, pi2, pi3} and w ̸= k.
Setsi=w. Go to step 1.
C. Crossover operator.
We adopt the two-point crossover operator for the evolution of individuals. To make individuals meet the constraints of our model,the new generated individuals may need to be modified. Meanwhile, in order to speed up the convergence of the proposed algorithm, we conduct a local search operator for new generated individuals. The crossover process is as follows:
Algorithm 3-4:
Step 1. Say the crossover probability is pc. Empty the
crossover pool pl. For each individual in the
population, generate a real number q∈[0,1]. If
q≤pc, then put this individual intopl.
Step 2. Ifplis empty or there is only one individual in it,
stop; otherwise, take out two individuals S1 and
S2 from pl without replacement. Generate two
random integers c ∈ {1,2,· · ·, m}, v ∈ {m+
1,· · ·, m+r} as the crossover points.
Step 3. Generate new individuals S3 andS4 from
indi-vidualsS1 andS2 as follows:
{
S1= (s11. . . s1c | s1c+1. . . s1v | s1v+1. . . s1m+r)
S2= (s21. . . s2c | s2c+1. . . s2v | s2v+1. . . s2m+r)
⇓ ⇓ ⇓
{
S3= (s1
1. . . s1c | s2c+1. . . sv2 | s1v+1. . . s1m+r)
S4= (s2
1. . . s2c | s1c+1. . . sv1 | s2v+1. . . s2m+r)
Step 4. Modify individuals S3 and S4 according to
Al-gorithm 3-3.
Step 5. Locally searchS3andS4according to Algorithm
D. Mutation operator
We use single-point mutation operator for the evolution of individuals. Similar to the crossover operator, to make individuals meet the constraints of our model, new generated individuals from mutation operator may need to be modified. Meanwhile, in order to speed up the convergence of our algorithm, we conduct a local search operator for new generated individuals. The mutation process is as follows:
Algorithm 3-5:
Step 1. Select individuals from crossover offspring
ac-cording to the mutation probabilitypm.
Step 2. For each selected individual, say S =
{s1, s2, . . . , sm+r}, randomly generate an integer
i ∈ {1,2,· · ·, m+r}. If i ≤ m. Given that
task ti is a map task, reassign this task to a
new server mw which satisfies w ̸= si and
w∈ {pi1, pi2, pi3}. Set si =w; otherwise, task
ti is a reduce task. Randomly generate an integer
k∈ {1,2,· · ·, N} andk ̸=si. Set si =k. The
new generated individual is denoted asS′.
Step 3. Modify individualS′according to Algorithm 3-3.
Step 4. Locally searchS′according to Algorithm 3-6. Go
to step 2.
E. Local search operator
In order to accelerate the convergent speed of the proposed algorithm and enhance its searching ability, a local search operator is designed in this paper. We know that after scheduling the smaller the difference between servers’ CPU utilizations with their optimal points, the better the individual. Thus in each iteration, we select the server with the maximum difference between the CPU utilization after scheduling and its optimal point, and then reassign tasks on it to generate a new individual. After reassigning, if the new generated individual is better than the current one, update the current one and continue to the next iteration; otherwise, stop the local search.
Algorithm 3-6:
Step 1. Say the fitness value of individual S is f. Copy
this individual. Let S′ = S and decode S′
according to Algorithm 3-2.
Step 2. Among all the servers, there exists a server mk
with the highest CPU utilization, and at least one
task is assigned on it. Let d = COk −CSk.
If d < 0, then the initial CPU utilization of
servermk has been higher than its optimal point
before scheduling, so all tasks allocated on it
should be removed. Set cutN M = CMk and
cutN R = CRk, and go to step 4; otherwise,
let cutN M = N Mk −d/CM and cutN R =
N Rk−(d−cutN M∗CM)/CR.
Step 3. Remove excess map tasks: Randomly take
cutN M map tasks from setMk. For each taken
task ti where i ∈ Mk, there exists an integer
w∈ {pi1, pi2, pi3} andw̸=k. Set s′i=w.
Step 4. Remove excess reduce tasks: Randomly take
cutN Rreduce tasks from setRk. For each taken
task ti where i ∈ Rk, there exists an integer
w∈ {1,2,· · ·, N} andw̸=k. Sets′i=w.
Step 5. Re-decode individual S′ according to Algorithm
3-2 and compute its fitness value f′. If f′ < f,
thenS′is better thanS, letS=S′and go to step
2; otherwise, re-copy individualS, letS′=Sand
decode S′ according to Algorithm 3-2.
Step 6. Among all the servers, there exists a server
mk with the lowest CPU utilization. Let d =
COk −(CSk +N Mk ×CM +N Rk ×CR),
addN M = d/CM and addN R = (d −
addN M×CM)/CR.
Step 7. Add map tasks: According to the storage location of each data split, we can get all tasks which
can be assigned on server mk, denoted as set
M Mk. Disorder elements in setM Mk. For x=
1,2,· · ·, addN M, there exists a map taskti that
satisfies i∈M Mk ands′p̸=k. Lets′p=k.
Step 8. Add reduce tasks: For x = 1,2,· · ·, addN R,
there exists an integerc∈ {m+1, m+2, . . . , m+
r} which satisfiess′c̸=k. Let s′c=k.
Step 9. Decode individualS′ according to Algorithm 3-2
and compute its fitness valuef′. Iff′ < f, then
S′ is better than S, letS=S′ and go to step 6;
otherwise, stop.
F. A genetic algorithm for energy-efficient task scheduling
After presenting the above genetic operators in detail, we give the overall genetic algorithm flow for energy-efficient task scheduling in this section.
Algorithm 3-7:
Step 1. Initializing. Choose proper genetic parameters
in-cluding population sizeX, crossover probability
pc, mutation probabilitypmand elitist numberk.
Generate an initial populationP. Modify each
in-dividual in populationP according to Algorithm
3-3 and compute its fitness value. Set generation
numbert= 0.
Step 2. Crossover. Execute crossover by Algorithm 3-4.
The offspring set is denoted asP1 and compute
each offspring’s fitness value.
Step 3. Mutation. Execute mutation onP1by Algorithm
3-5. The offspring set is denoted as P2 and
compute each offspring’s fitness value.
Step 4. Elitist strategy. Sort the individuals in set
P∪P1∪P2 according to their fitness values,
and select the bestkindividuals directly to form
the next generation population, while the others
X −k individuals are selected by using the
roulette wheel method on setP∪P1∪P2.
Step 5. If stopping criterion is not meet, lett=t+ 1, go
V. EXPERIMENTS ANDANALYSIS
A. Parameter values
According to the real cluster configuration in a data center provided by Google [15], we assume that there are
200 servers in a data center, asN = 200. The input data
size is 1250G and it can be divided into 20000 splits,
which means m = 20000. Each split randomly select
three servers to back up its data. Suppose that the number of reduce tasks required for completing this job is 450,
which meansr= 450.
Based on a 3-year amortization schedule for servers in a data center, different server may has different optimal performance-energy point for how long it has been used. Here we assume that 1/3 servers have been used for one year with its optimal point of 0.9, while other 1/3 servers have been used for two years with its optimal point of 0.7 and the others for three years with its optimal point of 0.5.
Take random real numbers over[0,0.35]as servers’ initial
CPU utilization values. To reflect the effectiveness of the proposed algorithm well, we set some special initial states of servers as follows:
CS[5] = 0.5 CS[75] = 0.5 CS[145] = 0.5
CS[25] = 0.7 CS[95] = 0.7 CS[165] = 0.7
CS[45] = 0.9 CS[115] = 0.9 CS[195] = 0.9
In the proposed energy-efficient task scheduling algo-rithm, we adopt the following genetic parameters:
pop-ulation size X = 100; crossover probability pc = 0.6;
mutation probabilitypm= 0.2; elitist numberk= 5and
stop criteriont= 2000.
B. Simulation results and comparisons
We conduct three sets of comparative experiments between the proposed algorithm and the Hadoop MapRe-duce [22]. Hadoop MapReMapRe-duce is an open source which is used extensively across Yahoo!’s businesses. With a significant technology investment by Yahoo!, Hadoop has become an enterprise-ready cloud computing technology. It is becoming the industry de facto framework for big data processing.
Comparison 1: We implement this experiment to observe the performance of these two algorithms under normal conditions. Suppose that the CPU requirements
for each map task and reduce tasks are CM = 0.0052
andCR= 0.002respectively. The experimental results of
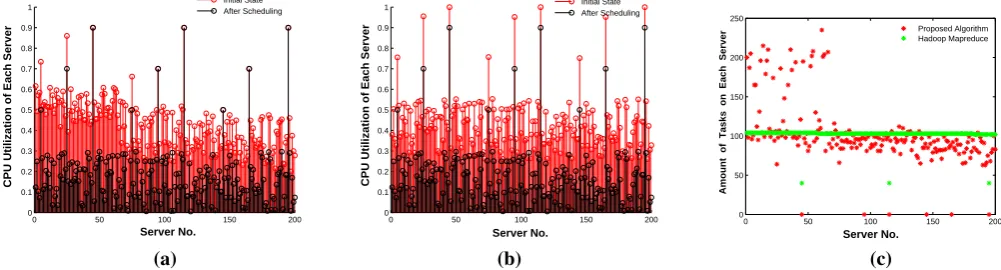
the energy-efficient task scheduling algorithm proposed in this paper are shown in Fig. 1(a), while the results of the Hadoop MapReduce scheduling are shown in Fig. 1(b).
Comparing Figs. 1(a) with 1(b), we can clearly see that the proposed algorithm in this paper can effectively schedule tasks on servers according to each server’s
optimal performance-energy point. For the5th,75thand
145thservers with the same initial CPU utilization of 0.5,
since the optimal points of these three servers are 0.9, 0.7 and 0.5, the proposed algorithm only assign tasks on
the 5th and75thservers, while the145thserver stays at
its original state. Similarly, for the25th,95thand165th
servers with the same initial CPU utilization of 0.7, the
proposed algorithm only assign tasks on the25th server.
Also, for the45th,115thand195thservers with the same
initial CPU utilization of 0.9, the proposed algorithm does not assign any task on them.
From another perspective, we check the total amount of tasks assigned on each server. For the proposed algorithm, it can be seen from Fig. 1(c) that the higher the server’s optimal performance-energy point, the more tasks it needs to deal with, expect for those servers with high initial CUP utilizations. In contrast, for the Hadoop MapReduce scheduling, if not taken server’s initial state into consid-eration, all servers nearly have the same number of tasks assigned on them.
Furthermore, computing the value of the energy inef-ficiency of servers by these two algorithms according to the objective function in our model, we obtain 0.240425 by the proposed algorithm, while 6.47969 by the Hadoop MapReduce scheduling, which means that the perfor-mance of the proposed algorithm is 30 times better than that of the Hadoop MapReduce scheduling. Therefore, we can safely get the conclusion that the proposed algorithm can greatly improve the energy efficiency of servers, so as to enhance the PUE of data centers.
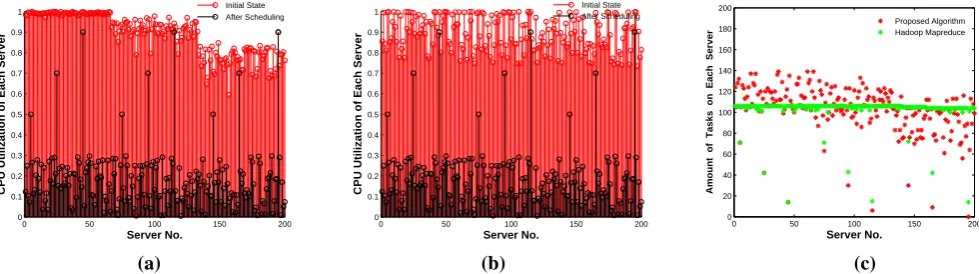
Comparison 2:We conduct this experiment under one of the worse case, that is, when the system runs on low load state, in order to check out weather the pro-posed algorithm has the similar scheduling scheme as the Hadoop MapReduce does. Suppose that the input data to be processed is relatively small. Set the CPU requirements
for each map task and reduce task areCM = 0.0025and
CR = 0.001 respectively. The experimental results of
the energy-efficient task scheduling algorithm proposed in this paper are shown in Fig. 2(a), while the results of the Hadoop MapReduce scheduling are shown in Fig. 2(b). To look at Figs. 2(a) and 2(b) from another perspective, we shown the total amount of tasks assigned on each server for these two algorithms after scheduling in Fig. 2(c).
Let us start the analysis of these two algorithms by comparing Fig. 2(c) with Fig. 1(c), where we will find that the Hadoop MapReduce scheduling has the same pattern of task distribution no matter under general conditions or the worst case, that is, if not taken server’s initial state into consideration, all servers nearly have the same number of tasks assigned on them. However, for the proposed algorithm, the gaps among the numbers of tasks assigned on each server are relatively large when servers run under general conditions, while the gaps are much smaller when servers run under low load. Fortunately, the performance of the proposed algorithm in this paper does not fall to the performance level of the Hadoop MapReduce Scheduling in the worst case. This can be confirmed from the following two aspects:
0 50 100 150 200 0
0.1 0.2 0.3 0.4 0.5 0.6 0.7 0.8 0.9 1
Server No.
CPU Utilization of Each Server
Initial State After Scheduling
0 50 100 150 200
0 0.1 0.2 0.3 0.4 0.5 0.6 0.7 0.8 0.9 1
Server No.
CPU Utilization of Each Server
Initial State After Scheduling
0 50 100 150 200
0 20 40 60 80 100 120 140 160 180 200
Server No.
Amount of Tasks on Each Server
Proposed Algorithm Hadoop MapReduce
(a) (b) (c)
Figure 1. Comparative experiment 1: (a) Results of the Proposed algorithm. (b) Results of the Hadoop MapReduce scheduling. (c) Amount of tasks
assigned on each server.
0 50 100 150 200
0 0.1 0.2 0.3 0.4 0.5 0.6 0.7 0.8 0.9 1
Server No.
CPU Utilization of Each Server
Initial State After Scheduling
0 50 100 150 200
0 0.1 0.2 0.3 0.4 0.5 0.6 0.7 0.8 0.9 1
Server No.
CPU Utilization of Each Server
Initial State After Scheduling
0 50 100 150 200
0 50 100 150 200 250
Server No.
Amount of Tasks on Each Server
Proposed Algorithm Hadoop Mapreduce
(a) (b) (c)
Figure 2. Comparative experiment 2: (a) Results of the Proposed algorithm. (b) Results of the Hadoop MapReduce scheduling. (c) Amount of tasks
assigned on each server.
servers (0.7), the average CPU utilization of the first 1/3 servers (around 0.55) are higher than that of the middle 1/3 servers (around 0.45) after scheduling. Similarly, the average CPU utilization of the middle 1/3 servers are higher than that of the last 1/3 servers (around 0.4). Different from the proposed algorithm, for the Hadoop MapReduce scheduling, it can be seen from Fig. 2(b) that the servers’ CPU utilization generally distributed about 0.45.
(2) Computing the value of the energy inefficiency of servers by these two algorithms according to the objective function in our model, we obtain 18.5475 by the proposed algorithm, while 22.3556 by the Hadoop MapReduce scheduling, which means that the performance of the proposed algorithm is better than that of the Hadoop MapReduce scheduling.
In view of the above aspects, we can safely come to the conclusion that even when the system runs under low load, the proposed algorithm can improve the energy efficiency of servers , so as to enhance the PUE of data centers.
Comparison 3: We implement this experiment under the other worse case in order to check out weather the proposed algorithm has the similar scheduling scheme as the Hadoop MapReduce does. Suppose that the input data to be processed is relatively large, which will make the servers running under heavy load. Set the CPU
require-ments for each map task and reduce task areCM = 0.007
andCR= 0.006respectively. The experimental results of
the energy-efficient task scheduling algorithm proposed in this paper are shown in Fig. 3(a), while the results of the Hadoop MapReduce scheduling are shown in Fig. 3(b). To look at Figs. 3(a) and 3(b) from another perspective, we shown the total amount of tasks assigned on each server for these two algorithms after scheduling in Fig. 3(c).
Let us start the analysis of these two algorithms by comparing Fig. 3(c) with Fig. 1(c), where we will find that the Hadoop MapReduce scheduling has the same pattern of task distribution no matter under general conditions or the worst case, that is, if not taken server’s initial state into consideration, all servers nearly have the same number of tasks assigned on them. However, for the proposed algorithm, the gaps among the numbers of tasks assigned on each server are relatively large when servers run under general conditions, while the gaps are much smaller when servers run under heavy load. Fortunately, the performance of the proposed algorithm in this paper does not fall to the performance level of the Hadoop MapReduce Scheduling in the worst case. This can be confirmed from the following two aspects:
0 50 100 150 200 0
0.1 0.2 0.3 0.4 0.5 0.6 0.7 0.8 0.9 1
Server No.
CPU Utilization of Each Server
Initial State After Scheduling
0 50 100 150 200
0 0.1 0.2 0.3 0.4 0.5 0.6 0.7 0.8 0.9 1
Server No.
CPU Utilization of Each Server
Initial State After Scheduling
0 50 100 150 200
0 20 40 60 80 100 120 140 160 180 200
Server No.
Amount of Tasks on Each Server
Proposed Algorithm Hadoop Mapreduce
(a) (b) (c)
Figure 3. Comparative experiment 3: (a) Results of the Proposed algorithm. (b) Results of the Hadoop MapReduce scheduling. (c) Amount of tasks
assigned on each server.
average CPU utilization of the middle 1/3 servers are higher than that of the last 1/3 servers (around 0.8). Different from the proposed algorithm, for the Hadoop MapReduce scheduling, it can be seen from Fig. 3(b) that the servers’ CPU utilization generally distributed between 0.9 and 1.
(2) Computing the value of the energy inefficiency of servers by these two algorithms according to the objective function in our model, we obtain 8.79651 by the pro-posed algorithm, while 12.931 by the Hadoop MapReduce scheduling, which means that the performance of the proposed algorithm is better than that of the Hadoop MapReduce scheduling.
In view of the above aspects, we can safely come to the conclusion that even when the system runs under heavy load, the proposed algorithm can improve the energy efficiency of servers , so as to enhance the PUE of data centers.
VI. CONCLUSION
The energy efficiency of servers plays a significant role in the overall energy consumption of the data center. This paper mainly focuses on how to improve the ener-gy efficiency of servers through appropriate scheduling strategies. Taking full consideration of the relationship between the performance and energy consumption of servers, we propose a new energy-efficient task scheduling model based on the Google’s massive data processing framework, MapReduce, and give the corresponding al-gorithm. Meanwhile, we design a practical encoding and decoding method for the individuals, and construct an overall energy efficiency function of the servers as the fitness value of the individual. Also, in order to accelerate the convergent speed and enhance the searching ability of our algorithm, a local search operator is introduced. Finally, the experiments show that the proposed algorithm is effective and efficient.
ACKNOWLEDGEMENT
This work was supported by National Natural Science Foundation of China (No.61272119 and No.61103143) , the PhD Programs Foundation of Education Ministry of China (No.20090203110005), the China Postdoctoral
Science Foundation (No. 2012M512008) and the Program for Science Technology Innovation Talents in Universities of Henan Province (No. 2012HASTIT032).
REFERENCES
[1] Mell P, Grance T. The NIST definition of cloud com-puting[J]. National Institute of Standards and Technology, 2009,53(6)
[2] Malin Song, Ben-Chang Shia, Hailiang Yao, Wei Wang, Kuangnan Fang. Small and Medium Enterprises Risky Prediction System Based On Cloud Computing. Journal of Software, Vol.7, No.10, 2012.
[3] Zeeshan Pervez, Asad Masood Khattak, Sungyoung Lee, Young-Koo Lee. Achieving Dynamic and Distributed Ses-sion Management with Chord for Software as a Service Cloud. Journal of Software, Vol.7, No.6, 2012.
[4] Hamilton J. Cooperative expendable micro-slice servers (CEMS): low cost, low power servers for internet-scale services[C]. 4th Biennial Conference on Innovative Data Systems Research (CIDR) Asilomar, California, USA, Jan. 4C7, 2009.
[5] Belady C. The Green Grid Data Center Power Efficiency Metrics: PUE and DCiE [J]. White paper: Metrics and Measurements, 2007
[6] Brown R, Masanet E, Nordman B, et al. Report to Congress on Server and Data Center Energy Efficiency Public Law 109-431[J]. Public law, 2007,109:431 [7] Google. Efficiency measurements.
http://www.google.com/about/datacenters/efficiency/internal/. [8] Beloglazov A, Buyya R. Energy efficient allocation of
vir-tual machines in cloud data centers, 2010[C]. IEEE/ACM International Conference on Cluster, Cloud and Grid Com-puting
[9] Berl A, Gelenbe E, Di Girolamo M, et al. Energy-efficient cloud computing[J]. The Computer Journal, 2010,53(7):1045
[10] Buyya R, Beloglazov A, Abawajy J. Energy-Efficient management of data center resources for cloud computing: A vision, architectural elements, and open challenges[J]. Arxiv preprint arXiv:1006.0308, 2010
[11] Baliga J, Ayre R W A, Hinton K, et al. Green cloud computing: Balancing energy in processing, storage, and transport[J]. Proceedings of the IEEE, 2011,99(1):149-167 [12] Barroso L A, H Lzle U. The datacenter as a computer: An introduction to the design of warehouse-scale machines[J]. Synthesis Lectures on Computer Architecture, 2009,4(1):1-108
[14] Srikantaiah S, Kansal A, Zhao F. Energy aware consolida-tion for cloud computing, 2008[C]. USENIX Associaconsolida-tion [15] Dean J, Ghemawat S. MapReduce: Simplified data pro-cessing on large clusters[J]. Communications of the ACM, 2008,51(1):107-113
[16] Kirkpatrick S, Gelatt Jr C. D, and Vecchi M. P. Optimiza-tion by simulated annealing. Science, 220:671-680, 1983. [17] Hopfield J.J. Neural networks and physical systems with emergent collective computational abilities. In Proceedings of the National Academy of Sciences, pages 2554-2558, 1982.
[18] K. A. De Jong and W. M. Spears. On the state of evolu-tionary computation. Proceedings of the Fifth International Conference on Genetic Algorithms, pages 618-623, San Mateo, CA, June 1993.
[19] Holland J.H. Adapatation in Natural and Artificial System-s. Ann Arbor: University of Michigan Press, 1975 [20] Ying-Hong Liao, and Chuen-Tsai Sun. An Educational
Genetic Algorithms Learning Tool. IEEE Transactions on Education. 2, 44, 2001
[21] M. Mitchell, An Introduction to Genetic Algorithms. MIT Press, 1997.
[22] White T. Hadoop: The Definitive Guide[M]. O’Reilly Media, Inc., 2010
Xiaoli Wangis currently a Ph.D. candidate at Xidian University, and major in computer science and technology.
She was born in ShanDong Province. She received her MS degree in software engineering from Xidian University in 2004. she is a member of the ACM and the Chinese Journal of Computers. Her research interests include distributed systems, grid computing and cloud computing.
Yuping Wang is a professor with the School of Computer Science and Technology, Xidian University, Xi’an, China.
He got Ph.D from the Department of Mathematics, Xi’an Jiaotong University, China in 1993. He is the Senior member of IEEE, and visited Chinese University of Hong Kong, City University of Hong Kong, and Hong Kong Baptist University as a research fellow many times from 1997 to 2010. He has au-thored and co-auau-thored over 100 research papers in journals and conferences. His current research interests include evolutionary computation, non-bilevel programming, global optimization, and multiobjective programming.