(will be inserted by the editor)
FPGA based real-time implementation of Bivariate
Empirical Mode Decomposition
Qasim Waheed Malik,
*Naveed ur Rehman, Sikender Gull, Shoaib Ehsan and Klaus D. McDonald-Maier
Received: date / Accepted: May 03, 2018
Abstract A Field Programmable Gate Array (FPGA) based parallel architec-ture for the real-time and online implementation of the bivariate extension of the empirical mode decomposition (EMD) algorithm is presented. Multivariate extensions of EMD have attracted significant attention in recent years owing to their scope in applications involving multichannel and multidimensional data processing, e.g. biomedical engineering, condition monitoring, image fusion. However, these algorithms are computationally expensive due to the empirical and data-driven nature of these methods. That has hindered the utilisation of EMD, and particularly its bivariate and multivariate extensions, in real-time applications. The proposed parallel architecture is aimed at bridging this gap through real-time computation of the bivariate EMD algorithm. The crux of the architecture is the simultaneous computation of multiple signal projec-tions, locating their local extrema and finally the calculation of their associated complex valued envelopes for the estimation of local mean. The architecture is implemented on a Xilinx Kintex 7 FPGA, and offers significant computational improvements over the existing software based sequential implementaions of bivariate EMD.
Keywords Bivariate Empirical Mode Decomposition; Field Programmable Gate Array (FPGA); Signal decomposition; Time-Frequency Analysis
Q. W. Malik (E-mail: [email protected]), *N. Rehman (E-mail: [email protected]) and Sikender Gull (E-mail: [email protected]) Department of Electrical Engineering,
COMSATS Institute of Information Technology, Park Road, Islamabad, Pakistan.
Tel.: +92-51-9049181
S. Ehsan (E-mail: : [email protected]), K. McDonald Maier (E-mail: : [email protected]) School of Computer Science and Electronic Engineering,
1 Introduction
Empirical Mode Decomposition (EMD) [10] decomposes an input signal into a finite number of multiple inherent scales residing in the data. Those result-ing intrinsic oscillations are termed intrinsic mode functions (IMFs). Unlike traditional multi-resolution and time-frequency methods, which employ fixed
a priori basis functions, EMD by its very nature employs data-driven basis functions, thus, enabling more accurate signal representations. Furthermore, EMD operates at the level of signal extrema, making its operation highly lo-calised as compared to other incumbent approaches [14]. The IMFs hm(t) of inputx(t) are extracted from EMD as follows:
x(t) =
M
X
m=1
hm(t) +r(t) (1)
Next, the Hilbert Transform (HT) is applied to each hm(t) separately to obtain physically meaningful estimates of instantaneous frequencies of x(t), yielding the so-called Hilbert Huang Spectrum (HHS) [10]. As indicated above, the key features of EMD include: i) local and non-linear operation at the level of signal extrema and ii) data-driven nature owing to the data adaptive basis functions used to decompose an input signal. These properties enable EMD to perform better than standardlinear time-frequency (scale) methods, such as the short-time Fourier transform and the discrete wavelet transform employed in many real world applications involving nonlinear and non-stationary data [14]. Specifically, EMD has recently found numerous applications ranging from biomedical engineering [15], data fusion [19] and condition monitoring [26].
In its original formulation, EMD can only process signals containing a single channel (univariate data). Its important extensions for multichannel data include: i) Complex EMD (CEMD) [22]; ii) Rotation-invariant EMD (RI-EMD) [3]; iii) Bivariate EMD (BEMD) [21] and iv) Multivariate EMD (MEMD) [18]. Among those extensions, MEMD operates for data containing more than two channels, whereas the remaining extensions are all designed for complex/bivariate data, consisting of up to two channels. A critical task in multichannel EMD extensions is the estimation of the multivariate local mean of the input signal based on its extrema. This is not a trivial task, however, and is performed by projecting the multivariate signal along different static but uniform directions in multidimensional space to obtain real-valued projec-tions; interpolating the extrema locations of projected real-valued signals; and finally calculating their mean. For complex/bivariate data, BEMD has shown a considerable potential for signal decomposition and its subsequent analysis and processing [17].
Despite the popularity of EMD and its multichannel extensions in signal decomposition and analysis, major obstacles for its real-time and online appli-cations include: i) significant computational requirements of EMD based algo-rithms owing to their data driven nature, and ii) the lack of optimal hardware architectures and implementations for their efficient computation. While few
parallel hardware implementations of standard univariate EMD are available (discussed below), only C and MATLAB based sequential implementations of multichannel extensions of EMD currently exist, limiting their usage solely to off-line applications with no real-time constraints. To that end, a novel parallel hardware architecture for efficient computation of BEMD is proposed based on Field Programmable Gate Arrays (FPGAs).
The proposed architecture is the first ever FPGA based parallel hardware design for computing the bivariate extension of EMD. As mentioned before, local mean estimation in BEMD requires computation of multiple (>2) signal projections and their corresponding complex envelopes. The proposed architec-ture computes these simultaneously, which significantly reduces the processing time as compared to the sequential BEMD implementations. The number of iterations for each IMF are customized in our architecture which are computed by individual modules and connected serially to form a pipeline structure. The sampling frequency in the proposed implementation can reach up to 25 MHz which makes it suitable for the online computation of complex signals.
The paper is organized as follows: Section II provides a short review of parallel implementations of EMD and BEMD. Section III presents algorith-mic details of the BEMD algorithm. Section IV gives details of the proposed FPGA design of BEMD, with the main emphasis on the complex envelope and local mean estimation process, which is the crux of the BEMD operation. Section V reports results of experiments conducted on synthetic and natu-ral bivariate data sets using the proposed architecture. Finally, Section VI provides concluding remarks and gives some ideas for relevant future work.
2 Related work
Among the handful of parallel implementations of EMD, a GPU based imple-mentation of EMD proposed by Waskitoet al.[25] achieved an approximately 28 times speedup over the sequential C implementation of EMD. Similarly, Chenet al., reported a speedup of 31 times for their GPGPU-aided Ensemble EMD implementation over the serial C implementation of the same algorithm [5]. Recently, a couple of parallel implementations of Multidimensional En-semble EMD (MEEMD) algorithm have been proposed, based on OpenMP and CUDA programming models respectively [4], again reporting significant speedup when compared against the sequential implementations.
A hardware accelerated EMD implementation was proposed in [24], whereby an FPGA was employed as a hardware accelerator, while the main EMD com-putation was still performed in software. In [11], an FPGA was used as data flow controller while the core EMD algorithm was implemented on a DSP chip. The tasks of the data controller based on a FPGA included relaying data of 1000 samples length to the DSP, data transfer from the ADC to the DSP, from the DSP back to a DAC. As expected, both the above designs are limited in their performance output, since the core EMD algorithm is not computed in the FPGA.
A first FPGA based real-time EMD architecture was proposed in [8]. In that architecture, the FPGA computed upper and lower envelopes of input data in parallel to attain real-time processing of the EMD operation. The interpolation of maximum and minimum points to obtain upper and lower envelopes respectively was performed using a saw-tooth method and multiple modules were added serially to compute each iteration of an IMF, thus enabling a pipeline structure. The method can process signals with sampling frequency of up to 12.5 MHz, a significant improvement over the DSP-FPGA based architecture [11] which could only handle sampling frequencies up to 1 KHz.
For BEMD, only sequential MATLAB and C++ based software imple-mentations are currently available [6], which limit the utilisation of BEMD to non real-time applications. The FPGA based architecture proposed here for BEMD is the first attempt to alleviate this problem and enable BEMD to be used for real-time applications.
While the proposed architecture for BEMD computation can be seen as an extension of the one proposed in [8] for EMD, there are also significant differences between the two architectures owing to the algorithmic differences between EMD and BEMD. Specifically, the local mean computation in BEMD is achieved by taking multiple real-valued projections of the input signal in 2-D space in contrast to the fixed 2 projections in EM2-D. That results in the following architectural differences in the proposed work as compared to [8].
– The input signal is projected along multiple directions in 2-D space with the help of Data Projection block, which is not present in [8].
– Complex interpolation is carried out by computing the real and imaginary components of each projected signal simultaneously.
– A complex envelope is computed for each projection independently, and mean of all these complex envelops yield the local mean.
– Exrema detection module in the proposed architecture is also improved to get better results as compared to [8].
3 Bivariate Empirical Mode Decomposition
The bivariate extension of empirical mode decomposition extends the intuitive notion of ‘oscillations’ in standard EMD to its two dimensional counterpart - rotations. It operates by projecting an input bivariate signal inV different directions in 2D space, with each direction vector defined based on equidis-tant points along a unit circle in 2D. Next, the corresponding complex-valued envelopes for each direction are obtained by interpolating the extrema of pro-jected signals via component-wise interpolation1; these envelopes are then av-eraged to obtain the local mean. The larger the number of directions employed in BEMD, i.e. larger the value of V, the more accurate the estimate of the envelope. Assuming four directions, the center of the envelopes at a point
1 Any interpolation scheme can be used for this purpose, though the cubic spline
in space is given by the barycenter of the four points. For a given complex-valued input signalz(t), the details of a single sifting operation within BEMD are summarised in Algorithm 1.
Algorithm 1 The sifting process in BEMD
1: Given a complex-valued (bivariate) input signal z(t), obtain V signal projections,
{wθv(t)}
V
v=1, along uniform directionsθvvia
wθv(t) =R e −ıθv
z(t) (2)
whereR(·) denotes the real part of a complex number, andθv= 2vπ/V forv= 1, . . . , V;
2: Find the locations{tv
j}Vv=1corresponding to the maxima of{wθv(t)}
V v=1;
3: Interpolate (using saw tooth or spline interpolation) between the maxima points [tv
j, z(tvj)], to obtain the envelope curves{eθv}
V v=1;
4: Calculate the bivariate mean,m2(t), of all the envelope curves
m2(t)≈ 1 V V X v=1 eθv(t) (3)
5: Subtractm(t) from the input signalz(t) to yield an oscillatory componentd(t).
The remainder of the method is similar to the standard univariate EMD, that is, if the oscillatory component d(t), obtained by subtracting the local meanm(t) from the input signalz(t), meets the stoppage criterion for bivariate IMF, then the process is re-applied to z(t)−d(t), otherwise, it is applied to d(t). The stopping criterion used with the BEMD algorithm is similar to the criterion employed for the standard EMD [9].
4 FPGA based Hardware Architecture of BEMD
The proposed architecture exploits the inherent parallelism in the BEMD algo-rithm to yield a pipelined structure for the real-time computation of BEMD. In our hardware architecture, theSnumber criterion is employed within BEMD, which is a simple, yet effective method for real-time implementation of BEMD. TheSnumber criterion defines that there are customized number of iterations to generate an IMF. It is suggested that the value ofSshould be in the range of 3 to 5 to generate a suitable IMF [9]. The proposed implementation is tested to yield two IMFs and a residue only, though owing to our modular architecture, additional IMF modules can be cascaded to yield more than two IMFs.
4.1 Overall BEMD Operation
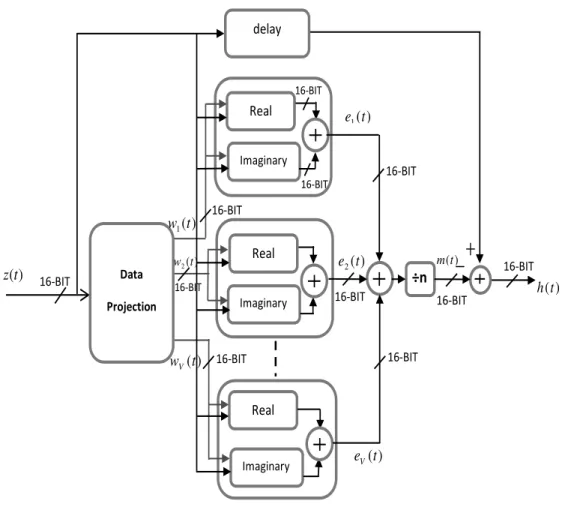
Fig. 1 shows the operation of the proposed hardware BEMD implementation via a block diagram. Here,z(t) denotes a 16-bit bivariate input signal, which
) (t z w(t) V v vt e 1 )} ( = ) ( 1 1t h 1() 1 t hS− ) ( 1t h ) (t w V v vt e 1 )} ( = ) ( 1 2t h 1() 2 t hS− ) ( 2t h ) (t r
Fig. 1 Block diagram showing all the main blocks in the proposed Kintex 7 XC7K480T
based FPGA architecture for BEMD.
is taken from an external ADC with a sampling frequency equal to the clock rate of the proposed system, i.e. 25 MHz.{h1
1, h21, . . . h S
1}are the set ofS out-puts of basic BEMD iteration blocks corresponding to the first IMF which are cascaded for continuous and sequential data output. The inputz(t) is concur-rently delivered to the projection block which projects the input signalz(t) in V directions, and to the extrema detection and interpolation block, which along withV signal projections detects the extrema points of the input signal. These extrema points are interpolated to generateV complex envelopes and the mean of these envelopes is subtracted from the delayed input to produce
h1
1(t), the output of first iteration, which in turn becomes the input for sec-ond iteration block. The IMF 1 h1(t) is the output ofS-th iteration which is subtracted from the delayed inputz(t) and the residue becomes the input of next iteration block for the computation of IMF 2,h2(t). Thus, the output of everyS-th iteration block is an IMF (also 16-bit) in our case, which is sub-tracted from the ‘delayed’ input to yield a residue signal. Subsequently, the
) (t h ) (t z ) (t m ) ( 1 t e ) (t e V ) ( 2 t e ) ( 1 t w ) (t w V ) ( 2 t w
Fig. 2 Block diagram illustrating the sifting operation of BEMD for a single complex IMF
calculation.
residue signal is used as input to the next block to yield the second IMF and so on. Note that S denotes the number of customised iterations used in our architecture to obtain a single IMF;S = 5 iterations are used in our work.
It is important to note that there are two types of delays shown in Fig. 1: one of them is associated with each iteration block and is responsible to add delay (equal to time required to compute local mean) to the input of that iteration block such that the local mean can be subtracted from delayed input. The other is associated with each IMF block and is responsible for adding delay to the input of IMF block, in order to subtract the output of last iteration in that IMF block from the delayed input to yield an IMF and a residue.
4.2 Sifting Algorithm for Complex IMF Extraction
The proposed architecture of a single iteration block of the BEMD is shown in Fig. 2. As indicated in the step 1 of the Algorithm 1,V real-valued projections, denoted byw1(t), w2(t), . . . , wV(t), of the input bivariate signal z(t) are first obtained through eq. (2). Next, those projections along with the input signal z(t) are used to generate the envelopes ofz(t) corresponding to each projec-tion; the resulting complex envelopes2are denoted by{e
1(t), e2(t), . . . , eV(t)} respectively.
As shown in Fig. 2, the complex envelopes are computed in parallel, to reduce the processing time of the algorithm. The local mean of z(t), denoted by m(t), is then estimated by taking the mean of all V complex envelopes utilising eq. (3). In hardware, that simply requires addition of multiple en-velopes (discrete signals) and division by a constant. Finally, the output of a single iteration block is obtained by subtracting the local meanm(t) from the delayed input signalz(t) in accordance with the step 5 of Algorithm 1. Shift registers are employed to delayz(t), where the number of shift registers used are equal to the number of clock cycles by which the mean envelope lags the inputz(t).
Note that the above block for performing a single sifting iteration within BEMD highlights the major architectural difference between our proposed sys-tem and that in [8]. For the case of EMD, the corresponding block is shown in Fig. 5 in [8]. There, the design looks quite simple since only two envelopes (upper and lower) are required to compute the local mean via their averag-ing. However, in BEMD, the local mean computation is not a trivial task, since multiple envelopes in different directions in the 2D space are required to compute the local mean, as discussed in the previous section. It can be seen from Fig. 2 that it consists of a signal projection block, which computes mul-tiple signal projections in different directions in the 2D space. It is followed by the computation of multiple complex envelopes (one for each projection) via complex interpolation of extrema points of each projection. The complex interpolation is carried out by computing the real and imaginary components of the each projected signal simultaneously as shown in Fig. 2.
4.3 Complex Envelope Estimation
This section presents the architecture for the complex envelope estimation module in BEMD. As indicated in the step 3 of the Algorithm 1, the construc-tion of complex-valued envelopes in BEMD is achieved by applying saw tooth interpolation on real and imaginary components of input z(t) separately. In the proposed architecture, saw tooth interpolation on both the components is performed in parallel. It is also assumed that the sampling frequency of input data is the same as the clock frequency of FPGA.
2 The detailed design and implementation for multiple complex envelope generation is
)
(
t
w
Bx Ax i Bx XOR Trigger A Cir B Cir A Ctr o En A Ctr i Reg X Reg Y Reg Z ) ( ) ( Z Y X Y ≥ ∩ > ) ( ) ( Z Y X Y > ∩ ≥ Reg A Reg B Reg C In ADD counter Ctr X Yout)
(
t
z
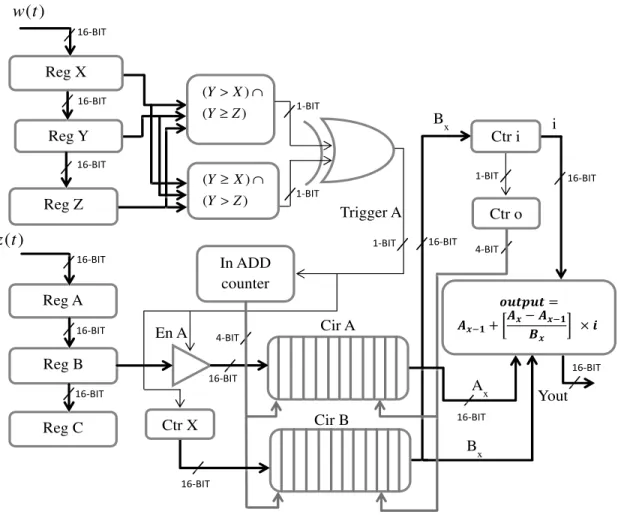
Fig. 3 Block diagram showing the processes of extrema identification and subsequent linear
saw tooth spline interpolation to obtain complex envelopes in the BEMD.
Fig. 3 shows the block diagram of the module responsible for the complex valued envelope computation. The input Yin is sent to the 16-bit buffer reg-isters Reg A, Reg B and Reg C, while the values of projections{wv(t)}Vv=1 (denoted by W in the figure) are sent to the buffer registersReg X, Reg Y
andReg Z; all the buffer registers are 16-bit wide. The values in each register
are shifted to the next register at every clock cycle; for instance, the current values ofYin andW would reach the Reg C and the registerReg Z in three clock cycles respectively.
To identify maxima locations and their corresponding values, the value in
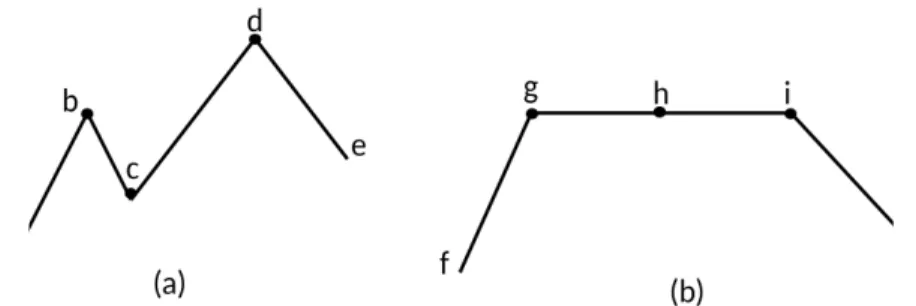
Fig. 4 Illustration of improved extrema detection scheme in the proposed architecture. (a) data series with all unequal extrema points; (b) data series including equal values (flat porions) at extrema locations.
blocks. Each comparator block utilises a maxima detection condition and a maxima is detected if any of the following two conditions is fulfilled:
1. The value in Reg Y is taken as maxima, if it is greater than or equal to the value in Reg X and greater than Reg Z, i.e. Y is maxima if Y ≥ X
andY > Z.
2. The value in Reg Y will also be taken as maxima if it is greater than the value inReg X, and greater than or equal to the value inReg Z, i.e.Y is a maxima ifY > X andY ≥Z.
In the proposed architecture, we include an improved exterma detection algorithm which, unlike the algorithm used in [8], can detect extrema points on flat signal portions. To illustrate the improvement of the proposed design over that in [8], consider two signals which are shown in Fig. 4. Both designs can identify extrema points ‘b’ and ‘d’ as maxima in the test signal shown in Fig. 4(a). However, the design in [8] fails to identify any maxima points in Fig. 4(b), due to the fact that signal extrema reside on flat signal porion. As a result, we observed that the architecture in [8] was not able to effectively decompose real world signals, as it tended to miss some important extrema points. To alleviate this problem, we have designed an architecture which is able to identify points ‘g’ and ‘i’ as maxima points in the test signal shown in Fig. 4(b).
The outputs of these comparator blocks are connected to the inputs of an XOR gate, which yields a logical high output, if any of the inputs are high. The output ofXORwill in turn trigger the following three modules:
1. It triggers the enable pin of a tri-state buffer En A, which will store the value inReg B (the value of the input signal corresponding to the projec-tion maxima) at the first locaprojec-tion of circular bufferCir A.
2. It triggers the counter Ctr X, which counts the number of clock cycles between two consecutive maxima. The value in the counterCtr Xis stored at the first location of circular buffer Cir B andCtr X is reset to zero. 3. Finally, it increments the input address counterIn ADD, which provides
These three tasks are performed sequentially. Therefore, whenever a projec-tion maxima is detected, the corresponding value of the input signal is stored
inCir Aand the interval between two consecutive maxima is stored inCir B
at the currentIn ADDcounter value.
The interpolation requires two maxima points for the continuous output computation of envelope. Therefore an initial delay ofdclock cycles is added, before the output computation so that at least two maxima points are stored in buffers Cir A and Cir B, prior to envelope computation. The value of d should be selected, such that it is larger than any of the value stored inCir B (the largest interval between any two successive maxima).
Moreover, while selecting the value of d, the length of the circular buffers should also be kept in mind, as very large values ofdmay result in overwrit-ing the circular buffers. A larger value of d allows for a longer time span, a larger delay, and better adaptability; however, more hardware resources are consumed as a result. If the signal under study has fewer extrema points, the value ofd should be changed accordingly, as the maximum interval between the two consecutive maxima or minima must be less the chosen value ofd. In the work presented here, the value ofd= 40 was found to be a good estimate. For envelope estimation, the values of Cir A and Cir B at the current output address provided byCtr o are copied to the envelope compute block as shown in Fig. 3. The value of counter Ctr i is incremented every clock cycle and it is reset whenever the value ofi is one less than the value at the current address of Cir B i.e. i = 0 if i = (Bx−1). At the same time, the value of output address counter Ctr o is incremented and the values at the next locations ofCir A andCir B are copied to the envelope compute block for local mean estimation.
Due to the initial delay of dclock cycles plus some computational delay, the output of envelope lags the input. The compute block computes the output after every clock cycle utilising the following relation in accordance with the saw tooth complex interpolation of the maxima points:
yout =Ax−1+
(Ax−Ax−1)×i
Bx
(4) where x is the current output address, while Ax, Ax−1 and Bx denote the values of circular buffersCir AandCir Bat their respective addresses in the subscript. When the output address counter Ctr o is incremented to x+ 1, the values of Cir A andCir B at the addressx−1 are cleared. In this way data is continuously relayed to the complex envelope estimation block, maxima points are stored, the envelope is computed continuously and maxima points are cleared.
The value of S = 5 is employed for the stopping criteria employed in the proposed BEMD architecture; therefore, the output of every 5th iteration is an IMF, that is, each IMF block is comprised of 5 iteration blocks. The IMF is subtracted from the delayed input and the residue becomes the input of next IMF block. The proposed architecture decomposed a complex valued input signals into two IMFs and a residue. To obtain more than two IMFs using this
architecture, more IMF-computing blocks can be easily added to the hardware architecture.
5 Results and Analysis
The prototype implementation of the proposed BEMD computation architec-ture was done on Xilinx FPGA (XC7K480T) using Verilog. The verilog code was synthesized using ISE Xilinx 14.1 and post synthesis simulation results are shown in the following figures. The prototype implementation consisted of two IMF blocks, thereby decomposing a complex input signal into two complex IMFs (h1 and h2) and the residuer. In the experiments presented below, the decomposition of the input signals was performed by usingV = 8 directions, and S = 5 iterations were used to extract the individual components. The sampling frequency was set to 25 MHz. The input data is first normalized and rounded off to the nearest integers before being processed.
5.1 Case Study 1: Decomposition of Synthetic Data
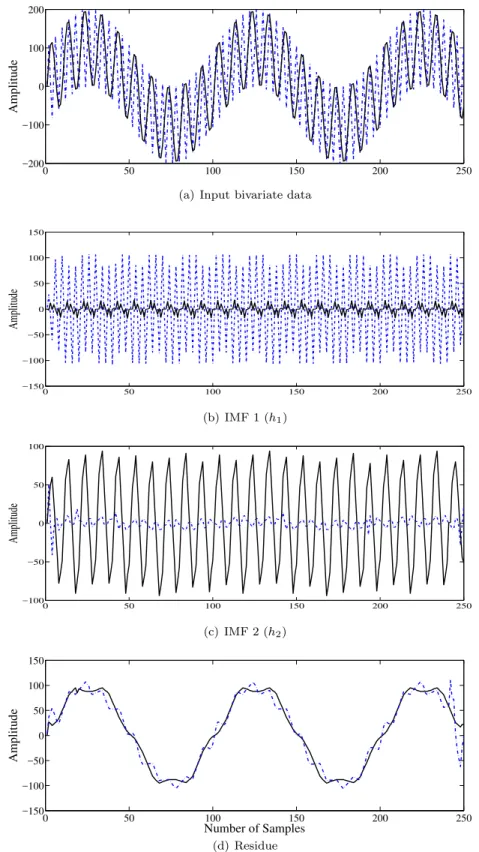
This FPGA based BEMD implementation was evaluated by decomposing a synthetic complex (bivariate) signal consisting of a combination of sinusoidal components: the real component was composed of sinusoids of frequencies 100 kHz and 2500 kHz, whereas the imaginary part of the signal consisted of 1000 kHz and 100 kHz tones.N = 250 samples of the bivariate signal were taken and customisedS = 5 iterations were used to extract each IMF.V = 8 direction vectors were employed within BEMD to estimate the local mean.
The input signal used in the experiment is shown in the top row of Fig. 5 along with the decomposed IMFs in the subsequent rows. It can be noticed from the decomposition that the highest frequency sinusoid (2500 KHz) is ex-tracted in the real component of the first IMF, while the corresponding imagi-nary IMF has negligible power. Similarly, the 1000 KHz tone is decomposed in the imaginary part of the second IMF, with the corresponding real IMF almost equal to zero. The 100 KHz sinusoid which is present in both channels of the input signal is extracted in the final decomposition (IMF) of both components as expected. The decomposition obtained from our hardware implementation, therefore, follows the mode alignment property of BEMD [17], which is vital for its use in data fusion applications [19].
The quantitative performance of the proposed implementation was estab-lished in decomposing the above signal by computing the correlation between the extracted IMFs and the original tones constituting the input. For the tones of frequencies 2500 KHz, 1000 KHz and 100 KHz respectively, the correspond-ing (normalised) correlation values are 0.99, 0.98, 0.99 (real part) and 0.98 (imaginary part), illustrating the high accuracy of the obtained decomposi-tion.
0 50 100 150 200 250 −200 −100 0 100 200 Amplitude
(a) Input bivariate data
0 50 100 150 200 250 −150 −100 −50 0 50 100 150 Amplitude (b) IMF 1 (h1) 0 50 100 150 200 250 −100 −50 0 50 100 Amplitude (c) IMF 2 (h2) 0 50 100 150 200 250 −150 −100 −50 0 50 100 150 Number of Samples Amplitude (d) Residue
Fig. 5 Decomposition of a synthetic complex/bivariate signal consisting of a combination of
sinusoids in its real (shown in black) and imaginary (dashed blue) components via proposed FPGA based BEMD implementation. Note that the individual sinusoidal components have been extracted accurately in both sets (real and imaginary) IMFs while exhibiting mode alignment which is a hallmark of BEMD decompositions.
0 50 100 150 200 250 300 350 400 450 500 −300 −200 −100 0 100 200 300 Distance (km) −200 −150 −100 −50 0 50 100 150 200 250 −300 −200 −100 0 100 200 300 Distance North (km) 0 50 100 150 200 250 300 350 400 450 500 −30 −20 −10 0 10 20 30 Distance (km) −25 −20 −15 −10 −5 0 5 10 15 20 25 −30 −20 −10 0 10 20 30 0 50 100 150 200 250 300 350 400 450 500 −20 −10 0 10 20 Time (days) Distance (km) −20 −15 −10 −5 0 5 10 15 20 −20 −10 0 10 20 Distance East (km)
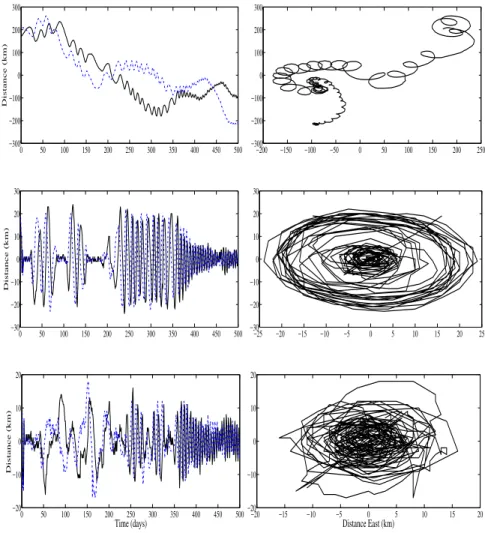
Fig. 6 Decomposition of a complex data of a position record of a subsurface oceanographic
Floatto (top row) into two IMFs (shown in the subsequent rows) via proposed FPGA based BEMD. Note that the IMFs are composed of rotational components (shown in the right column) in accordance with the rationale of the method. The real and imaginary components of the data represent displacements (km) in eastern and northern directions.
5.2 Case Study 2: Decomposition of Real-world Float Data
The performance of the proposed architecture was validated on a real world bivariate data of position records of a subsurface oceanographic float, which tracked the currents of salty water flowing out from the Mediterranean Sea during the Eastern Basin experiment [20]. The original bivariate data is shown in the top row of Fig. 6 in 2D space (left) along with the plots of two individual data channels (right). The decomposition of the bivariate data obtained from our proposed system is also shown in Fig. 6, as plots ofh1andh2(middle rows);
−10 −5 0 5 10 Heavy Sine Amplitude −10 −5 0 5 10 Float data Amplitude 0 250 500 −6 −4 −2 0 2 4 6 Number of Samples Denoised Heavy Sine
Amplitude 0 250 500 −10 −5 0 5 10 Number of Samples Denoised Float Amplitude
Fig. 7 Online signal denoising using BEMD: (Top row) Original signals (thick black line)
along with their noisy versions (shown in lighter shade). (Bottom row) Corresponding de-noised signals using the proposed architecture.
the residue r is shown in the last row. It can be noticed that the proposed system is able to extract the first two IMFs effectively with faster rotations in the input being decomposed in h1 and subsequent slower rotations being extracted inh2andr. The plot of the residuer, however, shows that there are still few oscillations left in the signal to be recovered, which can be obtained by using additional IMF computing blocks. Note that, unlike in the case of utilising a synthetic signal in the case study 1, true IMFs are not available here, as a result of which a rigorous validation regarding the quality of extracted IMFs is not possible.
5.3 Case Study 3: Online Bivariate Signal Denoising
Denoising refers to the process of removing unwanted noise from input data and is considered as a preliminary step in many practical 1D and 2D (image) signal processing applications. EMD, being a fully data driven method, has been employed successfully in signal denoising problems [7]. The rationale behind the EMD based denoising is the partial reconstruction of relevant EMD components (modes) based on some suitable criteria. Based on that principle,
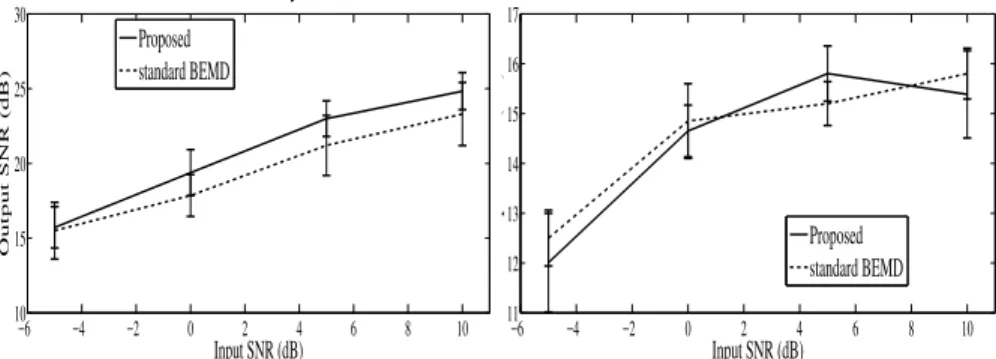
−6 −4 −2 0 2 4 6 8 10 10 15 20 25 30 Input SNR (dB)
Denoised Heavy Sine
Output SNR (dB) Proposed standard BEMD −6 −4 −2 0 2 4 6 8 10 11 12 13 14 15 16 17 Input SNR (dB)
Denoised Float
Output SNR (dB) Proposed standard BEMDFig. 8 Error bars showing repeated simulation results obtained from applying the proposed
online and standard BEMD based denoising methods on input signal channelsx(t) andy(t).
we employ the proposed architecture to demonstrate the potential of BEMD in online bivariate signal denoising. It is, however, important to emphasize that unlike existing standard EMD denoising algorithms which operate on a single input, we present anonline denoising application based on BEMD.
The input complex signal z(t) =x(t) +ıy(t) in our case was composed of two channels: x(t) was a standard ‘Heavy sine’ data set whereas y(t) was a segment of real world float data used in the previous section. The input data set is shown in Fig. 7 (top row) in thick black lines along with their noisy version (in lighter color), corresponding to the input signal to noise ratio (SNR) of SN R=10dB. The input signal was denoised after removing the first two IMFs obtained from the proposed architecture. The denoised signals are shown in the bottom row of Fig. 7. Note that the output signal exhibits similarity with the reference input signals.
We further tested this online denoising strategy on noisyz(t) for the range of values of input signalSN R=−5 dB to 10dB. The experiments involved K= 500 noisy realisations of the input test signals. Fig. 8 shows the plots, in the form of error bars, of the output signal SN R for the two channels, cor-responding to the whole range of inputSN R. In addition to the results from the proposed architecture, the figure also shows the error bars of denoised signals obtained from standard BEMD algorithm [21]. Note that despite the online nature of the proposed architecture, its performance can be considered as comparable to the standard BEMD which employs computationally expen-sive spline interpolation and also processes the whole input data as a single input.
5.4 Resource Utilisation and Timing Results
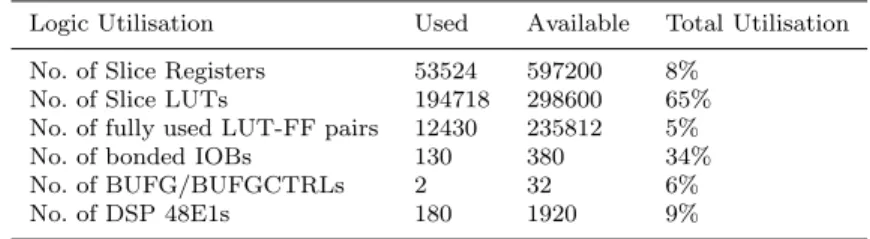
Table 1 shows the device utilisation summary of the synthesized Verilog code for KINTEX 7, XC7K480T FPGA. The table shows that a significant number of slice look up tables (LUT) were utlised by this hardware implementation.
Table 1 Device utilisation summary for prototype implementation of BEMD on Xilinx KINTEX (Kintex 7, XCK480T FPGA)
Logic Utilisation Used Available Total Utilisation No. of Slice Registers 53524 597200 8%
No. of Slice LUTs 194718 298600 65% No. of fully used LUT-FF pairs 12430 235812 5% No. of bonded IOBs 130 380 34% No. of BUFG/BUFGCTRLs 2 32 6%
No. of DSP 48E1s 180 1920 9%
Table 2 Timing Details of the proposed hardware architecture
Proposed design Sampling Frequency / Clock Rate 25 MHz Initial Delay for single iteration 1.6µs Computational Delay for single iteration 0.2µs Computation Time for IMF1 / 1000 samples 49.2µs Computation Time for IMF2 / 1000 samples 58.4µs Computation Time for residue / 1000 samples 58.4µs Overall Data Throughput 261.28 Mbps
From 65% utilised slice LUTs, only 1% are used as memory, while the remain-ing 64% are used for logic development. Moreover, only 5% of LUT flipflops (LUT-FF) pairs are utilised fully by the implemented hardware architecture, whereas there are 77% LUT-FF pairs with unused flip flops and 17% with unused LUT.
Table 2 presents the timing details of the proposed system. According to the Table 2, the proposed system can process the bivariate signals with a maximum clock rate of 25 MHz. There was an initial delay of 9.4µsbetween the input signal and the first IMF h1, while a delay of 18.6 µs was observed between the second IMF h2, residue r and the input signal. The proposed system exhibits a data throughput of 261.28 Mbps, as it required 58.4µs to perform the complete decomposition of input signal intoh1,h2, andrfor 1000 data samples. The setup time (minimum amount of time the signal should be held constant before the clock edge so that the data is reliably managed by the clock) was observed to be 39.068 ns, while the clock-to-output delay (the worst case time it takes for a signal to propagate out after the clock edge) was found to be 0.687 ns for the proposed architecture. The minimum period allowed was therefore 39.180 ns.
Moreover, the proposed system exhibits effective thermal resistance of 1.9 C/W, a junction temperature of 25.2 C and maximum Ambient of 84.8 C. The Overall system consumes 122.16 mW of supply power.
Notice that a large chunk of resources in the proposed architecture are utilised for implementing computationally expensive logic modules, including extrema detection, computing multiple signal projections, and saw tooth inter-polation to generate envelopes. On the other hand, owing to the online nature
of the architecture, only a few resources are required for operations involving memory, such as, for saving extrema locations and their values for saw tooth interpolation process.
6 Discussion and Conclusions
Empirical mode decomposition and its multivariate extensions have recently become very popular within signal processing, image processing and biomedi-cal signal processing community. The BEMD, in particular, has found numer-ous applications in biomedical engineering and signal processing applications, which involve multiple data channels. For instance, BEMD has been success-fully employed for the time-frequency analysis of EEG asymmetry [16], image fusion [1] [17], fault diagnosis of rotating machinery [12], ECG pattern analysis for emotion detection [2] and resolving non-stationary spectral information in wind speed time series using the Hilbert-Huang transform [23].
We have proposed a parallel architecture for the real-time implementation of bivariate empirical mode decomposition (BEMD) algorithm on FPGA. The work is highly relevant since BEMD, which extends the EMD operation for complex bivariate data, demands significantly higher computational resources than those required for the standard EMD operation. Despite the growing interest of BEMD in aforementioned applications, no real-time online hardware implementation of the algorithm currently exists, thus, prohibiting its use in real-time applications hard to materialize.
The key idea in our architecture is the parallel computation of multiple complex envelopes that are averaged to find the local mean of input signal. Furthermore, the computation of real-valued projections from complex signal and subsequent local extrema detection process on those projections is also optimised in our architecture. As a result, the architecture has been shown to operate in real-time with significant speed, moreover, it supports sampling frequency of up to 25 MHz. These results have been obtained for both synthetic and real world bivariate signals and demonstrate the potential of the proposed architecture for real-time computation of multichannel EMD.
In contrast to the original formulation of EMD algorithm and its multi-variate extensions, which are offline or batch processing techniques, our work focuses on an online hardware implementation of BEMD. Due to the online and real-time nature of the proposed system, we faced several challenging de-sign constraints, which led us to employ a saw tooth interpolation scheme [13] in our architecture. The main reasons for using such an interpolation scheme in our work are as follows:
1. Instead of batch processing, as with the off-line variant of EMD and BEMD, where the whole chunk of input data is available for processing, the data is sent to our system online and that data needs to be processed in real-time. As a result, at a given time, we only use two extrema locations to compute the local mean in this architecture. We have found that a simple saw tooth interpolation is more effective in this scenario, yielding better
0 5 10 15 20 25 30 35 40 −8 −6 −4 −2 0 2 4 6 8 10 Number of samples Amplitude input envelopes (spline) local mean (spline) envelopes (sawtooth) local mean (sawtooth)
Fig. 9 Sawtooth interpolation vs cubic spline interpolation for a signal involving small
number of extrema: Note that the local mean estimate from sawtooth interpolation is more accurate as compared to that obtained from cubic spline interpolation. The main reason is the tendency of cubic spline interpolation to introduce ‘end effects’ at the start and end of a signal.
estimates of local mean as compared to spline interpolation. The local mean estimation using both saw tooth and cubic spline interpolation schemes is presented in Fig. 9, where two maxima points and two minima points are used for interpolation. It can be seen that the saw tooth interpolation works effectively in this scenario involving very few extrema points, and that the saw tooth interpolation method yields very accurate local mean estimates. One can also observe few artifacts due to end effects appearing in the envelopes obtained from the spline interpolation, which were not present in the case of saw tooth interpolation.
2. The proposed method, owing to its architecture, performs the EMD oper-ation on small windows of input data, which is expected to aggravate the problem of ‘end effects’ in the resulting decomposition as compared to orig-inal formulations of EMD. Saw tooth interpolation is less prone to the ‘end effects’ as compared to spline interpolation and is therefore more suitable in our design. It is evident in Fig. 9, where the overshoot of the upper and undershoot of lower envelopes computed from spline interpolation can be seen at the start and end of input signal. However, the envelopes computed from saw tooth interpolation are smooth and linear.
3. Cubic spline interpolation is computationally expensive; in fact, the com-putation of a local mean via spline interpolation is by far the most compu-tationally extensive task in EMD computation. Therefore, for the real-time online implementation of EMD, employing a simple yet effective interpo-lation scheme is more suitable.
It is important to note that the prime parameters of the proposed system, i.e. number of iterations per IMFS, number of real-valued projectionsV and the value of initial delaydare set experimentally, depending upon the nature
of input complex signal as well as the amount of resources available. To be more specific, the value ofS andddepends upon the nature of input signal, i.e. the maximum interval between the subsequent extrema points should be less than the value of d, while the number of projections V determine the accuracy of the decomposed IMFs. The greater the number of projections, more accurate the decomposed IMFs will be, however, more resources will be consumed. Therefore, V = 8 seemed to be a suitable tradeoff between the accuracy of decomposed IMFs and the amount of resources consumed. The efficiency of proposed BEMD system cannot be guaranteed if it is implemented on an FPGA with a different Configurable Logic Block (CLB) or DSP slice architecture though it can be reconfigured on any FPGA belonging to 6 or 7 Series FPGA by Xilinx family. In addition, the system needs to be redesigned if the type of interpolation scheme or division algorithm is altered. The proposed architecture however caters for univariate or single channel data as a special case when the imaginary component of the input complex signal is set to zero. The proposed architecture aims to implement BEMD online in real-time, if operated on small chunks (windows) of input data, thus aggravating the so called ‘end-effect’ issue within the BEMD. While this problem is partially addressed by employing sawtooth interpolation as the replacement of cubic spline interpolation, a more permanent solution is still required. Future di-rections of research include the development of mechanism to suppress end effects from the BEMD decompositions and to extend the architecture for general multivariate signals containing any number of input channels.
References
1. U. Abdullah, N. Rehman, M. Khan, and D. P. Mandic, “A multivariate EMD based approach to Pan-sharpening”, IEEE Transactions in Geoscience and Remote Sensing, vol. 53, no. 7, pp. 3974-3984, 2015.
2. F. Agrafioti, D. Hatzinakos, and A. K. Anderson, “ECG pattern analysis for emotion detection IEEE Transactions on Affective Computing, vol. 3, pp. 102-115, 2012. 3. M. U. Altaf, T. Gautama, T. Tanaka, and D. P. Mandic, “Rotation invariant complex
empirical mode decomposition,”in Proceedings of the IEEE International Conference on Acoustics, Speech, Signal Processing, 2007.
4. L. W. Chang, M. Lo, N. Anssari, K. Hsu, N. E. Huang, W. W. Hwu, “Parallel implemen-tation of multidimensional ensemble empirical mode decomposition,”IEEE International Conference on Acoustics, Speech and Signal Processing (ICASSP), 2011, pp. 1621-1624, Prague.
5. D. Chen, D. Li, M. Xiang, H. Bao, and X. Li, “GPGPU-Aided Ensemble Empirical Mode Decomposition for EEG Analysis during Anaesthesia,”IEEE Transactions on Information Technology in Biomedicine, vol. 14, no. 6, pp. 1417-1427, 2010.
6. P. Flandrin, Empirical Mode Decomposition, accessed May 2015, http://perso.ens-lyon.fr/patrick.flandrin/emd.html.
7. P. Flandrin, P. Gonalvs, and G. Rilling, “Detrending and Denoising with Empirical Mode Decompositions”, in Proceedings of the European Signal Processing Conference (EUSIPCO), Vienna, Austria, pp. 1581-1584, 2004.
8. Y. Y. Hong and Y. Q. Bao, “FPGA Implementation for Real-Time Empirical Mode DecompositionIEEE Transactions on Instrumentation and Measurement, vol. 61, no. 12, pp. 3175-3185, 2012.
9. N. E. Huang, M. C. Wu, S. R. Long, S. S. P. Shen, W. Qu, P. Gloersen and K. L. Fan, “A confidence limit for the empirical mode decomposition and Hilbert spectrum analysis,” Proceedings of the Royal Society A, vol. 459, no. 2037, pp. 2317-2345, 2003.
10. N. E. Huang, Z. Shen, S. R. Long, M. L. Wu, H. H. Shih, Z. Quanan, N. C. Yen, C. C. Tung, and H. H. Liu, “The empirical mode decomposition and the Hilbert spectrum for nonlinear and non-stationary time series analysis”,Proceedings of the Royal Society A, vol. 454, pp. 903–995, 1998.
11. M. H. Lee, K. K. Shyu, P. L. Lee, C. M. Huang, and Y. J. Chiu, “Hardware Implemen-tation of EMD Using DSP and FPGA for Online Signal Processing,”IEEE Transactions on Industrial Electronics, vol. 58, no. 6, pp. 2473-2481, 2011.
12. Y. Lei, J. Lin, Z. He, M and J. Zuo, “A review on empirical mode decomposition in fault diagnosis of rotating machinery Mechanical Systems and Signal Processing, vol. 35, no. 1, pp. 108-126, 2013.
13. L. Y. Lu, “Fast intrinsic mode decomposition of time series data with sawtooth trans-form,”ORACLE, Redwood Shores, CA, pp. 1-13, Nov. 2007, Tech. Rep.
14. D. P. Mandic, N. Rehman, Z. Wu, and N. E. Huang “Empirical Mode Decomposition-Based Time-Frequency Analysis of Multivariate Signals: The Power of Adaptive Data Analysis”,IEEE Signal Processing Magazine,vol. 30, no. 6, pp. 74-86, 2013.
15. C. Park, D. Looney, N. Rehman and D. P. Mandic, “Motor Imagery Signal Classifica-tion using Multivariate Empirical Mode DecomposiClassifica-tion”,IEEE Transactions on Neural Systems and Rehabilitation Engineering, vol. 21, no. 1, pp. 10-22, 2013.
16. C. Park, D. Looney, P. Kidmose, M. Ungstrup, and D.P. Mandic, “Time-frequency analysis of EEG asymmetry using bivariate empirical mode decomposition,” IEEE Trans-actions on Neural Systems and Rehabilitation Engineering, vol. 19, no. 4, pp. 366-373, 2011.
17. N. Rehman, S. Ehsan, S. M. U. Abdullah, M. J. Akhtar, D. P. Mandic and K. D. McDonald-Maier, “Multi-scale pixel-based image fusion using multivariate empirical mode decomposition,”Sensors,vol. 15, no. 5, pp. 10923-10947, 2015.
18. N. Rehman and D. P. Mandic, “Multivariate empirical mode decomposition,” Proceed-ings of the Royal Society A, vol. 466, no. 2117, pp. 1291-1302, 2010.
19. N. Rehman, D. Looney, T. M. Rutkowski, and D. P. Mandic, “Bivariate EMD-based Im-age Fusion,”Proceedings of the IEEE Workshop on Statistical Signal Processing,Cardiff, 2009.
20. P. Richardson, D. Walsh, L. Armi, M. Schroder, and J. F. Price, “Tracking three Meddies with SOFAR floats,”Journal of Physical Oceanography, vol. 19, pp. 371-383, 1989. 21. G. Rilling, P. Flandrin, P. Goncalves, and J. M. Lilly, “Bivariate empirical mode
de-composition,”IEEE Signal Processing Letters, vol. 14, pp. 936-939, 2007.
22. T. Tanaka and D. P. Mandic, “Complex empirical mode decomposition,”IEEE Signal Processing Letters, vol. 14, no. 2, pp. 101-104, 2006.
23. C. L. Vincent, G. Giebel, P. Pinson, and H. Madsen, “Resolving nonstationary spectral information in windeed time series using the Hilbert-Huang transformJournal of Applied Meteorology and Climatology, vol. 49, pp. 253-267, 2010.
24. L. Wang, M. I. Vai, P. U. Mak, and C. I. Ieon, “Hardware-accelerated implementation of EMD,” Proceedings of the 3rd International Conference in Biomedical Engineering Information, vol. 2, pp. 912-915, 2010.
25. P. Waskito, S. Miwa, Y. Mitsukura, H. Nakajo, “Parallelizing Hilbert-Huang Transform on a GPU,”First International Conference on Networking and Computing (ICNC), Nov. 2010, pp. 184-190, Higashi-Hiroshima.
26. X. Zhao, T. H. Patel, and M. J. Zuo, “Multivariate EMD and full spectrum based condition monitoring for rotating machinery,”Mechanical Systems and Signal Processing, vol. 27, pp. 712-728, 2012.