Procedia - Social and Behavioral Sciences 102 ( 2013 ) 622 – 626
1877-0428 © 2013 The Authors. Published by Elsevier Ltd. Open access under CC BY-NC-ND license.
Selection and/or peer-review under responsibility of Professor Dr Mohd. Zaidi Omar, Associate Professor Dr Ruhizan Mohammad Yasin, Dr Roszilah Hamid, Dr Norngainy Mohd. Tawil, Associate Professor Dr Wan Kamal Mujani, Associate Professor Dr Effandi Zakaria. doi: 10.1016/j.sbspro.2013.10.779
ScienceDirect
6th International Forum on Engineering Education (IFEE 2012)
Effectiveness of early evaluation test as a method for
identification of problematic students
Noorfazila Kamal
a,*, Norhana Arsad
a,b, Hafizah Husain
a,b, Afida Ayob
a,b aDepartment of Electrical, Electronic & System Engineering,b Centre for Engineering Education Research
Faculty of Engineering & Built Environment, Universiti Kebangsaan Malaysia, 43600 UKM Bangi, Selangor, Malaysia
Abstract
as become an issue of great concern to university educators. An early detection of problematic students can help the educators to monitor and improve the student performance. Previously, we propose a method to identify problematic student via an early evaluation test. In this work, we measure the effectiveness of the early evaluation test method. The students performance are monitored for three semesters, and their results are compared to the early evaluation test results. This study shows that only six out of 48 students are out from the early prediction, which gives the method 87.5% in accuracy.
© 2013 The Authors. Published by Elsevier Ltd.
Selection and/or peer-review under responsibility of Mohd Zaidi Omar, Ruhizan Mohammad Yasin, Roszilah Hamid, Norngainy Mohd. Tawil, Kamaruzaman Yusoff, Mohamad Sattar Rasul
Keywords: Early evaluation test; problematic students; grade point average (GPA);
1. Introduction
The achievements of students from the Department of Electrical, Electronic and Systems Engineering (JKEES) is on the decline and some students have been disqualified from their degree program as a result to such performance [1]. Furthermore, a number of students from JKEES who obtain CGPA (Cummulative Grade Point
*Corresponding author. Tel.: +603-89216320
E-mail address: [email protected], [email protected]
© 2013 The Authors. Published by Elsevier Ltd. Open access under CC BY-NC-ND license.
Selection and/or peer-review under responsibility of Professor Dr Mohd. Zaidi Omar, Associate Professor Dr Ruhizan Mohammad Yasin, Dr Roszilah Hamid, Dr Norngainy Mohd. Tawil, Associate Professor Dr Wan Kamal Mujani, Associate Professor Dr Effandi Zakaria.
Average) less than 3.00 are increasing. This issue has raised concern to the department. Such a phenomenon is not supposed to happen as the students comprise of those who used to obtain excellent results during the pre-university and secondary school stages. Additionally, the student selection scheme predetermined by the university requires results that are highly qualified, not only in the academic field but also in the area of co-curriculum.
The issue of poor academic performance among university students is a serious issue because of the high hopes put on university students by the community, that the students be individuals who are knowledgeable and are able to tackle current societal problems [2]. Therefore, we proposed a method to identify problematic students at early stage of study [3]. Identification of problematic students at early stage can helps mentors to monitor the The proposed method in the previous work requires results from the early evaluation test and the first semester. In this work, we measure the effectiveness of the early evaluation test method by comparing the and semester 1.
2.Methodology
In the previous work, a method for identification of problematic student at the early stage of study has been done [3]. The identification is based on results from early evaluation test and semester 1. The first year students in batch 2011/2012 were given an early evaluation test. The early evaluation test contains ten questions, which include mathematics, basic engineering and English knowledge. Figure 1 shows the early evaluation test question. Each question carries one mark, which gives the total marks of ten. The studen
problematic students. Based on these results, students are classified into four groups, namely A, B, C and D as shown in Table 1. Group A represents students who can really adapt themselves, Group B: students who are able to adapt themselves, Group C: students who have problems in adjusting themselves and Group D: students who are really problematic.
fication based on early evaluation test and semester 1 result
Group GPA early evaluation test GPA semester 1 Performance level Number of students
A
Students who are really able to adapt themselves to the learning
environment
17
B < 3 Students who can adapt themselves 4 C < 3 Students find it a problem to adapt
themselves 4 D < 3 < 3 Students who are very problematic 23
Fig.1. Early evaluation test questions
In this work, we measure the effectiveness of the early evaluation test as a method to identify problematic to these results, students are classified into four groups. Then, number of student in each group is compared to number of students in Table 1.
3.Results
Students are classified into four groups according to their early evaluation test result and semester results. Three semester results are obtained in order to measure the effectiveness of early evaluation test as the problematic student identification method. Table 2 shows the number of student in group A, B, C and D, and Figure 2 shows group A and C student results for early evaluation test, semester 1, 2 and 3.
Table 2. Stude
Group early evaluation
test GPA semester GPA
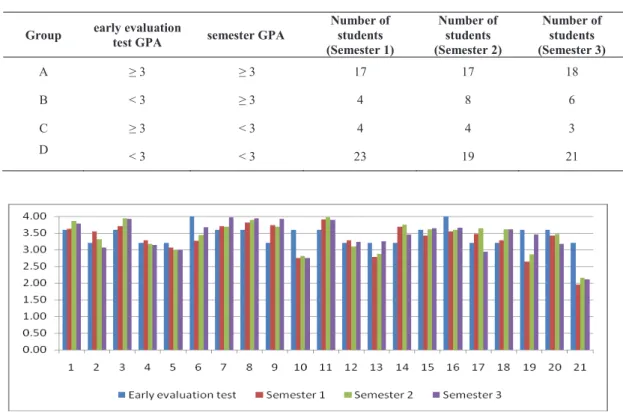
Number of students (Semester 1) Number of students (Semester 2) Number of students (Semester 3) A 17 17 18 B < 3 4 8 6 C < 3 4 4 3 D < 3 < 3 23 19 21
Fig. 2. The early evaluation test and semester results for students in group A and C, which their early evaluation test GPA is equal or greater than 3.0.
As shown in Figure 2, total number of student in group A and C (where their entry evaluation test GPA is equal or greater than 3.0) is 21. Each student is represented as a number. In the first semester, 17 students manage to achieve GPA equal or greater than 3.0, which is classified into group A, while 4 students (represented as number 10, 13, 19 and 21) get GPA less than 3.0, and classified into group C. In semester 2, the students in group A and C remains the same. However in semester 3, student number 17 drops his/her performance, while students number 13 and 19 increase their performance, resulting changes in number of student in group A and C. Therefore, only three out of 21 students are out of their early prediction.
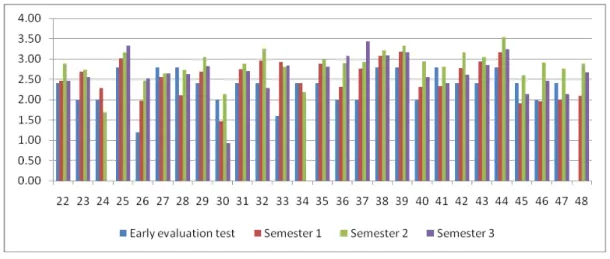
Figure 3 shows group B and D student results for early evaluation test, semester 1, 2 and 3. There are 27 students in this group. In the first semester, only four students are classified into group B, and 23 students are in group D. However, this number changes in the second semester, where four students from group D (student number 29, 38, 39 and 44) improve their performance and goes to group B. Therefore, in semester 2, the total number of students in group B increases to eight, and students in group D decrease to 19. In the third semester, the four students that improve their performance in the second semester (student number 29, 38, 39 and 44), dropped their GPA to less than 3.0. Meanwhile, two students (student number 36 and 37) improve their GPA to greater than 3.0. Therefore, in the third semester, group B contains six students and group D contains 21 students. From 27 students in group B and D, only six students changes between group B and D in three semesters, while others are remain in their group as expected from the early evaluation test method.
Fig. 3. The early evaluation test and semester results for students in group B and D, which their early evaluation test GPA is less than 3.0. 4.Conclusion
Early evaluation test was used as a method to identify problematic students at the early stage of study. Based are monitored in semester 2 and 3, and they are grouped according to their results. When compared to the previous grouping, which is based on early evaluation test and semester 1 results, there are only six out of 48 students involved in group changes in three semesters. Therefore, the early evaluation test is an effective method to identify problematic students at the early stage of study.
Acknowledgements
This research is funded by Universiti Kebangsaan Malaysia (UKM) under Action Research Grant for funding this research (PTS-2012-102). The authors would like to thank the committees of JPPel (Jawatankuasa Pembangunan Pelajar) JKEES.
References
[1] Hafizah, H., Norbahiah, M., Norhana, A., Wan Mimi Diyana, W.Z., & Sarifah Nurhanum, S.S. Analisis Kuantitatif Pencapaian
Akademik Pelajar JKEES. 2011
[2] Norhani Bakri, Noor Zainab Abd Razak, Hamidah Ab Rahman dan Aminah Hj Ahmad Khalid. Punca Prestasi Pembelajaran Yang Lemah Di kalangan Pelajar Fakulti Pengurusan dan Pembangunan Sumber Manusia, UTM, Jurnal Teknologi. UTM. 2005, 43(E):29-44
[3] Norhana Arsad, Noorfazila Kamal, Afida Ayob, Sarzliana Soaidin & Hafizah Husain. The Development of a Method for the Identification of Problematic Students during the Initial Stage of Study. Asian Social Science, 2012, 8(16):209-214.