Database for Baghdad Soil Using GIS Techniques
Balqees Abdulwahid Ahmed
Asmaa Younus Yahya
Athraa Hashim Mohammed
[email protected] Lecturer
com . yahoo @ 2004 asmayounis Lecturer
com . yahoo @ 2004 athraram Lecturer
Civil Engineering Dept., College of Engineering, University of Baghdad, Iraq.
Abstract
In this paper, assessing underground conditions and the engineering properties of the various strata of fourteen sites Baghdad are made. The sites are divided into two groups, one in Karkh and the other in Rusafa. Assessing the underground conditions can be occurred by drilling vertical holes called exploratory boring into the ground, obtaining soil (disturbed and undisturbed) samples, and testing these samples in a laboratory (civil engineering laboratory /University of Baghdad). From disturbed, the tests involved the grain size analysis and then classified the soil, Atterberg limit, chemical test (organic content, sulphate content, gypsum content and chloride content). From undisturbed samples, the test involved the consolidation test (from this test, the following parameters can be obtained: initial void ratio eo, compression index cc, swelling index cs , coefficient of consolidation cv , coefficient of volume change mv, maximum preconsolidation stress Pc,Effective overburden pressure Po )and shear test (the following parameters can be obtained: undrained cohesion cu, angle of friction φ.
In-situ testing was carried out by the standard penetration test in order to obtain the penetration resistance of the soil strata in a bore hole.
Database for Baghdad soils is made using different GIS techniques connecting the spatial locations of those soils with their properties (ِAtterberg Limits, Specific Gravity, Grain size Analysis, Shear Strength parameters, Consolidation parameters), Borehole log, Site profile using the attribute tables, hyperlinks, metadata and SQL (System Query Language), so GIS techniques give the facilities for adding, editing and analyzing the existing data as well as the any future data of Baghdad soils.
Keywords:Properties, Baghdad, soil, GIS, attribute table, hyperlinks, metadata.
ةﺪﻋﺎﻗ
ﻟا
ﺘﻟ
تﺎﻧﺎﻴﺒ
ﺔﻴﻓاﺮﻐﺠﻟا
تﺎﻣﻮﻠﻌﻤﻟا
ﻢﻈﻧ
ماﺪﺨﺘﺳﺎﺑ
داﺪﻐﺑ
ﺔﺑﺮ
ﺪﻤﺤﻣﻢﺷﺎهءارﺬﻋ ﻰﻴﺤﻳﺲﻧﻮﻳءﺎﻤﺳأ ﺪﻤﺣاﺪﺣاﻮﻟاﺪﺒﻋﺲﻴﻘﻠﺑ سرﺪﻣ سرﺪﻣ سرﺪﻣ ﺔﺻﻼﺨﻟا : ﺔﺻﺎﺨﻟاﺔﺑﺮﺘﻟا تﺎﻘﺒﻄﻟﺔﻴﺳﺪﻨﻬﻟاصاﻮﺨﻟاﻢﻴﻴﻘﺗوﺔﺳاردﻢﺗ ،ﺔﻟﺎﻘﻤﻟاﻩﺬهﻲﻓ ﺔﻌﺑرﻻ ﻗﻮﻣﺮﺸﻋ ﺎﻌ داﺪﻐﺑﻲﻓ . ﻦﻴﺘﻋﻮﻤﺠﻣﻰﻟاﺖﻤﺴﻗﻊﻗاﻮﻤﻟا ﺣا اﺪ ﺔﻓﺎﺻﺮﻟاﻲﻓىﺮﺧﻻاوخﺮﻜﻟاﻲﻓﺎه . ﻰﻤﺴﺗﺔﻴﻟﻮﻗﺎﺷﺮﻔﺣﺮﻔﺤﺑثﺪﺣﻢﻴﻴﻘﺘﻟااﺬه ﺎﺑ ﺤﻟ ﺎﻬﻨﻣو،ضرﻻاﻲﻓﺔﻴﻓﺎﺸﻜﺘﺳﻻاﺮﻔ جذﺎﻤﻧﻰﻠﻋلﻮﺼﺤﻟاﻢﺗ ﻢﺛﻦﻣو،ﺔﻠﺨﻠﺨﻣﺮﻴﻏىﺮﺧاوﺔﻠﺨﻠﺨﻣ ﺎﻨﻳﺮﺟأ ﺎﻳﺮﺒﺘﺨﻣجذﺎﻤﻨﻟاﻩﺬهﺺﺤﻓ ) ﺮﺒﺘﺨﻣﻲﻓ ﺔﺳﺪﻨﻬﻟاﻢﺴﻗﻰﻟاﺪﺋﺎﻌﻟا ﻴﻧﺪﻤﻟا ﺔ / داﺪﻐﺑﺔﻌﻣﺎﺟ ( . ﻦﻣ ﺺﺤﻓ ﺔﻠﺨﻠﺨﻤﻟا جذﺎﻤﻨﻟا ،كﺮﻴﺑﺮﺗﻻا دوﺪﺣ ، ﺔﺑﺮﺘﻠﻟ ﻲﺒﻴﺒﺤﻟا جرﺪﺗ ﻰﻠﻋ لﻮﺼﺤﻟا ﻢﺗ ﺤﻔﻟا ﺔﻳوﺎﻴﻤﻴﻜﻟا صﻮ ) حﻼﻣا ىﻮﺘﺤﻣ ،ﺔﻳﻮﻀﻌﻟا داﻮﻤﻟا ىﻮﺘﺤﻣ ﺪﻳرﻮﻠﻜﻟاىﻮﺘﺤﻣوﺲﺒﺠﻟاىﻮﺘﺤﻣ،تﺎﺘﻳﺮﺒﻜﻟا ( جذﺎﻤﻨﻟاﺺﺤﻓﻦﻣو ﺔﻠﺨﻠﺨﻣﺮﻴﻏ مﺎﻤﻀﻧﻻاﺺﺤﻓﻢﻀﻳﻲﺘﻟاو ) ﻔﻟااﺬهﻦﻣ ﺮﺨﺘﺳاﻢﺗﺺﺤ جا ﺔﺒﺴﻧ اﺮﻔﻟا ﻏ طﺎﻐﻀﻧﻻاﺮﺷﺆﻣ،ﺔﻴﺋاﺪﺘﺑﻻاتﺎ ‘ ﺠﺤﻟاﺮﻴﻐﺘﻟاﻞﻣﺎﻌﻣ،مﺎﻤﻀﻧﻻا ﻞﻣﺎﻌﻣ،خﺎﻔﺘﻧﻻا ﺮﺷﺆﻣ لﺎﻌﻔﻟاﻞﻘﺜﻟاﻂﻐﺿ،ﻖﺒﺴﻣ دﺎﻬﺟاﻰﻠﻋا،ﻲﻤ ( ﺺﺤﻓو ﺺﻘﻟا ) ،لوﺰﺒﻣﺮﻴﻐﻟاﻚﺳﺎﻤﺘﻟاﻰﻠﻋلﻮﺼﺤﻟاﻢﺗﺺﺤﻔﻟااﺬهﻦﻣ كﺎﻜﺘﺣﻻاﺔﻳوازو ( . ﻢﺗﻊﻗﻮﻤﻟاﻲﻓ تﺎﻘﺒﻃقاﺮﺘﺧاﺔﻣوﺎﻘﻣﻰﻠﻋلﻮﺼﺤﻠﻟﻲﺳﺎﻴﻘﻟاقاﺮﺘﺧﻻاﺺﺤﻓ ﻲﻓﺔﺑﺮﺘﻟا ةﺮﻔﺤﻟا .
ﻞﻤﻋﻢﺗ ﺪﻘﻟ داﺪﻐﺑ ﺔﺑﺮﺘﻟتﺎﻧﺎﻴﺒﻟا ةﺪﻋﺎﻗ ﻌﻤﻟا ﻢﻈﻧماﺪﺨﺘﺳﺎﺑ ﻪﻟﻼﺧ ﻦﻣﻢﺗ يﺬﻟاوﺔﻴﻓاﺮﻐﺠﻟا تﺎﻣﻮﻠ ﻟا ﺔﻓﺎآو رﺎﺒﺘﺧﻻاﺮﻔﺤﻟﺔﻴﻧﺎﻜﻤﻟا ﻊﻗاﻮﻤﻟاﻦﻴﺑ ﻂﺑﺮ ﻌﻤﻟا ﻠ ﻦﻤﻀﺘﺗﻲﺘﻟاوﺔﺑﺮﺘﻟﺎﺑﺔﺻﺎﺨﻟاتﺎﻣﻮ ) مﺎﻤﻀﻧﻻاتﻼﻣﺎﻌﻣو،ﺺﻘﻟاىﻮﻗتﻼﻣﺎﻌﻣ،ﻲﺒﻴﺒﺤﻟاجرﺪﺘﻟا،ﻲﻋﻮﻨﻟانزﻮﻟا،كﺮﻴﺑﺮﺗﻻادوﺪﺣ ( ﺮﻔﺣو، ،ﺎﻬﺗﺎﻔﺻاﻮﻣوﺔﺑﺮﺘﻟاتﺎﻘﺒﻃﻞﺜﻤﺗﻲﺘﻟارﺎﺒﺘﺧﻻا ﻘﻣو ماﺪﺨﺘﺳﺎﺑضرﻻاتﺎﻘﺒﻄﻟﻊﻄ ﺔﻐﻟﺔﻴﻨﻘﺗوﺎﺘﻴﻤﻟاتﺎﻧﺎﻴﺑو،ﺔﻴﺒﻌﺸﺘﻟا تﺎﻃﺎﺒﺗرﻻا،ﺔﻴﺻﺎﺨﻟا لواﺪﺟ تﺎﻴﻧﺎﻜﻣﻻاوتﻼﻴﻬﺴﺘﻟا مﺪﻘﻳﺔﻴﻓاﺮﻐﺠﻟاتﺎﻣﻮﻠﻌﻤﻟامﺎﻈﻧنﺎﻓ اﺬﻬﻟو،مﺎﻈﻨﻟارﺎﺴﻔﺘﺳا ﻻ تﺎﻣﻮﻠﻌﻤﻟاوﺎﻴﻟﺎﺣةدﻮﺟﻮﻤﻟاتﺎﻣﻮﻠﻌﻤﻟاﻞﻴﻠﺤﺗوﻞﻳﺪﻌﺗوﺔﻓﺎﺿ داﺪﻐﺑﺔﺑﺮﺗﺺﺨﻳﺎﻣﻞﻜﻟﺔﻴﻠﺒﻘﺘﺴﻤﻟا . ﺔﻴﺴﻴﺋﺮﻟاتﺎﻤﻠﻜﻟا : ﺎﺘﻴﻤﻟاتﺎﻧﺎﻴﺑو،ﺔﻴﺒﻌﺸﺘﻟاتﺎﻃﺎﺒﺗرﻻا،ﺔﻴﺻﺎﺨﻟالوﺪﺟ ،ﺔﻴﻓاﺮﻐﺠﻟاتﺎﻣﻮﻠﻌﻤﻟاﻢﻈﻧ،ﺔﺑﺮﺗ،داﺪﻐﺑ،صاﻮﺨﻟا . Introduction
Engineers classify earth materials into two broad categories: rock and soil. Although both materials play an important role in foundation engineering, most foundations are supported by soil. In addition, foundations on rock are often designed much more conservatively because of the rock′s greater strength, whereas economics prevents overconservatism when building foundations on soil. Therefore, it is especially important for the foundation engineer to be familiar with soil mechanics.
One of the fundamental differences between soil and most other engineering material is that it is a particulate material. This means that it is an assemblage of individual particles rather than being a continuum (a continuous solid mass). The engineering properties of soil, such as strength and compressibility, are dictated primarily by the arrangement of these particles and the interactions between them, rather than by their internal properties (Coduto, 2001).
A geographic information system (GIS) is a computer-based tool for mapping and analyzing spatial data. GIS technology integrates common database operations such as query and statistical analysis with the unique visualization and geographic analysis benefits offered by maps. These abilities distinguish GIS from other information systems and make it valuable to a wide range of public and private enterprises for explaining events, predicting outcomes, and planning strategies. GIS is considered to be one of the most important new technologies, with the potential to revolutionize many aspects of society
through increased ability to make decisions and solve problems
Soil Classification Systems
Soil classification systems divide soils into groups and subgroups based on common engineering properties such as the grain-size distribution, liquid limit, and plastic limit. The two major classification systems presently in use are (1) the American Association of State Highway and Transportation Officials (AASHTO) system and (2) the Unified Soil Classification System (USCS) (Das, 2007). According to the Unified Soil Classification System, Soils are classified as follows (University of St. Thomas, 2009):
Generally, soils consist of a mixture of different particle types, such as "sandy clay", or a "silty sand".
Atterberg Limit
When a clayey soil is mixed with an excessive amount of water, it may flow like a semi- liquid. If the soil is gradually dried, it will behave like a plastic, semisolid, solid material, depending on its
moisture content. The moisture content, in percent,
at which the soil changes from a liquid to a plastic state is defined as the liquid limit (LL). Similarly, the moisture content, in percent, at which the soil changes from a plastic to a semisolid state and from a semisolid to a solid state are defined as the plastic limit (PL) and the shrinkage limit (SL), respectively. These limits are referred to as Atterberg limits. The difference between the liquid limit and the plastic limit of a soil is defined as the plasticity index (PI) (Das, 2007).
PI= LL- PL Consolidation
In the field, when the stress on a saturated clay layer is increased- for example, by the construction of a foundation- the pore water pressure in the clay will increase. Because the hydraulic conductivity of clays is very small, some times will be required for the excess pore water pressure to dissipate and the increase in stress to be transferred to the soil skeleton.
From consolidation test, three parameters necessary for calculating settlement in the field can be determined. They are preconsolidation pressure (Pc), compression index (Cc) and the swelling index (Cs) (Das, 2011)
Classification of Foundation
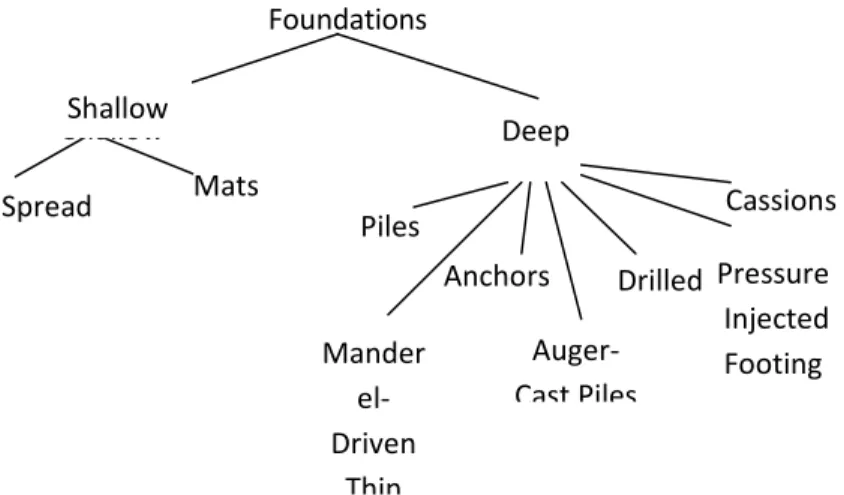
The term foundation is used to describe the structural elements that connect a structure to the ground. These elements are made of concrete, steel, wood, or perhaps other materials. Foundations will be divided into two board categories: shallow foundations and deep foundations, as shown in figure 1 (Coduto, 2001).
Figure 1 Classification of Foundations Effect of the Salts on The Soil
Sabkha soil is a rich soil with salt deposited which result from evaporation of water; it is one of the many types of the collapsible soils and in turn is one of the many types of problematic soils. This soil totally has good engineering properties when dry, i.e, moderately bearing capacity with low settlement. But once is wetted it loses its entire structure (collapse) and undergoes very large instantaneous settlement (Abbas, 2012).
Estimation of Settlements from Standard Penetration Test (Spt)
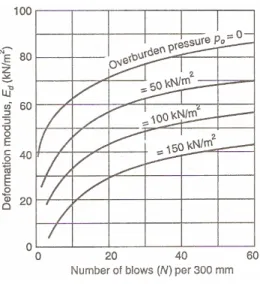
Menzenbach, 1967 arrived at the conclusion of a relationship between the results of standard penetration tests to the deformation modulus of the soil. This relationship is shown in figure 2.
This relationship is shown for different values of the effective overburden pressure Poat the level of test. The values of deformation modulus are then used to calculate the immediate settlement. The Poisson′s ratio (m) should be taken as 0.15 for coarse- grained soils and 0.25 for fine- grained soils.
The calculations of net immediate settlement ∆l (elastic settlement) beneath the corner of a flexible
Mats Piles Drilled Pressure Injected Footing Mander el‐ Driven Thin Shallow Deep Spread Auger‐ Cast Piles Anchors Cassions Foundations Shallow
loaded area is calculated from the following equation (Ghosh, 2010):
∆l = qn × B × (I – m2 )( Ed × Ip ) Where:
B= width of foundation , Ed = deformation modulus, m= Poisson′s ratio, qn = net foundation pressure, Ip = influence factor.
Figure 2 Curves Showing the Relationship between Deformation Modulus and Standard
Pentration Resistance (Prepared By Menzenbach)
Standard Penetration Test Correlations
The SPT has been used in correlations for unit weight γwet, relative density Dr, angle of internal friction Φ , and undrained compressive strength qu, and that can be seen in tables 1 and 2 (Bowles,1996).
Table 1 Empirical Values For Φ, Dr And Unit Weight of Granular Soils Based on the SPT at about 6 M Depth and Normally Consolidated Description Very Loose Medium dense Very Relative 0 0.15 0.35 0.65 0.85 SPT: fine 1-2 3-6 7-15 16-30 ----
Φ: fine 26-28 28-30 30-34 33-38 < 50
γwet,kN/m3 11-16 14-18 17-20 17-22 20-23
Table 2 Consistency of saturated cohesive soils consistency Spt qu,kPa Remarks
Very soft 0-2 < 25 Squishes between fingers when squeezed
Soft 3-5 25-50 Very easily deformed by
squeezing
Medium 6-9 50-100 ---
Stiff 10-16 100-200 Hard to deform by hand squeezing Very stiff 17-30 200-400 Very hard to deform by
hand squeezing Hard > 30 > 400 Nearly impossible to
deform by hand
Components Of A Geographic Information System
A working Geographic Information System seamlessly integrates five key components: hardware, software, data,people, and methods.
H A R D W A R E Hardware includes the computer on which a GIS operates, the monitor on which results are displayed, and a printer for making hard copies of the results. Today, GIS software runs on a wide range of hardware types, from centralized computer servers to desktops computers used in stand-alone or networked configurations. The data files used in GIS are relatively large, so the computer must have a fast processing speed and a large
hard drive capable of saving many files. Because a GIS outputs visual results, a large, high-resolution monitor and a high-quality printer are recommended.
S O F T W A R E GIS software provides the functions and tools needed to store, analyze, and display geographic information. Key software components include tools for the input and manipulation of geographic information, a database
management system (DBMS), tools that support
geographic query, analysis, and visualization, and a graphical user interface (GUI) for easy access to tools. The industry leader is ARC/INFO, produced by
Environmental Systems Research, Inc. The same company produces a more accessible product, ArcView, that is similar to ARCINFO in many ways.
D A T A
Possibly the most important component of a GIS is the data. A GIS will integrate spatial data with other data resources and can even use a database management system, used by most organizations to organize and maintain their data, to manage spatial data. There are three ways to obtain the data to be used in a GIS. Geographic data and related tabular data can be collected in-house or produced by digitizing images from aerial photographs or published maps. Data can also be purchased from commercial data provider. Finally, data can be obtained from the federal government at no cost. P E O P L E
GIS users range from technical specialists who design and maintain the system to those who use it to help them perform their everyday work. The basic techniques of GIS are simple enough to master that even students in elementary schools are learning to use GIS. Because the technology is used in so many ways, experienced GIS users have a tremendous advantage in today’s job market (Chang, 2006).
.How A GIS Works
A GIS stores information about the world as a collection of thematic layers that can be linked together by geography. This simple but extremely powerful and versatile concept has proven invaluable for solving many real-world problems from modeling global atmospheric circulation, to predicting rural land use, and monitoring changes in rainforest ecosystems.
GIS Tasks
General purpose GIS’s perform seven tasks. - Input of data
- Map making
- Manipulation of data - File management - Query and analysis - Visualization of results
Input of Data
Before geographic data can be used in a GIS, the data must be converted into a suitable digital format. The process of converting data from paper maps or aerial photographs into computer files is called digitizing. Modern GIS technology can automate this process fully for large projects using scanning technology; smaller jobs may require some manual digitizing which requires the use of a digitizing table
Today many types of geographic data already exist in GIS-compatible formats. These data can be loaded directly into a GIS.
Map Making
Maps have a special place in GIS. The process of making maps with GIS is much more flexible than are traditional manual or automated cartography approaches. It begins with database creation. Existing paper maps can be digitized and computer-compatible information can be translated into the GIS. The GIS-based cartographic database can be both continuous and scale free. Map products can then be created centered on any location, at any scale, and showing selected information symbolized effectively to highlight specific characteristics. The characteristics of atlases and map series can be encoded in computer programs and compared with the database at final production time. Digital products for use in other GIS’s can also be derived by simply copying data from the database. In a large organization, topographic databases can be used as reference frameworks by other departments. Manipulation of Data
It is likely that data types required for a particular GIS project will need to be transformed or manipulated in some way to make them compatible with your system. For example, geographic information is available at different scales (street centerline
files might be available at a scale of 1:100,000; census boundaries at 1:50,000; and postal codes at 1:10,000). Before this information can be integrated, it must be transformed to the same scale. This could be a temporary transformation for display
purposes or a permanent one required for analysis. GIS technology offers many tools for manipulating spatial data and for weeding out unnecessary data.
File Management
For small GIS projects it may be sufficient to store geographic information as simple files. There comes a point, however, when data volumes become large and the number of data users becomes more than a few, that it is best to use a database management system (DBMS) to help store, organize, and manage data. A DBMS is nothing more than computer software for managing a database--an integrated collection of data.
Query and Analysis
Once you have a functioning GIS containing your geographic information, you can begin to ask simple questions such as
- How far is it between two places?
- How is this particular parcel of land being used?
- What is the dominant soil type for oak forest?
- Where are all the sites suitable for relocating an endangered species?
- Where are all of the sites possessing certain characteristics?
- If I build a new highway here, how will animals in the area be affected? GIS provides both simple point-and-click query capabilities and sophisticated analysis tools to provide timely information to managers and analysts alike. GIS technology really comes into its own when used to analyze geographic data to look for patterns and trends, and to undertake "what if" scenarios. Visualization For many types of geographic operations, the end result is best visualized as a map or graph. Maps are very efficient at storing and communicating geographic information. While cartographers have created maps for millennia, GIS provides new and exciting tools to extend the art and science of cartography. Map displays can be integrated with reports, three-dimensional views, photographic images, and with multimedia ( Sutton, 2009).
The Importance of Geographic Information Systems
The ability of GIS to search databases and perform geographic queries has revolutionized many areas of science and business. It can be invaluable during
a decision-making process. The information can be presented succinctly and clearly in
the form of a map and accompanying report, allowing decision makers to focus on the real issues rather than trying to understand the data. Because GIS products can be produced quickly, multiple scenarios can be evaluated efficiently and effectively. For this reason, in today’s world, the ability to use GIS is increasingly important (DeMers, 2005).
Using GIS to Make the Database for Baghdad Soils
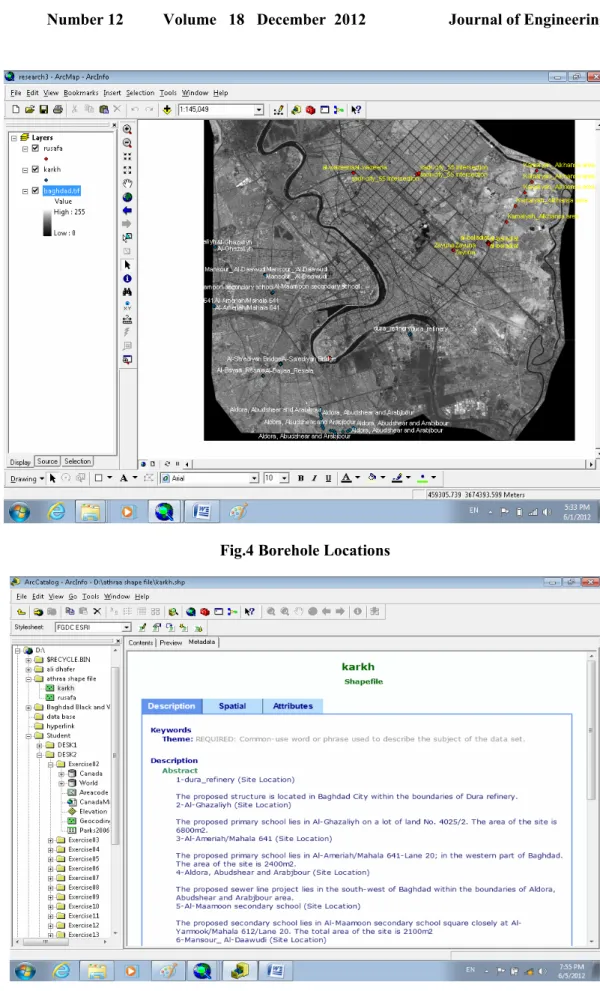
To make the database for Baghdad soils, the latest aerial photo of the city of Baghdad is prepared and Georeferenced as shown in figure (3). The boreholes locations are divided into two groups, one in Karkh (Ameriah, Arabjbour, , Sa′ediyah , Ghazaliyh, Mamoon , Bayaa, Kamalyah ,Dura-refinery and Mansour ) and the other in Rusafa (Wazeriya , Baladiat, , Sadr city, Aljaderiyah, , Zayuna) . Presentation for the locations is made in the arcmap by making two layers for boreholes, one in Karkh side and the other in Rusafa side.
Figure (4) shows the two layers as well as the layer of Baghdad aerial photo.
Description of each site location is represented in GIS techniques by metadata which is the part of the system where the detailed description for the abstract, purpose, status of the data, time period for the data is relevant,.etc. the description of the site location can be seen in figures (5) and (6).
Laboratory Test
After drilling the vertical holes into the ground, the disturbed and undisturbed samples are obtained. From disturbed samples, the tests involved the grain size analysis and then classified the soil (according to BS 1377), Atterberg limit is performed according to (BS 1377:1975,Test 2(B)) , chemical test (organic content (OR %), sulphate content (So3%), chloride content (CL%) (according to BS 1377) ((Head, 1980), gypsum content (according to the following equation (gypsum content = So3% ×
2.15) (Al-Mufty , 1997) and Total soluble salts
content (T.S.S%) (Earth Manual,E8) (Earth Manual, 1974). From undisturbed samples, the test involved the consolidation test (from this test, the following parameters can be obtained: initial void ratio eo, compression index cc, swelling index cs , coefficient of consolidation cv , coefficient of volume change mv, maximum preconsolidation stress Pc, Effective overburden pressure Po) (according to BS 1377:1975) (Head, 1982) and shear test (the following parameters can be obtained: undrained cohesion cu , angle of friction φ (ASTM , D2166) (Head, 1982). For example, the soil properties of Al- Ghazaliyah (in Karkh group) are shown in tables (3), (4), (5) and (6).
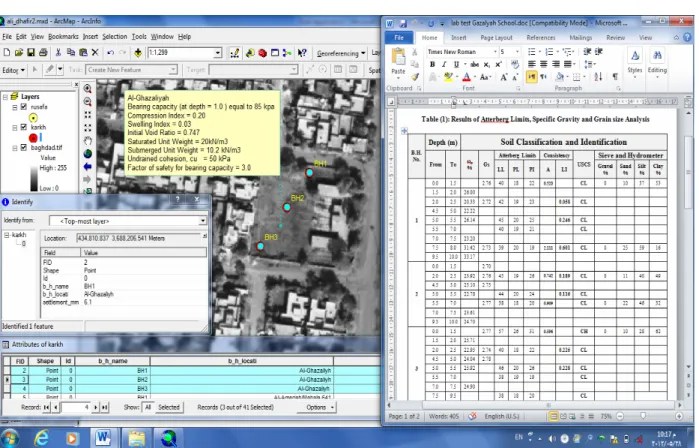
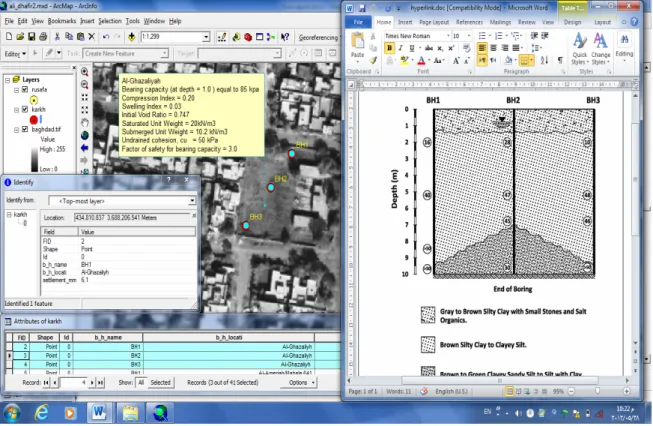
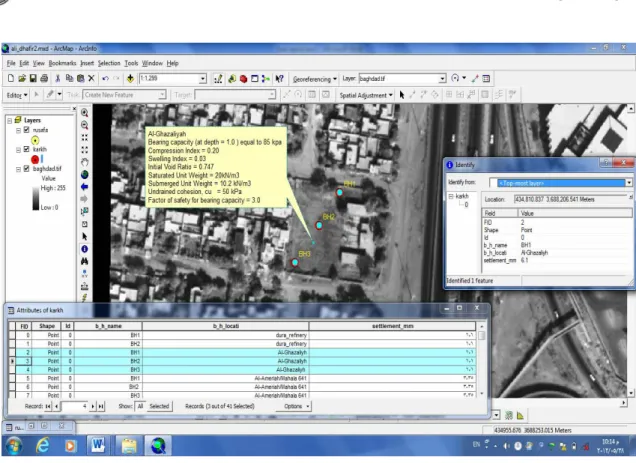
All the above is represented in the GIS technique as shown in figure (7), (8), and (9). These figures show the potentials and facilities that GIS produce to connect between the spatial location of the boreholes and their computations, analyses and results, so by clicking any point which represents the location of any borehole in any site of the fourteen test sites, all the information about Atterberg Limits, Specific Gravity, Grain size Analysis, Shear Strength parameters, Consolidation parameters, Borehole log, Site profile can be obtained by using the hyperlink technique.
By analyzing the above parameters, the design parameters of Ghazaliyah site are concluded and these parameters can be presented in table (7) Managing the table above in the system in figure (10) which shows the attribute table containing the table information but in this case it is spatially connected.
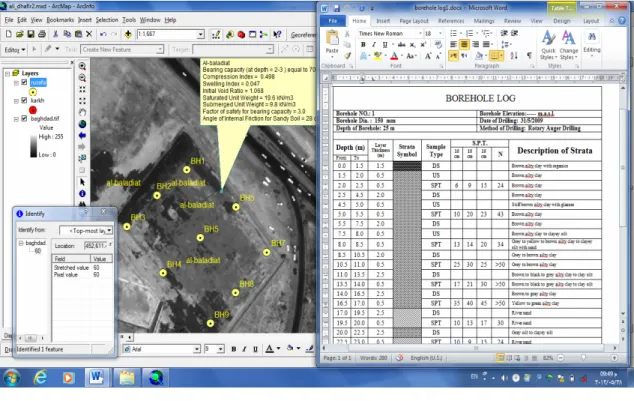
Another example in Rusafa group is Al-Baladiat site, the soil properties, borehole log, the site profile and the design parameters are represented by GIS in figures (11), (12), (13) and (14).
By using the SQL (System Query Language), the sites those have bearing capacity less than 100 kpa
are obtained in Karkh and Rusafa as shown in figures (15) and (16)
NOTE:
- The detailed applications of the research using the GIS are in the attendant CD. Uploading of the ARCGIS 9.3 or 10 is needed.
- The information in CD must be placed in D partitions in the hard disk of the computer. Conclusion
From the previous results, the parameters design for Baghdad soils in general can be shown as the following:
Bearing capacity (1.0-3.0) m equal to (90-110) kpa • Compression Index = 0.106 – 0.465
• Swelling Index = 0.005- 0.046 • Initial Void Ratio = 0.68 -1.068 • Saturated Unit Weight = 20 kN/m3 • Submerged Unit Weight = 10 kN/m • Undrained cohesion, cu = 40 -55 kPa • Angle of friction = (28 -30) degree • Factor of safety for bearing capacity = 3
• The above conclusions can be represented in GIS in figure 17
• In Karkh, Ghazaliyh and Al- Sa′ediyah have bearing of capacity less than 100 kpa
• In Rusafa, Al-Baladiat has bearing of capacity less than 100 kpa
References
• Al-Mufty, A.A., “Effect of Gypsum Dissolution on the Mechanical Behavior of Gypseous Soils” Ph.D. Thesis, Civil Engineering Department, University of Baghdad, 1997.
• Abbas, H. O., “Improvement of Sabkha Soil by Using Geomesh and Addition of Poly Coat, 2012. • Bowels, J. E., “Foundation Analysis and Design”, Fifth Edition, the McGraw- Hill Companies.
• Chang, K. T., “Introduction to Geographic Information Systems”, Third Edition. McGraw, 2006.
• Coduto, D. B., “Foundation Design, Principles and Practices”, second Edition, 2001.
• Das, B.M., “Principles of Geotechnical Engineering”, fifth edition, 2007.
• Das, B. M., “Principles of Foundation Engineering”, Seven edition, 2011.
• Das, B. M., “Principles of Foundation Engineering”, Six edition, 2007.
• DeMers, M. N., “Fundementals of Geographic Information System”, Third Edition, Wily, 2005. • Earth Manual, U.S.,"Department of the Interior
Bureau of Reclamation" Second Edition, Washington, 1974.
• Ghosh, M. G., “Foundation Design Practice”, 2010.
• Head, K.H., “Manual of Soil Laboratory Testing”. Vol. 1, Prentch,
press, London, 1980.
• Head, K.H., “Manual of Soil Laboratory Testing”. Vol. 2, Prentch,
press, London, (1982)
• Menzenbach, E., Le Capacidad soportante de pilotes y grupos pilotes, Technologia (Ingeneria Civil) series 2, No. 1, pp. 20-21, Aavana University, Cuba, 1967.
• Sutton, T.,” a Gentle Introduction to GIS”, 2009. • University of Thomas, “an Introduction to Soils”,
2009.
Fig.4 Borehole Locations
Fig. 6 Metadata of Rusafa
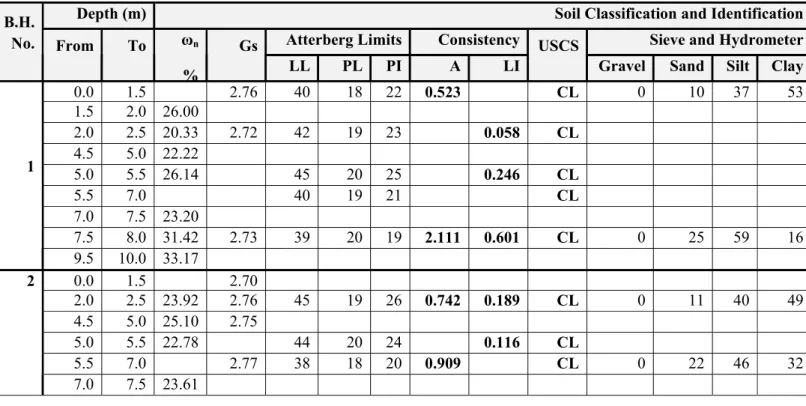
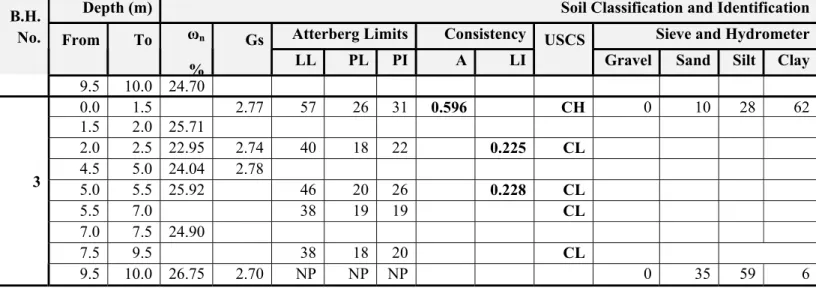
Table 3: Results of Atterberg Limits, Specific Gravity & Grain size Analysis
Depth (m) Soil Classification and Identification
Atterberg Limits Consistency Sieve and Hydrometer B.H. No. From To ωn % Gs LL PL PI A LI USCS
Gravel Sand Silt Clay 0.0 1.5 402.76 18 22 0.523 CL 100 37 53 1.5 2.0 26.00 2.0 2.5 20.33 2.72 42 19 23 0.058 CL 4.5 5.0 22.22 5.0 5.5 26.14 2045 25 0.246 CL 5.5 7.0 1940 21 CL 7.0 7.5 23.20 7.5 8.0 31.42 2.73 39 20 19 0.6012.111 CL 250 59 16 1 9.5 10.0 33.17 0.0 1.5 2.70 2.0 2.5 23.92 2.76 45 19 26 0.1890.742 CL 110 40 49 4.5 5.0 25.10 2.75 5.0 5.5 22.78 2044 24 0.116 CL 5.5 7.0 382.77 18 20 0.909 CL 220 46 32 2 7.0 7.5 23.61
Depth (m) Soil Classification and Identification
Atterberg Limits Consistency Sieve and Hydrometer B.H. No. From To ωn % Gs LL PL PI A LI USCS
Gravel Sand Silt Clay 9.5 10.0 24.70 0.0 1.5 572.77 26 31 0.596 CH 100 28 62 1.5 2.0 25.71 2.0 2.5 22.95 2.74 40 18 22 0.225 CL 4.5 5.0 24.04 2.78 5.0 5.5 25.92 2046 26 0.228 CL 5.5 7.0 1938 19 CL 7.0 7.5 24.90 7.5 9.5 1838 20 CL 3 9.5 10.0 26.75 2.70 NP NP NP 350 59 6 Where:
LI: Liquidity Index⎢⎣⎡ = ω − ⎥⎦⎤ . . . . . . I P L P I L n A: Activity ⎥ ⎦ ⎤ ⎢ ⎣ ⎡ = fraction clay I P A . . LL: Liquid Limit PL: Plastic Limit PI: Plasticity Index
n
ω : Natural Water Content
Table 4: Results of Shear Strength Tests
Shear Test Triaxial (UU) BH No. Depth (m) γt kN/m3 ωn % UCS kPa C φ° 1.5-2.0 21.27 26.00 211.0 - -1 4.5-5.0 19.76 22.22 72.5- 0.0 2 19.874.5-5.0 25.10 60.0- 0.0 1.5-2.0 19.96 26.00 327.5 - -3 4.5-5.0 19.38 24.03 50.1- 4.25
Table 5: Results of Consolidation Test
Parameters of Consolidation Test BH No. Depth (m) ωn eo cc cs mv cv Pc Po OCR 2 4.5-5.0 25.1019.68 0.747 0.200 0.028 0.264 6.03 125 49.98 2.50 3 4.5-5.0 24.0419.96 0.726 0.182 0.030 0.100 9.93 250 55.31 4.52
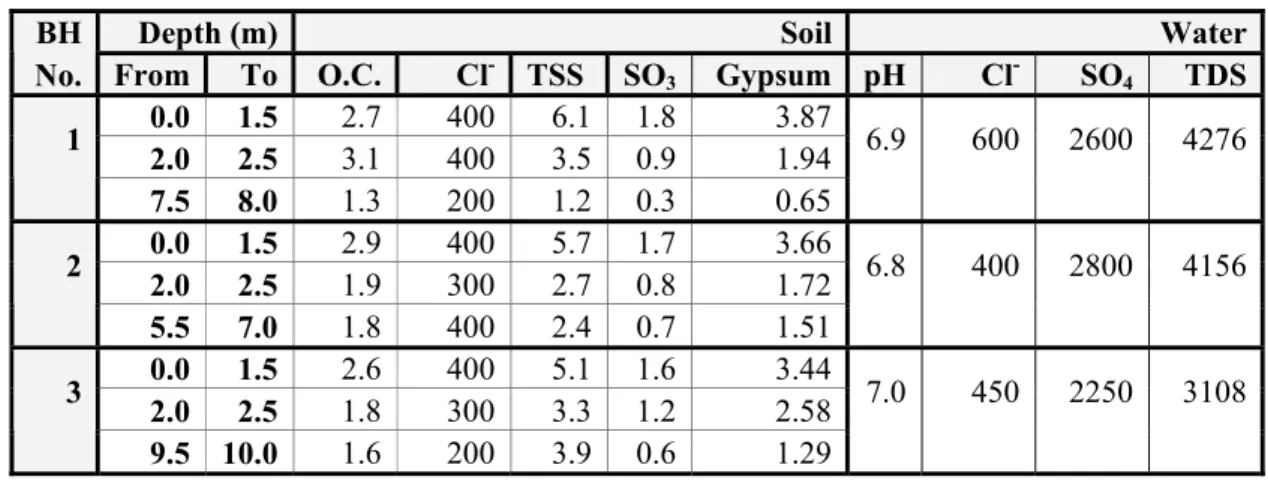
Table 6 Results of Chemical Analysis
Depth (m) Soil Water
BH
No. From To O.C. Cl- TSS SO3 Gypsum pH Cl- SO4 TDS 0.0 1.5 4002.7 6.1 1.8 3.87 2.0 2.5 4003.1 3.5 0.9 1.94 1 7.5 8.0 2001.3 1.2 0.3 0.65 6.9 600 2600 4276 0.0 1.5 4002.9 5.7 1.7 3.66 2.0 2.5 3001.9 2.7 0.8 1.72 2 5.5 7.0 4001.8 2.4 0.7 1.51 6.8 400 2800 4156 0.0 1.5 4002.6 5.1 1.6 3.44 2.0 2.5 3001.8 3.3 1.2 2.58 3 9.5 10.0 2001.6 3.9 0.6 1.29 7.0 450 2250 3108
Fig. 7 Laboratory Test by GIS in Ghazaliyah
Fig. 9 Site Profile by GIS in Ghazaliyah
Table (7) Values of the Design Parameters for Ghazaliyah site Bearing capacity (at depth = 1.0 ) 85 kpa
Compression Index 0.20
Swelling Index 0.03
Saturated Unit Weight 0.747 Submerged Unit Weigh 20kN/m3
Undrained cohesion, cu 50 kPa
Factor of safety for bearing capacity 3.0
Fig.10 Values of the Design Parameters by GIS in Ghazaliyah
Fig. 12 Borehole Log by GIS in Al-Baladiat
Fig. 14 Values of the Design Parameters by GIS in Al-Baladiat
Fig. 16 Bearing Capacity Less than (100) kpa in Rusafa