University of Huddersfield Repository
Alseddiqi, Mohamed, Mishra, Rakesh and Pislaru, Crinela
An Evaluation Quality Framework for Analysing School-Based Learning (SBL) to Work-Based
Learning (WBL) Transition Module
Original Citation
Alseddiqi, Mohamed, Mishra, Rakesh and Pislaru, Crinela (2012) An Evaluation Quality
Framework for Analysing School-Based Learning (SBL) to Work-Based Learning (WBL)
Transition Module. In: COMADEM 2012, 18th-20th June 2012, University of Huddersfield, UK.
(In Press)
This version is available at http://eprints.hud.ac.uk/13795/
The University Repository is a digital collection of the research output of the
University, available on Open Access. Copyright and Moral Rights for the items
on this site are retained by the individual author and/or other copyright owners.
Users may access full items free of charge; copies of full text items generally
can be reproduced, displayed or performed and given to third parties in any
format or medium for personal research or study, educational or not-for-profit
purposes without prior permission or charge, provided:
•
The authors, title and full bibliographic details is credited in any copy;
•
A hyperlink and/or URL is included for the original metadata page; and
•
The content is not changed in any way.
For more information, including our policy and submission procedure, please
contact the Repository Team at: [email protected].
An Evaluation Quality Framework for Analysing School-Based
Learning (SBL) to Work-Based Learning (WBL) Transition
Module
M Alseddiqi, R Mishra and C Pislaru
School of Computing and Engineering, University of Huddersfield, Huddersfield, HD1 3DH, U.K
E-mail: [email protected]
Abstract. The paper presents the results from a quality framework to measure the effectiveness of
a new engineering course entitled ‘school-based learning (SBL) to work-based learning (WBL) transition module’ in the Technical and Vocational Education (TVE) system in Bahrain. The framework is an extended version of existing information quality frameworks with respect to pedagogical and technological contexts. It incorporates specific pedagogical and technological dimensions as per the Bahrain modern industry requirements. Users’ views questionnaire on the
effectiveness of the new transition module was distributed to various stakeholders including TVE teachers and students. The aim was to receive critical information in diagnosing, monitoring and evaluating different views and perceptions about the effectiveness of the new module. The analysis categorised the quality dimensions by their relative importance. This was carried out using the principal component analysis available in SPSS. The analysis clearly identified the most important quality dimensions integrated in the new module for SBL-to-WBL transition. It was also apparent that the new module contains workplace proficiencies, prepares TVE students for work placement, provides effective teaching and learning methodologies, integrates innovative technology in the process of learning, meets modern industrial needs, and presents a cooperative learning environment for TVE students. From the principal component analysis finding, to calculate the percentage of relative importance of each factor and its quality dimensions, was significant. The percentage comparison would justify the most important factor as well as the most important quality dimensions. Also, the new, re-arranged quality dimensions from the finding with an extended number of factors tended to improve the extended version of the quality information framework to a revised quality framework.
1. Introduction
The Quality Assurance Authority for Education and Training (QAAET) examined the quality of TVE in Bahrain [1], and the audit was conducted by QAAET’s own team of reviewers. The main focus was to monitor the educational system and measure the effectiveness of the TVE system with respect to four quality indicators:
A- Students’ participation
It was found that most students were unable to participate sufficiently in the theoretical modules. They were not motivated or encouraged by teachers to practise various employability skills in the class. However, there were some good lessons in the practical modules, where students worked together effectively when given the chance to experience the workplace. It was obvious that most TVE students were not able to practise analytical thinking skills, communicate effectively with others, feel confident, or show awareness and responsibility in their behaviour [1].
B- Teaching and learning strategy
The existing teaching and learning strategy gave little attention to motivation and feedback processes. The team could not identify any strategy for teaching and learning, and teaching and learning were mainly based on the teachers’ experience.
C- TVE curricula
Few of the employability skills required by industry were integrated in either theoretical or practical learning modules. For example, in practical modules, students acquired applied skills satisfactorily; most of them dealt with ICT skills adequately and gained specific technical skills such as machine operation. However, teachers tended to give instructions which did not give the students opportunity to expand their knowledge and understanding.
D- TVE career guidance services
Career guidance services provided important information to students during the transition period from SBL to WBL, delivering an induction programme prior to WBL. However, this induction programme was short and did not include details of the employability skills required by industry. In addition to the limitations identified by the QAAET study, the authors claimed that further quality indicators should be used to measure the effectiveness of the entire TVE system. They proposed the development of a new framework for measuring the effectiveness of the system, and reviewed existing quality models from the literature in order to select ones that might be modified to make them suitable for the Bahraini TVE system’s specific needs.
2. Information Quality Frameworks
Richard Wang and Diana Strong in 1996 [2] initiated original work for setting standards for information quality frameworks. Their purpose was to critically evaluate users’ viewpoints towards the content of e-learning systems and give priority to quality as an evaluation of excellence [3]. For example, in TVE developmental projects in Bahrain, top priority was given to restructuring the learning content, adopting new teaching and learning methods, and integrating technology in the learning environment. On the other hand, less attention was given to evaluating the effectiveness of the newly developed projects and their characteristics. It was also indicated that a specific framework for evaluating e-learning systems in TVE was essential in evaluating their effectiveness.
It was obvious that pedagogical and technological aspects could not continually improve without a quality evaluation process. An information quality framework would assist TVE people to measure the effectiveness of e-learning content, and motivate them to create innovative content that meets modern and local industrial needs [4].
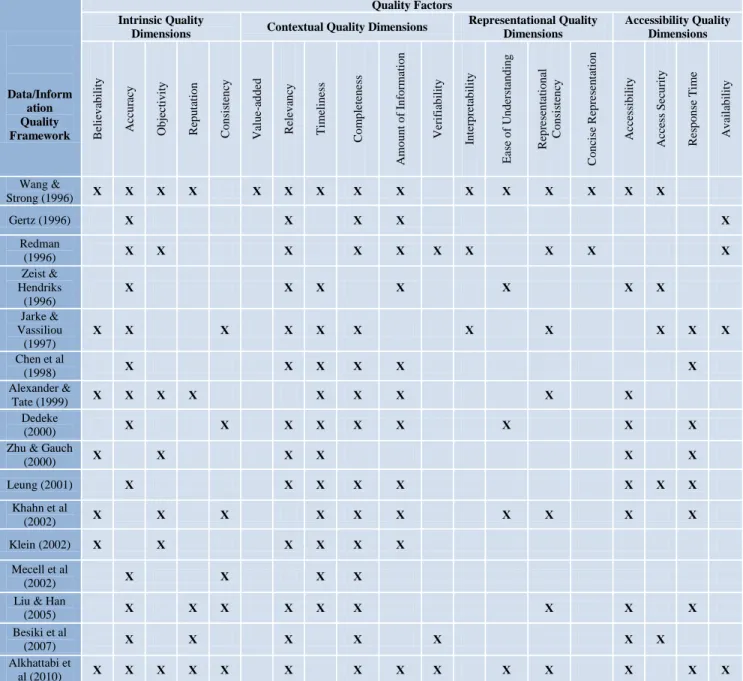
Table 1 presents various information quality frameworks which grew from the original work of Wang and Strong [2]. It is apparent that the frameworks have the same four quality factors as presented by Wang and Strong; however, differences appear in the quality dimensions. The justification was that each framework was formulated to meet specific requirements. In total, 19 quality dimensions were found in
the literature. The authors believe that these frameworks are generic and could be used for any e-learning systems content. For the purpose of the SBL-to-WBL transition module, some specific elements should be added to measure pedagogical issues related to specific industrial needs. A closer study of the existing models found that they did not include quality of the e-learning content corresponding to pedagogical and industrial workplace requirements. At best, the model is generic and cannot be used for specific engineering application-based courses.
Table 1. Comparison among Information Quality Frameworks.
Data/Inform ation Quality Framework Quality Factors Intrinsic Quality
Dimensions Contextual Quality Dimensions
Representational Quality Dimensions Accessibility Quality Dimensions B el ie v ab il it y A cc u ra cy O b je ct iv it y R ep u ta ti o n C o n si st en cy V al u e-ad d ed R el ev an cy Ti me li n ess C o m p le te n ess A mo u n t o f In fo rmat io n V er if ia b il it y In te rp re ta b il it y Ea se o f U n d er st an d in g R ep re se n ta ti o n al C o n si st en cy C o n ci se R ep re se n ta ti o n A cc ess ib il it y A cc ess S ec u ri ty R es p o n se T ime A v ai la b il it y Wang & Strong (1996) Х Х Х Х Х Х Х Х Х Х Х Х Х Х Х Gertz (1996) Х Х Х Х Х Redman (1996) Х Х Х Х Х Х Х Х Х Х Zeist & Hendriks (1996) Х Х Х Х Х Х Х Jarke & Vassiliou (1997) Х Х Х Х Х Х Х Х Х Х Х Chen et al (1998) Х Х Х Х Х Х Alexander & Tate (1999) Х Х Х Х Х Х Х Х Х Dedeke (2000) Х Х Х Х Х Х Х Х Х
Zhu & Gauch
(2000) Х Х Х Х Х Х Leung (2001) Х Х Х Х Х Х Х Х Khahn et al (2002) Х Х Х Х Х Х Х Х Х Х Klein (2002) Х Х Х Х Х Х Mecell et al (2002) Х Х Х Х
Liu & Han
(2005) Х Х Х Х Х Х Х Х Х
Besiki et al
(2007) Х Х Х Х Х Х Х
Alkhattabi et
3. The Extended Information Quality Framework
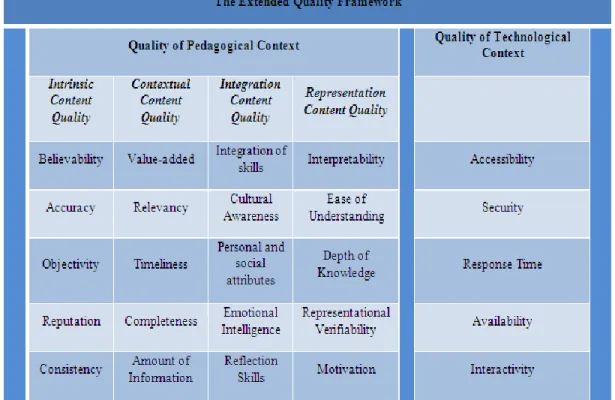
The authors proposed an extended information quality framework as shown in figure 1. It includes 25 quality dimensions divided between quality of pedagogical context and quality of technological context.
- Quality of pedagogical context: The quality dimensions used in the evaluation are divided equally
among the following indexes: intrinsic content quality, contextual content quality, integration content quality, and representation content quality. In total, there are 20 quality dimensions in this context, 13 identified from the existing quality models (believability, accuracy, objectivity, reputation, consistency, value-added, relevancy, timeliness, completeness, amount of information, verifiability, interpretability and ease of understanding) and seven from the skills requirements of Bahraini industry (integration of skills, cultural awareness, personal and social attributes, emotional intelligence, reflection skills, depth of knowledge and motivation) [5].
- Quality of technological context: There are five quality dimensions to assess the effectiveness of the
technological context: accessibility, security, response time, availability and interactivity. These dimensions were incorporated from quality frameworks available in the existing information quality frameworks.
Figure 1. The extended quality framework.
4. The Questionnaire
A questionnaire is a set of questions to elicit responses aimed to achieve certain research objectives [6]. The questionnaire was designed in such a way as to engage the respondents’ interest, encourage co-operation and extract reliable and accurate data.
From the above figure, an extended information quality framework was designed on the basis of the information quality frameworks [3] and the identified skills needs from modern industry [5]. The questionnaire’s main objective was to receive critical information in evaluating different perceptions about the effectiveness of the new SBL-to-WBL transition module. The respondents were asked to give brief information and to categorise 25 different quality dimensions in terms of their importance in the new module. The respondents were the users of the new module (TVE teachers and TVE students).
Regarding this questionnaire development process, it has seen that the questionnaire was drafted and constructed for different users. However, the clarity of the questionnaire was examined to eliminate overlapping ideas, evaluate the validity of the questions, and ensure that important elements are reflected in the questionnaires [7].
The questionnaire questions were generated from the extended information quality framework identified earlier in this paper. There were 25 questions; each one represents a quality dimension. The questions here were accommodated with opinions and attributes data variables (Saunders et al., 2003). Each question was designed in such a way that it would engage the respondents’ interest, encourage co-operation and extract reliable and accurate data. The questions were carefully selected to test a variety of conditions. Moreover, the questions were grouped and classified according to the purpose of this questionnaire. Moreover, the questions were designed with simple words to avoid ambiguity and to be easily understood and followed [8]. A clear sequence was followed to structure the questions with an accurate plan to avoid confusion [9]. The sample size was 48 teachers and 30 students. They were the users of the new SBL-to-WBL transition module. The above clarified that it was convenient that the research sought data from stakeholders who would be informative. It was decided to use purposive sampling. In terms of rating scales, the questions were adopted with a 5-point Likert Response Scale [10]. The respondents were asked to record the degree of their perception of each question on the 5-point scale: 1- Strongly agree, 2- Agree, 3- Neither agree nor disagree, 4- Disagree, and 5- Strongly disagree.
5. Data Analysis
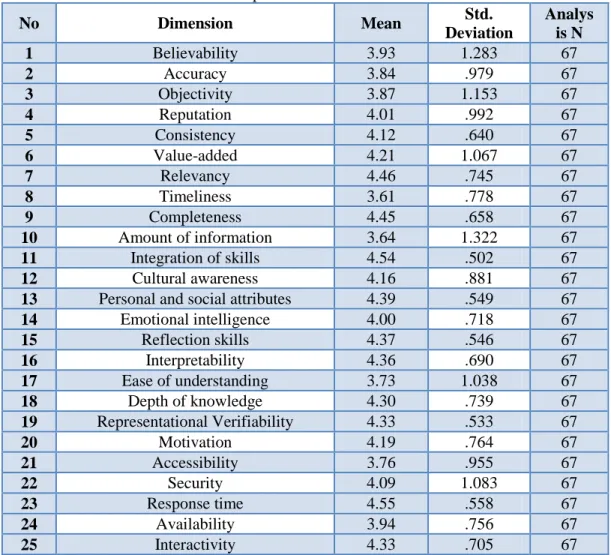
The next section is an analysis which categorised the quality dimensions by their relative importance. This was carried out using the principal component analysis available in SPSS. It should clearly identify the most important quality dimensions integrated in the new module for SBL-to-WBL transition. The principal component analysis began with the descriptive statistics. It was based on the mean and standard deviation for all the variables from the investigation. The mean value was identified as the central tendency value for average value of distribution, and the standard deviation was the dispersion value for the total respondents of 67 [11]. Table 2 presents the descriptive statistics for the variables. The highest mean values were 4.55 and 4.54, for response time and integration of skills respectively. In addition, all the dimensions were of vital importance; it was obvious that the average scores of all the evaluative items are above the mid-point (3) of the 5-point Likert scale. The descriptive statistics were more meaningful as they showed that all the dimensions are important from the users’ point of view. Therefore, this output gives the necessary information of the variables’ distribution.
Table 2. Descriptive statistics for the variables. No Dimension Mean Std. Deviation Analys is N 1 Believability 3.93 1.283 67 2 Accuracy 3.84 .979 67 3 Objectivity 3.87 1.153 67 4 Reputation 4.01 .992 67 5 Consistency 4.12 .640 67 6 Value-added 4.21 1.067 67 7 Relevancy 4.46 .745 67 8 Timeliness 3.61 .778 67 9 Completeness 4.45 .658 67 10 Amount of information 3.64 1.322 67 11 Integration of skills 4.54 .502 67 12 Cultural awareness 4.16 .881 67
13 Personal and social attributes 4.39 .549 67
14 Emotional intelligence 4.00 .718 67 15 Reflection skills 4.37 .546 67 16 Interpretability 4.36 .690 67 17 Ease of understanding 3.73 1.038 67 18 Depth of knowledge 4.30 .739 67 19 Representational Verifiability 4.33 .533 67 20 Motivation 4.19 .764 67 21 Accessibility 3.76 .955 67 22 Security 4.09 1.083 67 23 Response time 4.55 .558 67 24 Availability 3.94 .756 67 25 Interactivity 4.33 .705 67
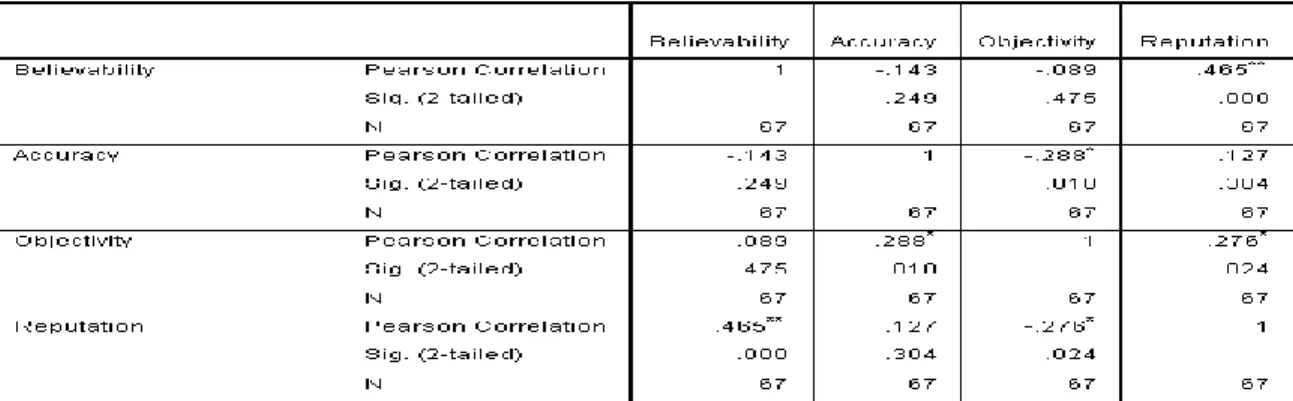
Once the descriptive statistics have been introduced, it is important to identify correlations among them. Here, the analysis measures two variables, namely strength and direction. This analysis has an important implication for correlation among the various factors. Table 3 presents an example of the R-matrix correlations table for only four variables of the analysis. According to Sinn [12], the first correlation is the Pearson correlation which specifies that the larger value is the better with either (-) or (+) direction; this is called r-value. The second correlation is the p-value, which indicates that the correlation is significant at the 0.05 level (2-tailed). N is the total number of respondents, in this case 67.
Table 3. An example of correlation.
It was obvious that all the values of the Pearson correlation with (*) must reject the hypothesis Ho. This ensures accurate correlation with the test score. For example, Figure 2 shows the correlation between the objectivity dimension and the accuracy dimension.
Figure 2. An example of correlation.
The example indicates that the p-value is below the 0.05 level; therefore, this gives confidence that there is an actual correlation with the test score [12].
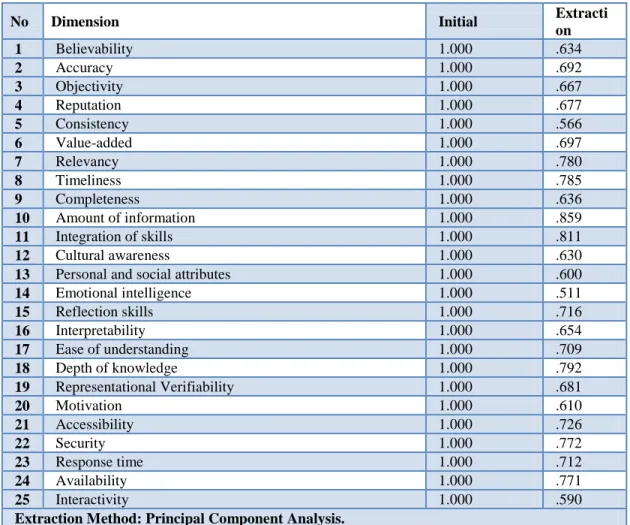
Table 4 shows the output measures for all the dimensions before and after extractions. The initial statement is that all the variables are ordinary with the value of 1 [11]. This value is assumed before extraction. After extraction, each dimension is converted to an accurate value. For example, 86% of the variance of the scores for ‘amount of information’ in explanation for the common factors is extracted by this analysis. For measuring the reliability of factor analysis, two tests are illustrated in table 5, namely the Kaiser-Meyer-Olkin (KMO) test and Bartlett’s Test of Sphericity.
Kaiser-Meyer-Olkin measures sampling accuracy. KMO value is recommended to be between 0 and 1.
The reliability of factors is increased when the value is close to 1 [3]. In this case, table 5 displays the value of 0.738 which indicates that this analysis had and adequate sample size.
Bartlett’s test measures how significant the factor analysis is with respect to the null hypothesis. The
significant value tends to be less than 0.05 [3]. With regard to the correlation coefficient value of zero, this indicates that the test is significant with an appropriate factor analysis. The tests indicated that the sample size is suitable to analyse this set of data.
Table 4. Variable communalities.
No Dimension Initial Extracti
on 1 Believability 1.000 .634 2 Accuracy 1.000 .692 3 Objectivity 1.000 .667 4 Reputation 1.000 .677 5 Consistency 1.000 .566 6 Value-added 1.000 .697 7 Relevancy 1.000 .780 8 Timeliness 1.000 .785 9 Completeness 1.000 .636 10 Amount of information 1.000 .859 11 Integration of skills 1.000 .811 12 Cultural awareness 1.000 .630
13 Personal and social attributes 1.000 .600
14 Emotional intelligence 1.000 .511 15 Reflection skills 1.000 .716 16 Interpretability 1.000 .654 17 Ease of understanding 1.000 .709 18 Depth of knowledge 1.000 .792 19 Representational Verifiability 1.000 .681 20 Motivation 1.000 .610 21 Accessibility 1.000 .726 22 Security 1.000 .772 23 Response time 1.000 .712 24 Availability 1.000 .771 25 Interactivity 1.000 .590
Extraction Method: Principal Component Analysis.
Table 5. KMO and Bartlett’s Test.
Kaiser-Meyer-Olkin Measure of Sampling Adequacy. .738
Bartlett's Test of Sphericity Approx. Chi-Square 685.912
df 300
Sig. .000
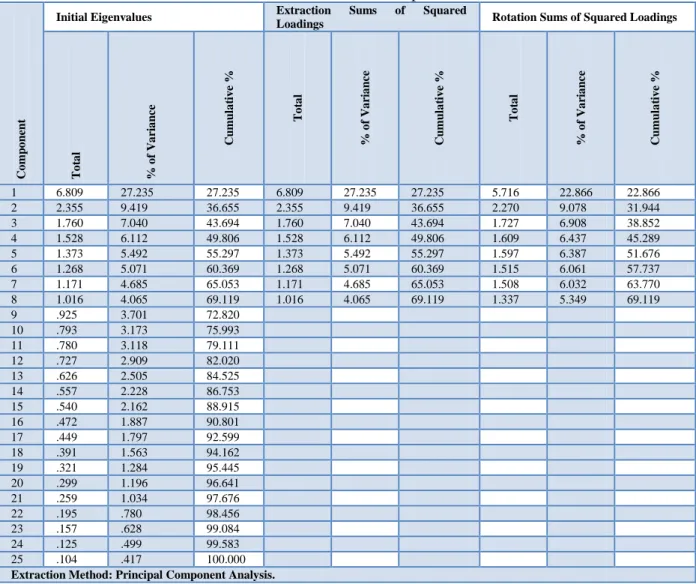
Table 6 presents the extracted factors for the data analysed. Specifically, it displays the initial proportion of variance accounted for each factor, followed by the proportion of variance accounted before rotation, and finally the proportion of variance accounted after rotation [11]. Bear in mind, the 25 factors accounted for all the variance in the test of the principal component analysis.
It appeared that the initial eigenvalues incorporated the total variance for each dimension; then the percentage of variance and the cumulative percentage were obtained for each individual factor. For example, factor one has a total variance of 6.809. Then, the factor variance percentage is equal to 27.235% by dividing the factor total variance by the total number of tests, 25.
Table 6. Total Variance Explained. C o mp o n en t
Initial Eigenvalues Extraction Sums of Squared
Loadings Rotation Sums of Squared Loadings
T o ta l % o f V a ri a n ce C u mul a ti v e % T o ta l % o f V a ri a n ce C u mul a ti v e % T o ta l % o f V a ri a n ce C u mul a ti v e % 1 6.809 27.235 27.235 6.809 27.235 27.235 5.716 22.866 22.866 2 2.355 9.419 36.655 2.355 9.419 36.655 2.270 9.078 31.944 3 1.760 7.040 43.694 1.760 7.040 43.694 1.727 6.908 38.852 4 1.528 6.112 49.806 1.528 6.112 49.806 1.609 6.437 45.289 5 1.373 5.492 55.297 1.373 5.492 55.297 1.597 6.387 51.676 6 1.268 5.071 60.369 1.268 5.071 60.369 1.515 6.061 57.737 7 1.171 4.685 65.053 1.171 4.685 65.053 1.508 6.032 63.770 8 1.016 4.065 69.119 1.016 4.065 69.119 1.337 5.349 69.119 9 .925 3.701 72.820 10 .793 3.173 75.993 11 .780 3.118 79.111 12 .727 2.909 82.020 13 .626 2.505 84.525 14 .557 2.228 86.753 15 .540 2.162 88.915 16 .472 1.887 90.801 17 .449 1.797 92.599 18 .391 1.563 94.162 19 .321 1.284 95.445 20 .299 1.196 96.641 21 .259 1.034 97.676 22 .195 .780 98.456 23 .157 .628 99.084 24 .125 .499 99.583 25 .104 .417 100.000 Extraction Method: Principal Component Analysis.
Based on Kaiser’s criterion , the factors with eigenvalues less than one were excluded. With reference to Table 6, factors 9-25 were not counted. The table also shows that the eight factors that meet the criterion value of Kaiser were given the cumulative percentage of 69.2%.
The second part of the table concerned the extraction sums of squared loadings. It contained the same output for initial eigenvalues; however, only the first eight factors were included. The final part of the table represents the rotation sums of squared loadings, showing the rotated values for the eight factors which met the Kaiser’s criterion value.
Figure 3 presents the scree plot. The x-axis gives the total number of factors extracted and the y-axis represents the eigenvalues.
It was noticed that the factors with an eigenvalue above the value of 1 appeared sharply in the above figure. Then, the curve started to flatten out from component nine where the eigenvalues were below the value of 1. The figure clearly shows that the only retained components are the ones with eigenvalues greater than 1.
Figure 3. The scree plot.
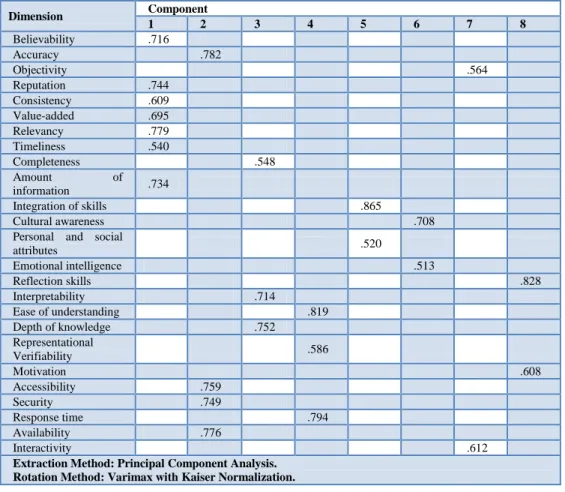
Table 7 shows the rotated components matrix. It is defined as a matrix of the factor loading for each variable onto each factor. Therefore, the table assists in categorising factors into eight components through their loading values. In this analysis, the loadings value of factors less than 0.5 would not be displayed.
In component one, there are seven factors from the 25 quality dimensions, namely believability, reputation, consistency, value-added, relevancy, timeliness, and amount of information. Component two comprises accuracy, accessibility, security and availability; component three completeness, interpretability, and depth of knowledge; and component four ease of understanding, representational verifiability, and response time; component five the integration of skills and personal and social attributes; component six objectivity and interactivity; and the last component has two quality dimensions, reflection skills and motivation.
SPSS attempts to correlate the most significant factors with high variance. According to total variance explained in Table 6, there are eight factors with higher variance than the remaining factors. The scree plot in Figure 3 confirmed this finding, the eight factors with eigenvalue above being sharply delineated. Table 8 shows the output from SPSS after grouping the quality dimensions into eight factors.
Table 7. Rotated component matrix. Dimension Component 1 2 3 4 5 6 7 8 Believability .716 Accuracy .782 Objectivity .564 Reputation .744 Consistency .609 Value-added .695 Relevancy .779 Timeliness .540 Completeness .548 Amount of information .734 Integration of skills .865 Cultural awareness .708
Personal and social
attributes .520 Emotional intelligence .513 Reflection skills .828 Interpretability .714 Ease of understanding .819 Depth of knowledge .752 Representational Verifiability .586 Motivation .608 Accessibility .759 Security .749 Response time .794 Availability .776 Interactivity .612
Extraction Method: Principal Component Analysis. Rotation Method: Varimax with Kaiser Normalization.
Table 8. The SPSS output.
Factor
Number Quality Dimensions
1 Believability Reputation Consistency Value-added Relevancy Timeliness Amount of information 2 Accuracy Accessibility Security Availability
3 Completeness Interpretability knowledge Depth of
4 Ease of understanding Representational Verifiability Response time 5 Integration of skills
Personal and social attributes
6 awareness Cultural intelligence Emotional
7 Objectivity Interactivity
6. The Revised Quality Framework
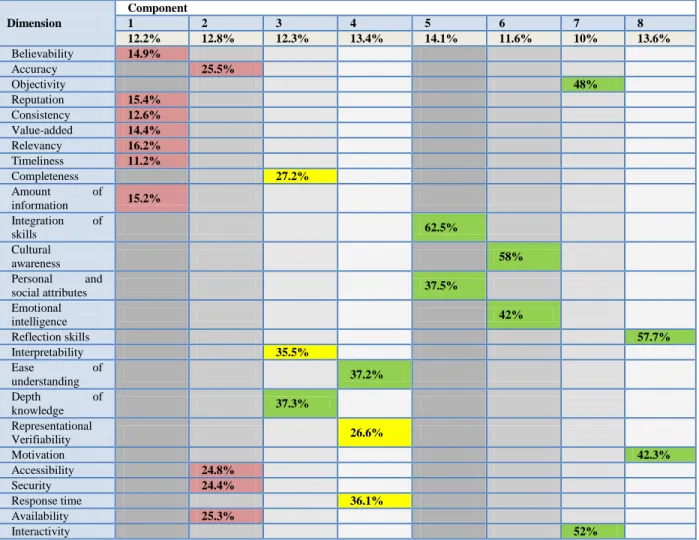
This principal component analysis finding, to calculate the percentage of relative importance of each factor and its quality dimensions, is significant. The percentage comparison would justify the most important factor as well as the most important quality dimensions. Also, the new, re-arranged quality dimensions from the finding with an extended number of factors tended to improve the extended version of the quality information framework to a revised quality framework.
Table 9 shows that the most important component is number five, with a percentage of 14.1%. It comprises two quality dimensions, namely integration of skills, and personal and social attributes. The most important dimension is integration of skills with a value of 62.5%. Other important quality dimensions are cultural awareness, reflection skills, interactivity, objectivity, motivation, emotional intelligence, personal and social attributes, depth of knowledge, and ease of understanding with percentages of 58%, 57.7%, 52%, 48%, 42.3%, 42%, 37.5%, 37.3%, and 37.2% respectively.
Table 9. Percentage of relative importance. Dimension Component 1 2 3 4 5 6 7 8 12.2% 12.8% 12.3% 13.4% 14.1% 11.6% 10% 13.6% Believability 14.9% Accuracy 25.5% Objectivity 48% Reputation 15.4% Consistency 12.6% Value-added 14.4% Relevancy 16.2% Timeliness 11.2% Completeness 27.2% Amount of information 15.2% Integration of skills 62.5% Cultural awareness 58% Personal and social attributes 37.5% Emotional intelligence 42% Reflection skills 57.7% Interpretability 35.5% Ease of understanding 37.2% Depth of knowledge 37.3% Representational Verifiability 26.6% Motivation 42.3% Accessibility 24.8% Security 24.4% Response time 36.1% Availability 25.3% Interactivity 52%
The principal component analysis calculated the relative importance of each quality dimension from the extended quality framework. The 25 quality dimensions were divided among eight factors instead of
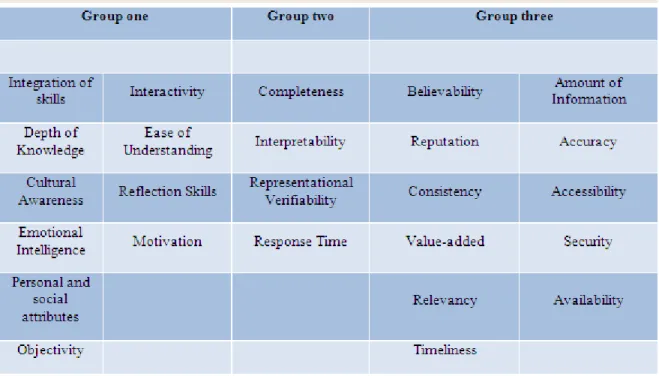
five as proposed in the extended quality framework. Figure 4 shows that the authors made some changes in order to categorise the eight factors into three main groups: group one for the highly important quality dimensions, group two for medium importance quality dimensions, and the low level dimensions.
Figure 4. The revised quality framework.
The figure presents the revised framework. It shows the three groups of quality dimensions that affect the SBL-to-WBL transition module. The groups were ranked in accordance with their importance. The authors believe that the new revised quality framework verified the findings from the users’ effectiveness questionnaire.
7. Conclusion
Users’ views were quantitatively analysed, using a questionnaire as a tool to diagnose, monitor and evaluate the effectiveness of the new SBL-to-WBL transition module. The questionnaire questions were produced from an extended quality information framework. It was found that the most important quality dimensions had been integrated well into the content of the new module. The impact of those quality dimensions reflected how well the work preparation skills were integrated in the learning content of the new module. A revised quality information framework was validated and ranked the quality dimensions by their importance in the new module for SBL-to-WBL transition.
References
[1] Quality Assurance Authority for Education & Training (QAAET) (2010): Review Reports- Educational and Vocational Education. Available from: http://en.qaa.bh/reviewreports.aspx [Accessed: May 26, 2011].
[2] Wang, R. Y. & Strong, D. M. (1996): Beyond Accuracy: What data quality means to data consumers,
Total Data Quality Management Programme.
[3] Alkhattabi, M., Neagu, D. & Cullen, A. (2010): "Information Quality Framework for e-Learning Systems", Knowledge Management and E-Learning: An International Journal, vol. 2, no. 4.
[4] Alseddiqi, M. & Mishra, R. (2011): Measuring the effectiveness of an on-line school-to-work
transition module, The International Conference on E-Learning in the Workplace 2011,
www.icelw.org, June 8th-10th, New York: USA.
[5] Alseddiqi, M., Mishra, R. & Pislaru, C. (2009): Identification of skills gap between school-based
learning and work-based learning in Technical and Vocational Education in Bahrain, Computing and Engineering Researchers’ Conference, University of Huddersfield, Huddersfield: U.K.
[6] Oppenheim, A. (2001): Questionnaire design, interviewing and attitude measurement, Continuum,
London.
[7] Cooper, D. & Schindler, P. (2006): Business Research Methods,9th edition, McGraw-Hill International,
USA.
[8] Oppenheim, A. N. (1992): Questionnaire design, interviewing, and attitude measurement, Continuum, London.
[9] Saunders, M. N., Thornhill, A. & Lewis, P. (2003): Research Methods for Business Students, Prentice
Hall, London.
[10] Cooper, D. & Schindler, P. (2008): Business Research Methods,10th edition, McGraw-Hill
International, USA.
[11] Kinnear, P. & Gray, C. (2010): PASW 17 Statistics Made Simple: Replaces SPSS Statistics 17, East
Sussex:, Psychology Press.
[12] Sinn, J. (2011): SPSS Guide: Correlation and Regression, Available from: