2014
PERFORMANCE
MANAGEMENT
REPORT
2014
PERFORMANCE
MANAGEMENT
REPORT
NEVADA DEPARTMENT OF TRANSPORTATION
December 2014
2014
PERFORMANCE
MANAGEMENT
REPORT
2014
PERFORMANCE
MANAGEMENT
REPORT
Prepared by the
Performance Analysis Division
NEVADA DEPARTMENT OF TRANSPORTATION1263 SOUTH STEWART STREET CARSON CITY, NV 89712
www.nevadadot.com Rudy Malfabon, P.E.
Director Brian Sandoval Governor
2014
PERFORMANCE
MANAGEMENT
REPORT
2014
PERFORMANCE
MANAGEMENT
REPORT
TABLE OF CONTENTS
DEPARTMENT VISION, MISSION, AND GOALS... 1
INTRODUCTION ... 2
PERFORMANCE MANAGEMENT DASHBOARD (EXECUTIVE SUMMARIES) ... 3
EXECUTIVE SUMMARY ... 5
PERFORMANCE MEASURES ... 7
PERFORMANCE DASHBOARD... 8
DETAILED PERFORMANCE MANAGEMENT DATA ... 17
STATE HIGHWAY FUND ANNUAL REVENUE AND EXPENDITURES... 89
MAJOR PROJECTS ANNUAL STATUS REPORT... 94
TYPICAL PROJECT DEVELOPMENT PROCESS... 95
PROJECT STATUS SHEET EXPLANATION... 96
MAJOR PROJECTS SUMMARY SHEETS ... 97
APPENDICES ... 129
APPENDIX A... 130
BENEFIT-COST ANALYSIS OF CAPACITY PROJECTS... 131
DISCUSSION OF THE CALCULATIONS OF COSTS AND BENEFITS ... 133
APPENDIX B... 138
PROJECT PRIORITY RATIONALE... 139
APPENDIX C... 143
PERFORMANCE MANAGEMENT PLAN ... 144
APPENDIX D... 155
State of Nevada Transportation Board Members
Brian Sandoval Chairman/Governor
Brian Krolicki Vice Chairman/Lt. Governor
Kim Wallin State Controller
Tom Skancke Member - District 1
Frank Martin Member - District 1
Len Savage Member - District 2
Tom Fransway Member - District 3
NDOT Administration
Rudy Malfabon Director
Bill Hoffman Deputy Director
Tracy Larkin-Thomason Deputy Director Southern Nevada
John Terry Assistant Director Engineering
Reid Kaiser Assistant Director Operations
Sondra Rosenberg Assistant Director Planning
Robert Nellis Assistant Director Administration
NDOT Staff Involved
Peter Aiyuk – Chief Performance Analysis Engineer Amir Soltani – Chief of Project Management
Anita Bush – Chief Maintenance and Operations Engineer Jennifer Eyerly – Chief of Administrative Services
Ken Mammen – Chief Traffic-Safety Engineer Jeff Shapiro – Chief Construction Engineer Kimberley King –Human Resources Manager Mark Evans – Training Manager
Oscar Fuentes – Safety Manager Mark Elicegui – Chief Bridge Engineer Kenneth Lee – Equipment Superintendent Paul Saucedo – Chief of Right-Of-Way Paul Frost – Chief Roadway Design Natalie Caffaratti – Scoping Manager
Darin Tedford – Assistant Chief Materials Engineer Sean Sever – Chief of the Communications Office
1
DEPARTMENT VISION, MISSION, AND
GOALS
MISSION
Providing a better transportation system for Nevada through our unified and dedicated
efforts
VISION
The Department is the nation’s leader in delivering transportation solutions,
improving Nevada’s quality of life.
STRATEGIC PLAN GOALS
Optimize safety
Be in touch with & responsive to customers
Innovate
Be the employer of choice Deliver timely & beneficial projects &
programs
Effectively preserve & manage our assets Efficiently operate the transportation
system
CORE VALUES
Integrity – Doing the right thing Honesty – Being truthful in our actions and
our words
Respect – Treating others with dignity Commitment – Putting the needs of the
Department first
Accountability – Being responsible for our actions
MISSION, VISION GOALS, and
INTRODUCTION
NDOT’s Performance Management is a collaborative process in which all major divisions of the department are involved in monitoring their annual and ultimate performance targets resulting in a customer-oriented, balanced, effective, efficient, transparent and performance-based decision making process. It is a dynamic process and improvements are incorporated into the performance management process as needed. NDOT’s performance management plays a vital role in the performance-based decision making process. It: 1) ensures investment accountability and transparency, 2) tracks and monitors system performance, 3) helps identify and implement efficient and cost effective performance-based programs, 4) links projects to the vision, mission, and goals of the department, 5) helps align performance targets with customer expectations, and 6) helps in delivering high quality projects. The Nevada 2007 Legislative Assembly Bill 595 requires the Department to develop a performance management plan for measuring its performance, which must include performance measures approved by the Board of Directors of the Department. The specific requirements of the Assembly Bill 595 are as follows:
1. Section 47.2 – Annual Report on Performance Measures and General Project Information
Prior to December 31 of each year, the Director of the Department of Transportation shall prepare a report as follows:
• Goals and objectives of the department and current status of meeting those goals
• Schedule, scope, cost and progress of any current or proposed highway project
• Funding sources, amount and expenditures of the department
• The rationale used to establish priorities
• Transportation Board and Legislative Directives
• Recommended Plan Amendments
2. Section 47.3 – Annual Report on Cost-Benefit Analysis for capacity projects that cost at least $25 million (NRS 408.3195).
The annual report will include the criteria used in the cost-benefit analysis. The resulting benefit/cost ratios will be reported to the Board. Additionally, a written description of the analysis for any project must be submitted to the Board before the Board approves funds for project construction.
3. Section 55.3 – Annual Report on projects funded through the Las Vegas Convention and Visitors Authority funding.
The report will include funding, descriptions, status, timelines, and information on the completed projects, if any (NRS 244A.638).
4. Section 55.5 – Quarterly Report on General Project information for the Blue Ribbon Task Force projects and any proposed super and mega (major) highway projects.
The report will include funding, descriptions, status, timelines, and information on the completed projects, if any. Submit report to the Governor and the Director of the Legislative Counsel Bureau for transmittal to the Interim Finance Committee.
3
PERFORMANCE MANAGEMENT
DASHBOARD
(EXECUTIVE SUMMARIES)
PERFORMANCE MANAGEMENT
DASHBOARD
(EXECUTIVE SUMMARIES)
EXECUTIVE SUMMARY
NDOT’s Performance Management is a collaborative process in which all the major divisions of the department are involved in monitoring their annual and ultimate performance targets resulting in a customer-oriented, balanced, effective, efficient, transparent and performance-based decision making process. It is a dynamic process and improvements are incorporated into the performance management process as needed. NDOT’s performance management plays a vital role in the performance-based decision making process. It 1) ensures investment accountability and transparency, 2) tracks and monitors system performance, 3) helps identify and implement efficient and cost effective performance-based programs, 4) links projects to the vision, mission, and goals and objectives of the department, 5) helps align performance targets with customer expectations, and 6) helps in delivering high quality projects.
NDOT has established 15 performance measures to track, monitor, and report performance of the major divisions and program areas. NDOT’s performance management system focuses on the critical aspects of a cohesive, integrated, and performance-driven approach. NDOT’s senior management is actively involved in the performance management process and supports the performance management process by conducting quarterly performance management updates to help guide the various program areas in meeting their targets. NDOT’s performance management system empowers staff to take ownership of the program, holds staff responsible for their division’s performance, helps diagnose and address problems faced by the divisions in meeting their targets, and effectively communicates its performance-based decision making process to the public and the legislature.
In Fiscal year 2014,NDOT continued to monitor its performance-based management process. The
performance management dashboard, and the detailed data trends sections of this report provides further information regarding NDOT’s performance in Fiscal Year 2014.
6
NDOT STRATEGIC PERFORMANCE MANAGEMENT PROCESS
NDOTs Strategic Performance Management process is guided by comprehensive input from 1) our customers in the form of surveys and direct two-way communications, 2) the State Legislature and decision makers, 3) leadership, commitment, and support from NDOT top management, and 4) collaborative team support from the major divisions and program areas of NDOT. The process is part of the performance-based decision making process that includes identifying realistic and specific performance measures, establishing measurable and attainable targets, developing comprehensive and effective strategies to help achieve the targets, quarterly data collection and monitoring, and evaluating strategies to help allocate our resources most effectively and efficiently. The following graph shows the performance management process,
PERFORMANCE MEASURES
1.Reduce Work Place Accidents
2.Provide Employee Training
3.Improve Employee Satisfaction
4.Streamline Agreement Process
5.Improve Customer and Public Outreach
6.Reduce and Maintain Traffic Congestion
7.Streamline Project Delivery- Bidding to Construction
8.Maintain State Highway Pavement
9.Maintain NDOT Fleet
10.Maintain NDOT Facilities
11. Emergency Management, Security and Continuity of
Operations
12.Reduce Fatal Crashes
13.Project Delivery- Schedule and Estimate for Bid
Advertisement
14.Maintain State Bridges
15.Streamline Permitting Process
8
PERFORMANCE DASHBOARD
The following Performance Management Dashboard provides an executive summary of each of the 15 performance measures and shows the status of the performance measure in Fiscal Year 2014. Detailed information regarding each performance measure is provided in the “Performance Management Detailed Data Trends” section of this report.
Executive Summary: This Performance Measure has two parts to measure both the rate of work place injuries/illnesses and the severity of employee workplace injuries/illnesses. Comparing Calendar Year 2013 to Calendar Year 2012, work place accidents increased by 4.7 % and medical claims decreased by 11%. The total number of work place injuries increased by 8, while the total number of medical claims decreased by 12. Target one was not met because we attained a 4.7% increase compared to the target of 10% annual decrease, while target 2 was met by achieving 11% decrease compared to the annual target of 10% decrease.
For detailed information about performance measure 1, please refer to page 19.
1. Reduce Work Place Accidents
0 2 4 6 8 10 12 14 2008 2009 2010 2011 2012 2013 12.44 9.4 10.4 10 9.6 10 6.3 7 7.9 7.3 6.4 5.3
Injuries/Medical Claims Per
100 Employees
Injuries/100 Employees Medical Claims/100 EmployeesExecutive Summary: During FY 2014, 3,527 employees attended required training sessions. The target is 100% compliance overall and the FY14 target was 78%. The average for the 11 required classes was 79% which shows an increase of 9.1% from last fiscal year’s average of 69.9%. For detailed information about performance measure 2, please refer to page 24.
Executive Summary: Percentage of Employees satisfied with the NDOT work environment. The percentage of employees surveyed who are extremely or somewhat satisfied with NDOT is currently 51%.
For detailed information about performance measure 3, please refer to page 29.
2. Provide Employee Training
Average 79% compliance
Current Status: Performance Measure: Percentage Employees Trained
According to Requirements Target
78% compliance annually
3. Improve Employee Satisfaction
51% Satisfied
Current Status: Performance Measure:
10
Executive Summary: During FY 2014 in the 1st & 2nd quarters, NDOT processed 70% of all
agreements within 45 days, and in the 3rd & 4th quarters 78% of all agreements were processed
within 30 days.
In the 1st and 2nd quarters the average number of calendar days to process an agreement excluding
Cooperative and LPA agreements was 27 days, with 84% of agreements executed within 45 days. In the 3rd& 4thquarters the average number of days to execute agreements was 19 days.
For detailed information about performance measure 4, please refer to page 33.
Executive Summary: In fiscal year 2014 a survey was conducted by the University of Nevada, Las Vegas, sponsored by the NDOT to determine customer satisfaction and rate certain services provided by the department. Survey questions and the responses have been grouped into four major categories which have been weighted. Overall, 71.4% of all citizens surveyed were satisfied with the services provided by the NDOT. For detailed information about this Performance Measure, please refer to page 37.
4. Streamline Agreement Process
70% Processed Within 45 Days & 78% within 30 days.
Current Status: Performance Measure: 1st& 2ndQtrs
Percentage Agreements Processed
Within 45 days Target
90% Annually
50% Annually
Performance Measure: 3rd& 4thQtrs
Percentage Agreements Processed Within 30 days Target Current Status 50% 55% 60% 65% 70% 75% 80% Q1&Q2 Q3&Q4
Percentage of Agreements Executed In FY 2014
. Executive Summary: In the past including FY 2013 NDOT met its goals for system-wide Congestion Monitoring and Tracking System. The monitoring and tracking system was used in determining the congestion on the state maintained roadways in the core urban and rural areas. At present, the Department is in the process of developing a more practical, simple and robust methodology for Congestion tracking and measurement that will also enable and identify locations within the State network system that experience higher than the threshold congestion levels. Performance Analysis Division is working with Traffic Operations and Traffic Information Divisions in formulating this new approach.
For detailed information about the last state-wide Congestion Monitoring and Tracking System performance measure, please refer to page 42.
Definition of Level of Service D – Roadways operating at up to 8 miles per hour less than the Free Flow Speed or Posted Speed Limit, and the traffic carrying capacity of the roadway is less than 0.9.
Customer Satisfaction Satisfied Dissatisfied
Travel Time 70.52% 12.61% Minimize Congestion 57.56% 20.78% Congestion Acceptable 68.96% 31.04% Safety 64.58% 17.75% Notificaton 62.45% 16.55% Community 40.86% 20.12% Time 30.86% 46.61%
Overall Completed Work 79.66% 8.77% Rest area 65.17% 18.35% Weigh station 58.38% 9.61% Warning 71.25% 13.77% Debris 77.76% 9.01% Striping 66.54% 18.75% Signs 77.46% 8.41% Lighting 64.28% 16.71% Drains 56.40% 17.67% Snow 56.50% 6.98% Overall Safety 86.53% 13.47% Efforts to keep drivers
aware of issues 68.04% 7.44% Agree Disagree Fuel Tax 54.86% 18.84% Tolls 21.82% 58.17% Rush Hour 16.14% 67.07% VMT 47.56% 27.21%
Positive Experience Not Positive Exp Contact NDOT 79.55% 20.45% 64.41% 16.55% 35.10% 42.82% Congestion Construction Zones Commercial Truck Safety Funding Average Average
6. Reduce and Maintain Congestion Levels on
the State Maintained Roadway System
12
Executive Summary: During FY 2014, NDOT kept 92% of its projects on schedule and 76% of the projects within budget on average. For detailed information about performance measure 7, please refer to page 44.
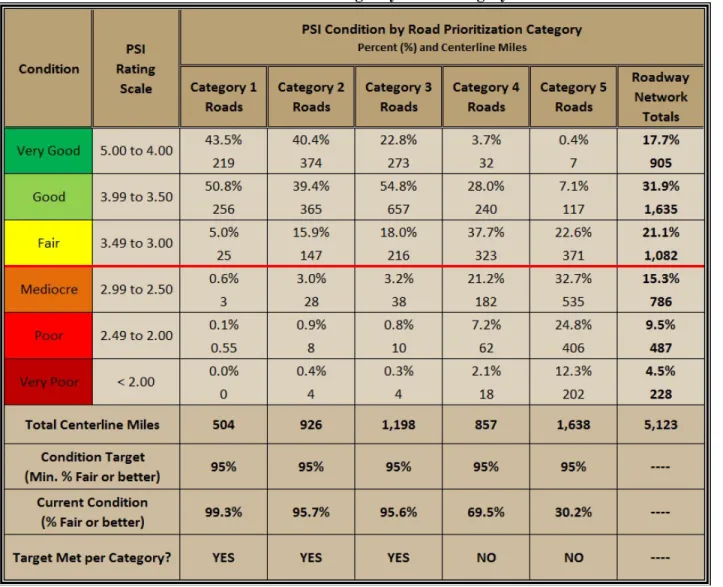
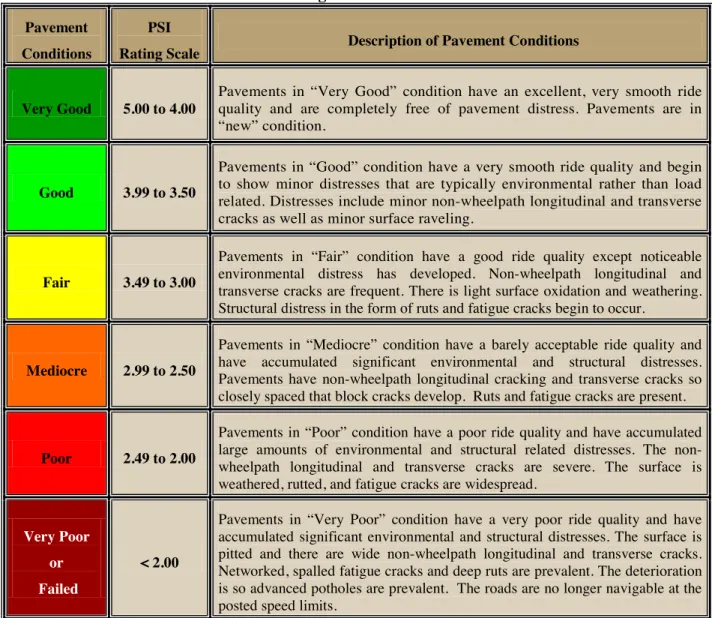
Executive Summary: This Performance Measure is reported by calendar year. During Calendar Year 2013, NDOT was unable to address the needs of categories 4 and 5 roadways to bring them up to the minimum condition target of 95%. Categories 1, 2, and 3 all met their performance target. For detailed information about performance measure 8, please refer to page 48.
7. Streamline Project Delivery – Bid Opening
to Construction Completion
8. Maintain State Highway Pavement
Current Status: Performance Measure: State Roadways maintained at “Fair or Better” condition Target
Category 1: 95% Category 2: 95% Category 3: 95% Category 4: 95% Category 5: 95% Category 1: 99.3% Category 2: 95.7% Category 3: 95.6% Category 4: 0% Category 5: 0% Category 4: 69.5% Category 5: 30.2%
Executive Summary: During FY 2014, the percentage of the NDOT mobile equipment fleet requiring replacement increased by 13% over the prior year. The percentage of the fleet in compliance with preventive maintenance requirements to ensure the expected life of our vehicles is not compromised increased by 1.9% over the prior year. Performance measure 1 was not met, while Performance Measure 2 was met.
For detailed information about performance measure 9, please refer page 56.
Executive Summary: During FY 2013, NDOT incorporated a new method to measure the performance of the facility conditions that included finer details that did not exist before. This new methodology impacts comparative analysis of data if tracked prior to 2013. For fiscal year 2014, there was a 1% increase of percentage of facilities conditions up to code compared to fiscal year 2013. This fell short of the target of 3% annual increase.
For detailed information about performance measure 10, please refer to page 59.
9. Maintain NDOT Fleet
With Respect to 2007 1) 18.34% Increase
Current Status:
Performance Measure:
1) Percentage Mobile Equipment In Need Of Replacement
2) Percentage Fleet In Compliance With Condition Criteria
Target 1) 1% Annual Decrease2) 1% Annual Increase
2) 11.24% Increase
10. Maintain NDOT Facilities
FY 2008 2009 FY 2010 FY FY 2011 2012 FY 2013 FY 2014 FY 100% 100% 100% 100% 100% 100% 100% 82% 82% 86% 88% 87% 55% 56% Pe rce nt Performance
14
Executive Summary: Our performance measures require us to train, exercise and update our Emergency Operations and Security Plans on a two year cycle. We have combined several plans into two which has made it easier for Department personnel to locate, use and understand the plans. For fiscal year 2014 we achieved 87.5% compliance level, which did not meet our goal for the year of 100% compliance. For detailed information about performance measure 11, please refer to page 64.
Executive Summary: During FY 2014, NDOT continued to work with our partners to implement the strategies of the Strategic Highway Safety Plan. For fiscal year 2013, the five year rolling average of fatalities was 255 compared to the pre-set target five year rolling average of 270. This led to a 5.6 percent decrease in fatalities which is higher than the Performance Measure target of 3.1% reduction of five year rolling average.
Because of the lag in fatal data information, the data presented for this Performance Measure is a recalculation of 2013 data and YTD 2014 data. The complete FY 2014 data will be provided in the 2015 Performance Management Report.
For detailed information about performance measure 12, please refer to page 70.
11. Emergency Management, Security, and
Continuity of Operations
12. Reduce Fatal Accidents
5.6% Reduction in the 5-year rolling average
Current Status:
Performance Measure:
Number of fatalities on Nevada's streets and highways Target
3.1% Reduction of 5 year rolling average
Executive Summary: This performance measure has been established as the percentage of scheduled projects advertised within the reporting year and the percentage of scheduled projects within the established construction cost estimate range.
For detailed information about performance measure 13, please refer to page 74.
Executive Summary: During calendar year 2013, NDOT rehabilitated 2 bridges which were functionally obsolete.
For detailed information about performance measure 14, please refer to page 80.
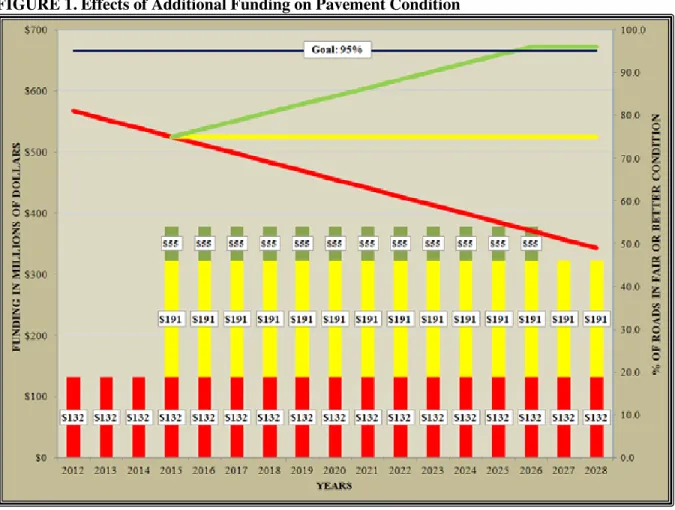
*Graph based on 2013 Preservation Report data
13. Streamline Project Delivery - Schedule
and Estimate for Bid Advertisement
Current Status:
Performance Measure:
1) Percentage Projects scheduled advertised within the reporting year. 2) Percentage Projects scheduled delivered
within established cost estimate range
Target
1) Advertised within the reporting year - 70% 2) Delivered within established cost estimate range – 70% 1) 75% Performance 2) 25% Performance
14. Maintain State Bridges
0 10 20 30 40 50 19 98 20 00 20 02 20 04 20 06 20 08 20 10 20 12 45 36 35 27 20 20 18 19 16 17 21 11 17 30 24 28 N o. o f B rid ge s Year
16
Executive Summary: During FY 2014, NDOT Right-Of-Way Division processed 96.86% of encroachment permits within 45 days. Transportation Policy (TP) 10-1-3 ENCROACHMENT PROCESSING TIME SCHEDULE is to ensure timely and quality service for NDOT encroachment permit customers.
For detailed information about performance measure 15, please refer to page 87.
15. Streamline Permitting Process
96.86% Processed Within 45 Days Current
Status: Performance Measure:
Percentage Encroachment Permits
Processed Within 45 Days Target
DETAILED PERFORMANCE
MANAGEMENT DATA
DETAILED PERFORMANCE
MANAGEMENT DATA
19
Performance Measure:The rate of injuries is reported as the number of work place injuries and illnesses (i.e. number of C-1 forms filed) per C-100 employees and number of injuries and illnesses requiring medical attention (i.e. number of C-3 forms filed) per 100 employees as documented through annual OSHA 300 Log Reporting data. Data is based on calendar year per federal reporting requirements.
Annual Target: 10 % Reduction Ultimate Target: Zero
Strategy Plan Support:
Safety extends to all aspects of the Department from the roadways to the office. Identifying and reducing risk to the Department, our employees and the public is continuous. This performance measure works towards meeting the Department of Transportation Strategic Plan goals to: Optimize Safety and Be the Employer of Choice.
Measurement and Supporting Data:
Calendar Year 2008 2009 2010 2011 2012 2013
Total # of Injuries 221 168 187 178 170 178
# Injuries/All Employees 12.44% 9.4% 10.4% 10% 9.61% 10%
Total # Medical Claims 139 130 116 95 110 98
Medical/Employees 7.9% 7.3% 6.4% 5.3% 6.2% 5.51%
Average Claim Cost $8,680 $8,984 $7,361 $10,051 $9,192 $12,273
0 2 4 6 8 10 12 14 2008 2009 2010 2011 2012 2013 12.44 9.4 10.4 10 9.6 10 6.3 7 7.9 7.3 6.4 5.3
Injuries/Medical Claims Per 100 Employees
Injuries/100 Employees Medical Claims/100 Employees
0 50 100 150 200 250 300 2006 2007 2008 2009 2010 2011 2012 2013 109 122 139 130 116 95 110 98 208 275 221 168 187 178 170 178
Number of Injuries & Claims
21
The annual Baseline is the average of 2008 through 2013. Data is reported on a calendar year pursuant to federal OSHA reporting and State total is the average number of employees during any given quarter or year. Claim costs include all medical expenses and any reserves. The number of injuries reported by the end of CY2013 indicates that the injury rate is 96%of CY2012. The target to reduce injuries by 10% was not met by the end of the year for total injuries, but injuries were reduced by 4%.The majority of injuries sustained in CY2013 were due to lifting, struck by, and slip and falls which are three of the top four causes of injuries per Federal OSHA. The number of struck by claims (14) remained the same for CY2012 and CY 2013. The number of lifting claims went from (13) in CY 2012 down to (12) in CY 2013.
Strategies for Improvement in Calendar 2014 Short range to next reporting:
Continue outreach efforts and supporting the Training Section. Claim costs has been added to the data and the Safety and Loss Control Section has worked diligently with the agencies third-party administration overseen by the State of Nevada Risk Management Division to provide the best medical treatment for the agencies employees and methods to control costs. Strategies may include analysis to determine whether leading indicators such as the impact of safety training could be used rather than lagging indicators such as injury data.
Long range:
1) To continue identifying specific safety training that can be conducted by existing staff and take cooperative steps to insure courses are conducted, including Global Harmonization System refresher, CPR/First Aid, New Employee Safety Orientation, and OSHA mandated classes. 2) To take steps to update the worker compensation databases to insure accurate and consistent reporting. 3) As time and resources permit, to continue efforts to develop and distribute an Employee Safety Survey in order to assess the agency’s culture or attitude as it pertains to safety; and to evaluate the responses to determine areas of need within the safety program. 4) Increase travel budget for an effective safety presence at construction worksites, maintenance shops, yards and rural locations. The Safety Trainer will conduct safety training classes to all Districts, Divisions, and Maintenance Departments.
ANNUAL EVALUATION OF PERFORMANCE MEASURE Were the targets met? Yes
What 'Strategies for Improvement' were successful?
Increased communications by providing a safety calendar and bi-monthly safety e-mails have increased safety awareness and have prompted an overwhelming input from workers that are committed to improve the safety program. Since filling the vacant Safety/Loss Control Coordinator position in 2009 it increased the safety presence in the field and communications have been well received by all Districts, Divisions, and Maintenance Departments.
As indicated in the CY 2012 performance measures report (13) motor vehicle/heavy equipment accidents were reported. In CY2013 those types of accidents decreased to (3). A joint effort with all Districts was developed to reduce those accidents by conducting additional training and performing frequent pre-trip and post-trip inspections of all vehicles.
The Safety/Loss Control Coordinator conducted the majority of CPR/First Aid and AED training. This was completed and all of the Districts have safety staff certified to teach CPR/First Aid and AED. Additional AED units were purchased by District I and District II for construction crews. A new vehicle database was created by the Safety and Loss Control Section and maintained by the Safety Manager. The database has worked effectively to reduce motor vehicle and heavy equipment accidents in all Districts.
Cooperative efforts between the Training Section and Safety and Loss Control to implement a learning management system to track all training were successful. Several mandatory safety courses were identified in the system, specifically targeting new hires or new supervisory staff. What 'Strategies for Improvement' were not successful? Why?
The workers’ compensation MicroNiche software was installed and operational, but due to the complexity of the software restrictions, another software program was selected to meet the needs of the agency. The JJ Kellar workers’ compensation software program is fully operational. Does this performance measure effectively measure what is desired?
Yes.
Is there a better performance measure that should be considered? Not at this time
Will meeting the next yearly target have a fiscal impact? If so, explain.
There will be an increased cost to the Safety/Loss Control travel budget due to additional training conducted by the Safety Trainer and increased safety inspections.
Performance Measure:
Percentage of employees trained in accordance with prescribed training plans and State statute training requirements.
Ultimate Target: 100% compliance for all required training FY14 Target: 78% compliance for all required training Measurement and Supporting Data:
Total Employees
Requiring Training*
% in compliance** for FY # Trained in FY
Requirement 2012 2013 2014 2014
Alcohol & Drug Program 485 58 77 88 165
Defensive Driving 1630 - 67 78 380
EEO 485 59 80 82 144
EEO -Online 485 - 62 73 118
Employee Appraisal/Work
Performance Standards 485 69 79 77 149
Global Harmonized System
of Hazard Communication 1630 44 59 78 376
Grievance Procedures 485 64 79 80 165
Internet Security Awareness 1630 - 29 65 647
Interviewing & Hiring 485 66 82 78 135
Progressive Discipline 485 63 79 78 138
Sexual Harassment
Prevention 1630 85 76 93 1110
*Number of employees and supervisors on 6/30/14 **The frequency of required attendance ranges from one time only to once every two years.
25
0 10 20 30 40 50 60 70 80 90 100Alcohol/Drug Defensive Driving EEO EEO Online
% in co m pl ia nce Course Title FY12 FY13 FY14
0 10 20 30 40 50 60 70 80 90
EA/WPS Global Harmonization Grievance Procedures Internet Security
% in co m pl ia nce Course Title FY12 FY13 FY14
Overview:
NDOT strategies for meeting this performance measure are working. Overall, the average number of people in compliance has increased over nine percentage points from FY2013, and the FY14 target was exceeded by one percentage point. A total of 3,527 seats were filled in the required training classes. Reporting on this performance measure could become even stronger if automated report generation became available, which would allow additional courses to be included in the report.
Were the targets met?
The target is 100% compliance overall and the FY14 target was 78%. The average for the 11 required classes was 79% which shows an increase of 9.1% from last fiscal year’s average of 69.9%. Additionally, the increase in compliance was higher in FY14 than in FY13, with the percentage in compliance increasing by 9.1% in FY14 compared to 6.4% in FY13. Only three classes failed to meet the target of 78%: Employee Appraisal/Work Performance Standards at 77%, the EEO-Online class at 73%, and Internet Security Awareness at 65%. Two of three classes that failed to meet the target are classes that must be taken online and NDOT employees have traditionally preferred live instruction.
Which Strategies for Improvement were successful?
Planning course offerings based on an analysis of how many employees are anticipated to fall out of compliance has been a successful strategy. Reviewing this data each quarter has been helpful in adding new course offerings as needed.
Quarterly follow-up with divisional training coordinator as well as reminders to employees have been helpful strategies in boosting compliance.
0 10 20 30 40 50 60 70 80 90 100
Interviewing & Hiring Progressive Discipline Sexual Harassment Prevention % in co m pl ia nce Course Title FY12 FY13 FY14
27
haveWorking with the divisions and districts and a significant level of support from the Human Resources Division staff have been helpful in improving the accuracy of supervisors and managers being identified as such in the HR Data Warehouse system.
Implementing an online option for the Global Harmonization course has been helpful in boosting completion of this class.
The “Supervisors Hall of Fame” and the “Employee Hall of Fame” have proven to be successful motivation tools.
During Fiscal Year 14, NDOT’s Training Section began working with the agency’s Information Technology division and training staffs from other agencies including the Department of Administration; Department of Corrections; Department of Employment, Training and Rehabilitation; Department of Motor Vehicles; Division of Welfare; and Office of the Controller to work on setting priorities for better reporting through NEATS on mandatory classes.
Which “Strategies for Improvement” were not successful?
The effectiveness of the other strategies for improvement was limited because of time constraints related to implementing them more fully. This included the strategies related to more involvement with Division Heads/District Engineers to promote high compliance numbers and providing additional options to employee with limited computer to access online classes.
What new “Strategies for Improvement” will be initiated in FY 2015? Short range to next reporting:
• Division heads and District Engineers will be enlisted to promote higher compliance
numbers.
• Develop additional options to provide the content of online courses, specifically Internet
Security Awareness and Global Harmonization, to Maintenance Crews with limited computer access.
• Develop additional reporting and promotion of results to motivate employees to attend
training.
• Work on additional options to make completing online classes such as Internet Security
Awareness, EEO Online, and Global Harmonization more convenient for employees.
• Complete the successful transition from using the Learning Portal to NEATS for reporting.
• Find methods other than the Learning Portal to host online courses.
Long range:
• Continue to work with NDOT’s Information Services Division, the State’s Division of
Enterprise IT Services, and other agencies to find improved automated reporting and reminders solutions.
• Add additional classes to the performance measures that are required by Federal and State
regulations for specific positions.
Does this performance measure effectively measure what is desired? Yes.
Is there a better performance measure that should be considered?
As the process and related information systems for reporting this information are improved, additional courses from specific areas should be included.
Will meeting the next yearly target have a fiscal impact? If so, explain.
Required training requires travel money, and budget limitations could have an impact of the availability of training in all locations.
Target for Next Three Fiscal Years:
Assuming no additional classes are added over the years, projected targets are: FY15: 86%
FY16: 94% FY17: 98%
29
Performance Measure:Percentage rating obtained from employees’ satisfaction surveys.
Annual Target: Overall rating 75% Ultimate Target: Overall rating of 80%.
Strategy Plan Support:
Positive employee morale is critical to the success of the workplace. It is the backbone of a skilled and dedicated workforce and essential in attracting and retaining a quality staff. A satisfied workforce will excel at their duties. This benefits the Department and our customers. This performance measure works towards meeting the Nevada Department of Transportation’s Strategic Plan goals to: optimize safety, be in touch with and responsive to our customers, innovate, be the employer of choice, deliver timely and beneficial projects and programs, effectively preserve and manage our assets, and efficiently operate the transportation system.
Measurement and Supporting Data:
Percentage of employees who are extremely or somewhat satisfied with NDOT
FY 2008 (Base Number) 70% FY 2009 67% FY 20010 62% FY 2011 50% FY 2012 48% FY 2013 50% FY 2014 51%
Was the annual target met? No.
Fifty one percent (51%) of employees are extremely or somewhat satisfied with the Nevada Department of Transportation as an employer as compared to seventy percent (70%) the base year. The percentage did increase from fifty percent (50%) last year.
.
The 2008 Performance Measure Survey was launched on July 14, 2008 and closed on August 15, 2008; 764 employees responded to the 2008 survey. The 2009 Performance Measure Survey was launched on July 13, 2009, and closed on August 2, 2009; 616 employees responded to the 2009 survey. The 2010 Performance Measure Survey was launched on May 18, 2010 and closed on June 25, 2010; 905 employees responded to the 2010 survey. The 2011 Performance Measure Survey was launched on June 23, 2011, and closed on July 15, 2011; 598 employees responded to the 2011 survey. The 2012 Performance Measure Survey was launched on May 29, 2012, and closed on July 1, 2012; 718 employees responded to the 2012 survey. The 2013 Performance Measure Survey was launched on June 13, 2013, and closed on July 19, 2013; 621 employees responded to the 2013 survey. The 2014 Performance Measure Survey was launched on June 10, 2014, and closed on July 29, 2014; 1,020 employees responded to the 2014 survey.
Employee participation in the survey increased significantly this fiscal year, and is by far the highest level of participation in the survey to date.
What ‘Strategies for Improvement’ were successful?
The percentage of employees who strongly or somewhat agree that the physical conditions in their work area are good has increased six percent (6%) this year with a four percent (4%) increase from the baseline year. The percentage of employees who strongly agree or somewhat agree that the amount of work that they have is reasonable has increased nine percent (9%) from last year with an overall increase of two percent (2%) from the base year. The percentage of employees who strongly or somewhat agree that there is adequate staffing in their department has increased six percent (6%) from last year with an overall increase of one percent (1%) from the base year. The percentage of employees who strongly or somewhat agree they have been provided appropriate training for their position has increased five percent (5%) from last year and five percent (5%) from the base year.
0 10 20 30 40 50 60 70 2008 2009 2010 2011 2012 2013 2014 70 67 62 50 48 50 51 % Sa tis fac tio n Employee Satisfaction
31
The percentage of employees who strongly or somewhat agree that they have the equipment to dotheir job well increased six percent (6%) this year with a one percent (1%) increase from the baseline year. This increase may be due to the money identified for critical needs vehicles in last year’s strategies. However, there were still comments about unsafe and rundown vehicles.
What ‘Strategies for Improvement’ were not successful? Why?
The overall target was to increase employee satisfaction to seventy-five percent (75%). The percentage of employees who would recommend the Nevada Department of Transportation to a friend as a good place to work was fifty-one percent (51%) in 2014, which is a decrease from seventy-five percent (75%) in 2008 but an increase from forty-five percent (45%) in 2013.
The current economic environment and overall decrease in State pay and benefits is continuing to have a direct impact on the satisfaction of the Nevada Department of Transportation employees. The percentage of employees who are somewhat dissatisfied or extremely dissatisfied with salaries is sixty-one percent (61%). The percentage of employees who are somewhat dissatisfied or extremely dissatisfied with benefits is fifty-two percent (52%). Employees continue to comment that they do not get paid enough.
Many employees mention that they love their job but were discouraged by things such as pay cuts, furloughs, and merit pay freezes. Regarding pay, one employee said, "My main dissatisfaction is regarding salary. NDOT is not competitive with other agencies throughout the state and of course not at all with the private sector. I believe this is one of the reasons the attrition rate is so high."
0 10 20 30 40 50 60 70 80 2008 2009 2010 2011 2012 2013 2014 75 66 42 41 43 45 51 Per cen ta ge Fiscal Year
What ‘Strategies for Improvement’ will be initiated in FY2015? Short range to next reporting:
1. The Department’s Strategic Plan will be reevaluated and updated. The Mission and Goals of the Department will be reemphasized and communicated throughout the Department.
2. The Department will request suggestions from employees on ways of improving NDOT’s communication with employees. Beginning immediately, these suggestions will be collected through the Communications Director. Additionally, next year’s survey will request specific suggestions from employees regarding improving communication.
3. The Department will continue to evaluate pay inequities.
4. Five million dollars has been identified for critical needs light duty vehicles and heavy equipment. The districts and divisions will work with their Assistant/Deputy Directors to identify critical needs light duty vehicles and heavy equipment.
5. We will continue to encourage and require supervisory training, in compliance with regulations, that includes communication, management styles, and coaching. This strategy directly correlates with Performance Measure #2.
6. We will communicate to employees that the survey results have been reviewed. Throughout the year we will communicate with employees and tie those
communications back to the survey results. Long range:
Continue conducting and analyzing annual satisfaction surveys and making appropriate recommendations to the Director’s Office for addressing employee satisfaction.
Does this performance measure effectively measure what is desired?
Yes, this performance measure works towards meeting the Nevada Department of Transportation’s Strategic Plan goals to: optimize safety, be in touch with and responsive to our customers, innovate, be the employer of choice, deliver timely and beneficial projects and programs, effectively preserve and manage our assets, and efficiently operate the transportation system.
Is there a better performance measure that should be considered?
No; however, employee job satisfaction hinges in part on pay and benefits. Until pay and benefits are restored we are not likely to see improvement in the results of the survey.
Will meeting the next yearly target have a fiscal impact? If so, explain. No.
33
Performance Measure:Percentage of Agreements executed within 30 days from when division submits agreement to the date when it is fully executed, excluding time the agreement is with the second party for signature or awaiting Transportation Board approval.
Target: 90%
Strategy Plan Support:
An agreement is the instrument used to procure a variety of services for NDOT. The Agreement Services section ensures that NDOT procures these services in accordance with established laws, rules and regulations. Delays in executing agreements has a tremendous impact on the operations, delaying what can often be critical services, or services that impact the timely delivery of projects. Agreements for services over $300,000 require approval of the Transportation Board; agreements less than $300,000 and certain services exempt from Board approval (such as right of way acquisitions and interlocal agreements) can be executed with approval from the NDOT Director. This performance measure helps meet the department’s mission to provide a better transportation system for Nevada through our unified and dedicated efforts by helping to accomplish the goals of: delivering timely and beneficial projects and programs; being responsive to our customers; effectively preserving and managing our assets; and efficiently operating the transportation system. Summary:
For the fiscal year 2014 there were two different performance measurement data sets. The method of measurement was updated on 1/1/2014 to exclude the number of days an agreement was with the second party for signature and the number of days it was waiting for Transportation Board approval. For quarters 1 and 2 the average number of calendar days for agreements (measured from the time they were submitted to Agreement Services until the time of agreement execution) was 40 days. 70% of all agreements were executed in 45 days or less. This exceeds the annual target of 50%, but falls short of the overall target of 90%.
It is significant to note that Cooperative and Local Public Agency (LPA) agreements took an average of 84 days and 92 days respectively to execute, significantly skewing the overall numbers. The extended length of time to execute is largely due to the time it takes for the outside agency to sign the agreement. Removing the Cooperative and LPA agreements from the data for quarters 1 and 2 shows an average number of calendar days to execute agreements of 27 days, with 84% of agreements executed within 45 days.
For quarters 3 and 4 the average number of days to execute agreements (measured from the time they were submitted to Agreement Services until the time of agreement execution, excluding the
time they were out for second party signature) was 19 days. 78% of all agreements were executed in 30 days or less. This falls short of the target of 90%.
Measurement and Supporting Data: Number of agreements executed Number executed within 45 calendar days % executed within 45 calendar days Number of Cooperative & LPA agreements executed Number of Cooperative & LPA agreements executed within 45 days % Cooperative & LPA agreements executed within 45 days 1st & 2nd Qtr FY 2014 222 155 70% 46 7 15% Number of agreements executed Number executed within 30 days Number executed within 30 days 3rd & 4th
35
*This graph excludes LPA Agreements in Q1 & Q2, and in Q3 & Q4 LPA agreements are not applicable.Strategies for Improvement: As applicable Short range to next reporting:
Train Agreement Services staff on the performance measure process, the goal and purpose of the measure, and how their work impacts the measures. Update agreement manuals, templates and forms. Provide instructional PowerPoint presentations, checklists, and information about the procurement process on SharePoint, and encourage all Department employees who procure services to view the material. Conduct agreement training for Department staff as needed, especially for project managers who do not regularly procure services. Continue to monitor processing of agreements by tracking the progress on the agreement log.
Long range:
Thoroughly assess the current performance measure, data collected, it’s relevance to reporting actual performance, and make revisions as applicable. Have all Agreement Services staff understand the performance measure, what is measured, and how each stage of processing an agreement affects the measure. Provide quarterly feedback to staff about the current processing time, and implement continuous improvements to decrease processing time without sacrificing accuracy and adherence to laws, rules & regulations.
50% 55% 60% 65% 70% 75% 80% Q1&Q2 Q3&Q4
Percentage of Agreements Executed
In FY 2014
YES
Were the targets met? No
What ‘Strategies for Improvement’ were successful?
Tracking agreements using the tracking log was successful in identifying when an agreement had taken longer than it should have to process, allowing Agreement Services to follow up with the Project Manager. Keeping track of the many stages of processing an agreement helped identify where in the process the delay occurred. Training staff on the performance measures helped identify additional key information that would help us track our performance, such as the date the Project Manager sent the agreement to the second party. It also made staff motivated to meet the new target of 90% and to keep that in mind when performing their daily tasks.
What ‘Strategies for Improvement’ were not successful? Why? N/A
What new ‘Strategies for Improvement’ will be initiated in FY2015? Short range to next reporting:
An issue was identified in processing quote agreements, where Agreement Services staff weren’t accepting electronic documents, requiring hard copies to be mailed back and forth several times between the Project Manager, Agreement Services, Legal, and the Director’s Office. The Agreement Services Manager is working to have all staff accept electronic documents in order to more efficiently process quote agreements (other kinds of agreements are already accepted in electronic formats).
In addition, Agreement Services will implement DocuSign to electronically route agreements and possibly agreement-related backup documentation through the approval process using email and online signatures. This should shorten both the time the agreement is within NDOT and the time it takes to obtain second party signature.
Long range strategy:
Implement DocuSign to take full advantage of its efficiencies in getting agreements signed. Implement the Electronic Procurements and Tracking (ePats) system to facilitate agreement tracking. Continue to assess the relevance of performance measure data, revising the measure as necessary to accurately reflect the time it takes to process an agreement.
Does this performance measure effectively measure what is desired? Yes
Is there a better performance measure that should be considered? No
Will meeting the next yearly target have a fiscal impact? If so, explain.
Yes. Procuring services more expediently will make Department operations more efficient, resulting in faster delivery of projects, more timely maintenance of facilities, and an overall higher standard of service provided. This will result in overall cost savings.
37
Performance Measure:Numerical ratings obtained from public opinion and customer/user surveys. Annual Target: Annual increases in public opinion and customer/user ratings. Ultimate Target: Increases in public opinion and customer/user ratings.
Overview of performance measure:
Public opinion, users (customers) as well as elected officials surveys will assess public information, outreach activities, and how well the Department is performing in the eyes of our customers. It is important to know that we are doing the right things to be transparent, accountable, and efficient. This performance measure works toward meeting the Department of Transportation Strategic Plan goals and to be in touch with our customers.
Measurement and Supporting Data:
NDOT contracted with the University of Nevada, Reno (UNR) and University of Nevada, Las Vegas (UNLV) to collect public opinions on the satisfaction level of NDOT’s performance. Two maintenance customer satisfaction surveys of Nevada residents were conducted by the Center for Research Design and Analysis at UNR in conjunction with Maintenance and Operations Division in 2009 and 2011. A comprehensive customer satisfaction survey was accomplished by UNLV in cooperation with the Performance Analysis Division in 2014.
The 2014 customer satisfaction survey was designed and used to gain insights about the public impressions of congestion, construction, maintenance, safety, and funding, as well as to determine differences between different regions in Nevada. The method chosen to collect data involved utilizing the Cannon Survey Center (CSC), operating within UNLV. CSC collected 2,636 responses using a combination of phone interviews, in-person interviews, and online distribution. In addition, 696 responses were collected from several smaller population groups independently from the CSC with the help of a small contractor (ADV Solutions) and the Transportation Research Center (TRC). In most cases, the residents were satisfied with the transportation system in Nevada.
Summary of the survey results:
The following chart and graphs show the customer Level of Satisfaction on the overall NDOT’s performance based on the 2014 Customer Satisfaction Survey.
Customer Satisfaction Satisfied Dissatisfied Travel Time 70.52% 12.61% Minimize Congestion 57.56% 20.78% Congestion Acceptable 68.96% 31.04% Safety 64.58% 17.75% Notificaton 62.45% 16.55% Community 40.86% 20.12% Time 30.86% 46.61%
Overall Completed Work 79.66% 8.77%
Rest area 65.17% 18.35% Weigh station 58.38% 9.61% Warning 71.25% 13.77% Debris 77.76% 9.01% Striping 66.54% 18.75% Signs 77.46% 8.41% Lighting 64.28% 16.71% Drains 56.40% 17.67% Snow 56.50% 6.98% Overall Safety 86.53% 13.47%
Efforts to keep drivers aware of issues 68.04% 7.44% Agree Disagree Fuel Tax 54.86% 18.84% Tolls 21.82% 58.17% Rush Hour 16.14% 67.07% VMT 47.56% 27.21%
Positive Experience Not Positive Exp
Contact NDOT 79.55% 20.45% 64.41% 16.55% 35.10% 42.82% Congestion Construction Zones Commercial Truck Safety Funding Average Average
Customer Satisfaction Satisfied Dissatisfied
Travel Time 70.52% 12.61% Minimize Congestion 57.56% 20.78% Congestion Acceptable 68.96% 31.04% Safety 64.58% 17.75% Notificaton 62.45% 16.55% Community 40.86% 20.12% Time 30.86% 46.61%
Overall Completed Work 79.66% 8.77%
Rest area 65.17% 18.35% Weigh station 58.38% 9.61% Warning 71.25% 13.77% Debris 77.76% 9.01% Striping 66.54% 18.75% Signs 77.46% 8.41% Lighting 64.28% 16.71% Drains 56.40% 17.67% Snow 56.50% 6.98% Overall Safety 86.53% 13.47%
Efforts to keep drivers aware of issues 68.04% 7.44% Agree Disagree Fuel Tax 54.86% 18.84% Tolls 21.82% 58.17% Rush Hour 16.14% 67.07% VMT 47.56% 27.21%
Positive Experience Not Positive Exp
Contact NDOT 79.55% 20.45% 64.41% 16.55% 35.10% 42.82% Congestion Construction Zones Commercial Truck Safety Funding Average Average
Strategies for Improvement: Short Range to next reporting: N/A
Long Range: N/A
Annual Evaluation of Performance Measure Was the annual target met?
41
Since a customer survey was not conducted last year, a comparative analysis could not be done todetermine if the target was met.
What ‘Strategies for Improvement’ were successful? N/A
What ‘Strategies for Improvement’ were not successful? N/A
What new ‘Strategies for Improvement’ will be implemented in FY 2015? Short range to next reporting:
Conduct customer surveys from now forward using the same format and survey questions so comparisons can be made between subsequent years.
Long Range:
Request for permission to conduct Customer Surveys at most every- other year, rather than yearly. This will allow the Department ample time to evaluate the results and make the necessary improvements before the next survey is undertaken. Also, besides cutting down on the cost of yearly surveys, it will not be a nuisance to customers to responding to survey questions.
Is there a better performance measure that should be considered? No
Will meeting the next yearly target have a fiscal impact?
To conduct a well designed public survey is expensive. Analyzing the results takes time which has fiscal implications.
Performance Measure:
Urban roadways – Maintain congestion at Level of Service D for 85% of State urban roadways Rural roadways – Maintain congestion at Level of Service D for 90% of State rural roadways Definition of Level of Service D – Roadways operating at up to 8 miles per hour less than the Free Flow Speed or Posted Speed Limit, and the traffic carrying capacity of the roadway is less than 0.9.
Current Status: N/A
Ultimate Target: Reduce congestion by 1% per year to reach the ultimate target of 90% of State urban roadways at Level of Service D, and 95% of State rural roadways at Level of Service D.
Strategy Plan Support:
This performance measure is one of the most important performance indicators of the NDOT maintained roadway system. It integrates the outcome of our overall investments into one measure that is a direct result of the collaborative efforts of the various divisions of NDOT. It will help reduce congestion and will help identify bottleneck locations on the NDOT maintained roadway system, which will be prioritized for improvements depending upon the funding and resources availability. It works towards meeting the Department of Transportation Strategic Plan to efficiently operate the transportation system by reducing the level of congestion and increasing safety.
This Congestion Monitoring System will be an evolving process and will be updated regularly as more data is integrated into it from the Southern Nevada RTC’s Freeways and Arterials System of Transportation, and the Washoe County’s future Traffic Management Center, Synchro models, and other sources as needed.
Summary:
During FY 2010, NDOT developed its first system-wide Level of Service Monitoring and Tracking system that is used in determining congestion on the state maintained roadways in urban and rural areas. This established the base conditions for the Level of Service monitoring system.
At present, the Department is in the process of developing a more practical, simple and robust methodology for Congestion tracking and measurement that will also enable and identify locations within the State network system that experience higher than the threshold congestion levels. Performance Analysis Division is working with Traffic Operations and Traffic Information Divisions in formulating this new approach.
43
Supporting Documentation:Highway Capacity Manual, AASHTO, Daily Traffic Volume Data, Peak Hourly Volume Data, Truck Percentages, Service Flow tables, Commuter and Non-Commuter Traffic, Roadway Terrain and Grades, Directional Factors, Hourly Factors, Functional Class, Number of Lanes, Free Flow Speed data, Peak Hour Factors, and Peak Service Flow Rates.
Were the targets met? N/A
Methodology is being modified for FY 2014
Does this performance measure effectively measure what is desired? Yes.
Is there a better performance measure that should be considered?
In the modified methodology, other indicators such as vehicle delay and travel time will be evaluated if they could supplement this performance measure in the core urban areas.
Will meeting the next yearly target have a fiscal impact?
Yes. Improving congestion by 1% per year will require investments into the roadway system. The fiscal impact of such improvements will be determined accordingly.
Performance Measure:
Percentage of projects within established range of cost estimate and schedule to completion Strategy Plan Support:
This performance measure works towards meeting the Department of Transportation Strategic Plan goals by providing timely and beneficial construction projects. This measure helps to optimize safety for road users, be in touch with and responsive to our customers (road users), and efficiently operate the transportation system.
Measurement and Supporting Data:
FY 2014 ended with 76% projects reported complete within budget and 92% reported complete within schedule. Historical numbers are shown in the table below:
% Completed Within Budget % Completed On Schedule
FY 2010 96 84
FY 2011 76 86
FY 2012 71 78
FY 2013 76 77
FY 2014 76 92
45
FY 2014 Budget Performance: Performance is based on an average of quarterly reviews of allopen construction contracts (64 – 69 depending on the time of year). This includes active projects where construction activities are ongoing and projects where construction is complete and the contract is being administratively closed out. For the fiscal year an average of 76% of open contracts performed within budget. Of the projects that exceeded budget targets, 68% had change orders in excess of 3% of the bid price. The other projects (32%) resulted from actual pay quantities exceeding estimated pay quantities.
FY 2014 Schedule performance: Performance is based on an average of quarterly reviews of all contracts (16 – 31) depending on the time of year actively under construction. For the fiscal year an average of 92% of active contracts performed within the original scheduled timeframe. Reasons for exceeding schedule targets included but are not limited to encountering utility conflicts, drilled shaft construction issues and increases in the planned quantities.
Strategies for Improvement: Short range to next reporting:
• Continue working with Design to improve the quality of designs
• Minimize avoidable change orders
• Implementation of P6 professional construction scheduling training and specifications
0 10 20 30 40 50 60 70 80 90 100 FY 2010 FY 2011 FY 2012 FY 2013 FY 2014 88 76 71 76 76 95 86 78 77 92 Per cen ta ge Fiscal Year
Percent of Projects Completed On Schedule And Within Budget Constraints
• Continue working to improve management techniques
• Continue active participation of Bid Review and Analysis Team
• Implementation of new Partnering and DRT specifications, training and methods
• Continue with annual RE Academy Training / RE Conferences
• Continue with implementation of electronic documentation software and training
Long range:
Once P6 and eDocumentaions software are fully implemented, refine methods for tracking
budget and schedule performance utilizing the new systems
Develop and standardize one set of performance measures for budget and schedule.
Automate the process so that performance measures are reviewed and discussed at monthly
contract briefing meetings
Were the targets met? Yes with exceptions. Efforts to determine the best parameters for analysis of budget and schedule performance of active, open, and closed contracts will continue. Through progressive review of processes and data sets the Department will promote accuracy and efficiency necessary to evaluate a goal of 80%; NDOT’s goal of 80% for both is being studied and will be maintained for the time being.
What ‘Strategies for Improvement’ were successful? It is difficult to identify a specific short term strategy that was “successful” because measuring budget and schedule performance on a construction project is a somewhat complex process involving many activities, personnel and other factors. Some factors are beyond the control of the NDOT and contractor personnel actively involved in the project (example: market fluctuations in material pricing). Department personnel are actively involved with improving the quality of design, minimizing avoidable change orders, enhancing scheduling techniques and partnering with stakeholders on a daily basis as part of our core mission. We are confident that the implementation of electronic documentation and P6 scheduling software’s will have a direct impact on the success of these performance measures. What ‘Strategies for Improvement’ were not successful? Why? See above.
What new ‘Strategies for Improvement’ will be initiated in FY 2015?
• Staff Accountability: Procedures for upper management reviews of projects with significant
cost and schedule overruns will be fine tuned.
• Contract Closeouts: Efforts are continually ongoing to streamline contract closeouts.
NDOT is putting a high priority on working internally and with contractor to closeout contracts in a timely manner.
• Electronic Documentation: Training and implementation of electronic documentation will
occur during FY 2015increasing our process efficiencies and reduce overall project costs to the Department.
47
• P6 Professional Scheduling: Training and implementation of P6 professional scheduling
software will increase the Departments knowledge of reviewing contractor schedules and ensuring contracts on staying on schedule.
Does this performance measure effectively measure what is desired?
This performance measure is not a direct measure of NDOT’s performance on construction projects due to many factors beyond NDOT’s control (increased / decreased competition, contractor bids, market forces, acts of god, contractor expertise, etc...). But time and money are important factors in any construction project and should be measured. We intend on monitoring similar performance measure research at a national level (AASHTO, FHWA, etc…) to refine NDOT’s methods and improve performance.
Is there a better performance measure that should be considered? No Will meeting the next yearly target have a fiscal impact? If so, explain.
Not monitoring schedule and budget performance can have fiscal impacts related to contractor payments, labor, equipment and material costs, administration costs, roadway maintenance costs, user delay costs, etc… Schedule and budget performance must be monitored to minimize those impacts and attempt to mitigate them.
Performance Measure:
Percentage of state maintained roadways in fair or better condition. Ultimate Target:
Perform annual rehabilitation as necessary to maintain the condition of the roadway network in conformance with the established goals and additional rehabilitation as necessary to eliminate the accumulated backlog.
Annual Target:
Strategy Plan Support:
This performance measure supports the Department’s Strategic Plan to effectively preserve and maintain NDOT’s assets. In order for the Department to maintain the roadway network in fair or better condition, rehabilitation work is performed on the roadways each year. To increase the percentage of pavements in “Fair” or better condition, rehabilitation work must be constructed on all roads in excess of the rate of deterioration of the pavement.
The Department uses its Pavement Management System (PMS) in determining deterioration rates to predict the future condition of pavements and to monitor the condition of all of the state-maintained pavements in order to prioritize which pavements need rehabilitation. Proactive rehabilitation strategies are developed for pavements on a case-by-case basis to accommodate the particular needs of each project.
Proactive pavement rehabilitation is the most cost-effective way to use limited funds. Proactive pavement rehabilitation means working on roads in a timely and economical manner to maintain or improve the roadway network. Reactive pavement rehabilitation means waiting until the pavement has deteriorated below an acceptable level and then performing more expensive rehabilitation construction strategies. Being proactive instead of reactive is 4 to 6 times more cost effective when utilizing transportation funding. However, the use of proactive pavement rehabilitation practices on every road is not possible due to financial constraints.
Measurement and Supporting Data: Category 1: 95% Minimum Category 2: 95% Minimum Category 3: 95% Minimum Category 4: 95% Minimum Category 5: 95% Minimum