Abstract-Containerization is a critical component for
Thailand’s economics. However, forecasts of container
growth and development of Bangkok Port, the main port of
Thailand, have been scant and the findings are divergence.
Moreover, the existing literature emphasizes only two
forecasting methods, namely time series and regression
analysis. The aim of this paper is to explore the use of neural
network for predicting future container throughput at
Bangkok Port. The use of neural network is evident as a
forecasting method for business firms and government
offices but absent in predicting container throughput.
Factors affecting cargo throughput at Bangkok Port are
identified and entered into the neural network forecasting
model that generates a projection of cargo throughput. Then
the results are measured by root mean squared error
(RMSE) and mean absolute error (MAE). Based on the
results, this research provides a discussion on the
application of neural network for forecasting container
throughput.
Index Terms- Forecasting, Neural Networks, Container
throughput
I. INTRODUCTION
Containerization is an important transportation system in the rapid growth of international trade, especially in the country dominating both of importing and exporting like Thailand. Containers are used for shipping many types of goods such as agricultural, consumer, and manufacturing products. The economic expansion increases the volumes of containers at Bangkok Port and the growth of this container throughput is one of the most important determinants of the large investment for container terminal. Therefore, the forecasting accuracy of the future throughput is crucial to both of private sectors and government offices for planning and managing their future development. Private sectors will enhance abilities for the growth of containers both of inbound and outbound. The governments’ offices such as Port Authority, Customs Department and Marine Department will be able to improve daily port operations to serve the growth throughput and to increase productivity and the efficiency of the port. The numbers of containers are central to the planning and the operation of organizations and government transportation department at both micro and macro levels.
Manuscript received April 08, 2010. This work is partially financially supported by University of the Thai Chamber of Commerce (UTCC), Bangkok, 10400, Thailand.
V. Gosasang is now a first-year student in Ph.D. Logistics Program at School of Engineering, UTCC, Bangkok, 10400, Thailand (phone: +668-1341-6590, fax: +662-249-3257, e-mail: [email protected]). W. Chandraprakaikul, EngD., is now a lecturer at School of Engineering, UTCC, Thailand (email: [email protected]).
S. Kiattisin, Ph.D., is now a lecturer at School of Engineering, UTCC, Thailand (email: [email protected]).
In 1994, forecast reports published by Japan International Cooperation Agency (JICA) [1] showed the forecasting volumes of import/export containers at Bangkok Port by using the technique of regression analysis on the two variables: population and Gross Domestic Product (GDP). Nevertheless, JICA’s work has the limitation in presenting inadequate factors that would affect the forecasting accuracy of container throughput volume.
Nowadays, Bangkok Port Authority applies linear regression method and time series to forecast the number of containers in Bangkok Port. The factors adopted in this work [2] include GDP, exchange rate and world GDP. The weakness of this approach is the non-consideration of the regression on the relationship between the volumes of containers and the important macro-economic variables such as interest rate and inflation rate.
Many researchers have been interested in the relationship between factors of economics and the volumes of import and export. Dollar [3] studied the regression method to analyze the relationship between the outward orientation and per capita GDP growth. The results have implied that trade liberalization and exchange rate could improve growth performance in many poor countries. Greenaway and Nam [4] analyzed the various indicators of industrialization and macro-economic. Ram [5] used a regression model to analyze the relationship between the exports and economic growth. Their study has confirmed the strong relationship of the export performance and the economic growth. Chou, Chub and Liang [6] presented the importance of the non-stationary relationship between the volumes of containers and the macro-economic variables. They used volumes of export containers, volumes of import containers, population, industrial production index, GNP, GNP per capita, wholesale GDP, agricultural GDP, industrial
GDP and service GDP for the factors in the regression analysis. This paper is based on the literature gap of the previous work from
Peng and Chu [7]. They suggested neural network model for forecasting container throughput volumes in their paper after they applied six univariate forecasting models. Therefore the authors of this paper intend to explore the neural networks method for predicting the container throughput at Bangkok Port. The factors of consideration in this research include GDP, world GDP, exchange rate (compare to U.S. dollar), population, inflation rate, interest rate and fuel price. The reasons of applying those factors are as follows: 1. Thailand’s Key Economic Indicators are GDP, inflation rate, exchange rate and population [8], [9]. 2. The factors affected to exporting are interest rate, fuel price, exchange
rate and world GDP, and for importing are interest rate, exchange rate,
population, inflation rate and GDP [8], [9]. The structure of this paper is organized as follows: Section 2 reviews
the relevant literature. Section 3 presents the research methodology. Section 4 presents the results and gives a discussion of the results. Finally, some conclusions are provided in Section 5.
II. LITERATURE REVIEW
A. Forecasting technique classification review
Forecasting serves many predicting information. It can help people and organizations planning in the future and making decisions [10]. There are basically three types of forecasting models: Time Series, Cause-and-Effect, and Judgmental [11], [12].
Time series: Time series is an ordered sequence of values of a variable at equally spaced time intervals. Predicting is continuous of historical pattern such as the growth in sale, gross national product or stock market analysis.
The example of time series methods are Autoregressive Moving Average (ARMA), Exponential Smoothing, Extrapolation, Linear Prediction, Trend Estimation, Growth Curve and Box-Jenkins. Time Series Analysis is used for many applications such as: Economic
An Application of Neural Networks for Forecasting
Container Throughput at Bangkok Port
Forecasting, Sales Forecasting, Budgetary Analysis, Stock Market Analysis, Yield Projections, Process and Quality Control, Inventory Studies, Workload Projections and so on. Early attempts to study time series, particularly in the 19th century, were generally characterized by
the idea of a deterministic world. It was the major contribution of Yule
[13] which launched the notion of stochastic in time series by
postulating that every time series can be regarded as the realization of a stochastic process.
ARIMA (Autoregressive Integrated moving average) were
popularized by George Box and Gwilym Meirion Jerkins in early 1970s. The basis of the Box-Jenkins approach to modeling time series consists of three phases: identification, estimation and testing, and application. There are three types of ARIMA: univariate, dynamic or transfer function and VARIMA [14].
The other time series forecasting research, L.R.Weatherford and
S.E.Kimes [15] used data from Choice Hotels and Marriott Hotels to test a variety of forecasting methods and to determine the most accuracy method. The methods are simple exponential smoothing, moving average methods, linear regression methods, logarithmic linear regression methods, additive, or pickup method, multiplicative method and Holt’s double exponential smoothing. The result that five robust methods are suggested as exponential smoothing, pickup, moving average, Holt’s method and linear regression.
The grain logistics system need forecasts of railroad grain carloads. Even though many forecasting studies have been conducted for vary application, but not have forecasting studies of quarterly railroad grain transportation have been published. Then Babcock and Lu [16] adopted time series model to forecast railroad grain transportations.
Because of not having the forecasting of quarterly barge grain transportation, Tang [17] intended to adopt a time series forecasting a quarterly model for Arkansas River soybean and wheat tonnage and estimate the two models.
Cause-And- Effect Model: The purpose of this model is to discover the form of the relationship and use it to forecast future the variable [14]. Regression Analysis, this model is used for several purposes, including data description, parameter estimation and control. Linear regression applications are adopted almost every fields, engineering, physical sciences, economics management and so on [18]. Non-linear regression, Wiener interested the ideas of functional series representation and further developed an existing material [19]. Gooijer and Kumar [20] provided an overview of the developments in this area to the beginning of the 1990s. These authors argued that the evidence for the superior forecasting performance of nonlinear models is patchy. Neural network is also cause-and-effect model, and can applied to many application but on the survey of 2006 neural network has not caught in business yet [12].
The econometric is an application statistical and mathematical method to predict economic data, such as interest rate, inflation and so on. This method is also for policy purpose [21], [22].
Qualitative Forecasting: This model does not require data in the same manner as quantitative forecasting methods and are mainly the product of judgment and accumulated knowledge.
Estimating method that relies on expert human judgment combined with a rating scale, instead of on hard (measurable and verifiable) data. Qualitative techniques can be used in a wide range of circumstances. In some cases quantitative techniques cannot be used, e.g. when the past information about the values being forecast does not exist. For example, for a new product, there are no past data on sales on which to base estimates of future sales. These are often used in business are: (i) analog, Delphi method, diffusion, PERT (Performance Evaluation Review Technique), and survey. Qualitative methods consist of three kinds of data are open-end interviews, direct observation and written documents [11], [12], [23].
The several of application of qualitative forecasting such as, Kesh and Raj intend to develop a model for financial forecasting using
the principles of qualitative reasoning. They purpose the illustration
how qualitative reasoning models can be developed in a financial domain, the application of these models and the problems and issues related to the development of qualitative reasoning model for financial forecasting and decision making [24].
The studies in the literature on predictions of container volumes are not only in time series forecasting but also in neural network method.
Wei and Yang applied artificial neural networks (ANNs) to study transit containers in Kaohsiung Port [25]. Lam, Seabrooke and Hui adopted neural networks (NN) method for forecasting Hong Kong Port cargo throughput [26], while Zhang and Kline used the NN approach to forecasting quarterly time series [27]. The next part will discuss about basic of neural networks and application.
B. Neural Networks
The main characteristic of a neural network is the ability to learn from environment, and to improve its performance through learning [28], [29]. Neural networks represent a recent approach to time series forecasting. There has been an increasing interest in using neural networks to model and forecast time series over the last decade, one of
the most successfully applied technique in the financial domain [30]. The first research is adopted neural networks method for forecasting
application as, Hu and Root [31] initiated the implementation of ANN on weather forecasting.
Neural network applications have employed to make better prediction about investment opportunities. ANNs are valuable tool for nonlinear time-series analysis and forecasting [32]. Integration TIA and Neural Networks integrate a powerful forecasting tool to add a learning component and allow that model to adjust to novel situations [33]. The result of forecasting by dynamic neural networks (DAN) is better than the traditional neural networks and autoregressive integration moving average (ARIMA) model [34].
H.S. Hippert, D.W. Bunn and R.C. Souza adopted neural networks model to forecast hourly electricity demands, and extend the apparent over-parameter affects their performance in a forecasting [35]. Support Vector Machine [SVM] can provide the best prediction performances, determine the network topology and estimate all the parameters automatically [36].
They conduct a simulated study and conclude that ANNs can be used for modeling and forecasting nonlinear time series, and nonlinear applications can be handled by using neural networks [37].
This research discuss for an application neural networks can achieve significantly higher numerical accuracy than more conventional techniques [38].
Zhang [39] proposed a neural ensemble model based on adding noises to the input data and forming different training sets with the jittered input data, jittered method is available for the single modeling approach with a variety of time series processes.
C. Traditional Statistics & Neural Networks
This part compares the accuracy of traditional forecasting and Neural Networks methods as, Skapura [29] indicate that neural nets are a useful approach to generalization problems in such non-conservative domains, performing much better than mathematical modeling techniques like regression.
Both researches presented by Surkan and Singleton [40, 41] compared the performance of the neural network to conventional, statistical methods to validate the network performance.
ANNs have three great advantages over traditional methods such as; universal approximation capabilities, recognize “on their own” implicit dependencies and relationship in data, learn” to adapt their behavior [30].
Heravi, Osborn and Birchenhall [42] found that the neural networks models have a clear advantage for forecasting the direction of the future annual growth for these series.
D. Forecasting evaluation and accuracy measures
There are several statistical methods available to evaluate forecast performance. The commonly used forecast accuracy measures are; Mean Error (ME), MSE (Mean squared error), RMSE (Root mean
squared error), MAPE (Mean absolute percentage error) and so on [11].
Mahmoud [43] mainly focused on comparisons of the accuracy of
these techniques. The comparisons cover both quantitative and qualitative methods. In addition the summary includes studies seeking to test or improve accuracy by combining forecasting techniques [43]. The original M-competition, measures used included the MAPE, MSE, AR, MdAPE, and PB. The MAPE also has problems when the series have values close to (or equal to) zero [11]. The other study which
looked at forecasting telecommunications data, used MAPE, MdAPE,
PB, AR, GMRAE, and MdRAE, taking into account some of the
criticism of the methods used for the M-competition [44].
Agami, Atiya, Saleh and El-Shishiny [33] used MSE and MAD
comparative assessment against the traditional ANN and ARIMA models shows dynamic neural networks (DAN) to perform uniformly better than other methods, and Hippert, Bunn, Souza [35] also measured the accuracy by MAE and RMSE.
This section, we wish to present the knowledge of forecasting technique and neural network method. The comparison of tradition forecasting and Neural Networks methods are compared. The last topic is the accuracy of the forecasting. This is an importation point for measurement. The next section will present the methodology of this work.
III. RESEARCH METHODOLOGY
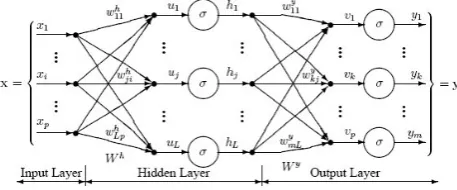
[image:3.595.60.289.274.369.2]ANNs have been shown to be a successful as predictive tools in variety of the ways as financial, weather, sport outcomes and so on. Neural networks are predictive models based on the action of biological neurons. Neural Networks method as Multilayer Perceptron (MLP) is adopted in this paper to forecast number of containers throughput in Bangkok Port. ANNs must be trained with a sizable number of example of past patterns [45],[46]. The interval activity of the neuron can be shown in figure 1,
Figure 1: The Multilayer Perceptron Neural Network Model
Input Layer: A vector of predictor variable values (x1…xp) is presented to the input layer. The input layer distributes the values to each of the neurons in the hidden layer.
Hidden Layer: Arriving at a neuron in the hidden layer, the value from each input neuron is multiplied by a weight (wji), and the resulting weighted values are added together producing a combined value uj. Output Layer: Arriving at a neuron in the output layer, the value from each hidden layer neuron is multiplied by a weight (wkj), and the resulting weighted values are added together producing a combined value vj.
Training process: The goal of the training process is to find the set of weight values that will cause the output from the neural networks to match the actual target values as closely as possible.
Let x(i) denote the input vector x for the ith case used to train the network, and the weights before this case is presented to the net by the vector w(i). The updating rule is w(i+1) = w(i)+η(y(i)−y(i))x(i) with w(0) = 0.
The process of training and testing for forecasting container throughput at Bangkok port
Step 1 Set parameter Step 2 Read input
Step 3 Read weight1, input and hidden Step 4 Read weight2, hidden and output Step 5 Computation1, input and hidden Step 6 Computation2, hidden and output
Many researchers analyze the relationship of economic factors, the volume of imports and exports as, Dollar [3] analyzed the relationship between the outward orientation and per capita GDP growth. Greenway [4] studied indicators of industrialization and macro-economic. Ram [5] analyzed the relationship between the exports and economic growth and Chou, Chub and Liang [6] forecasted the volumes of Taiwan’s import containers with the factors as volumes of export containers, volumes of import containers, population, industrial production index, GNP, GNP per capita, wholesale, GDP, agricultural GDP, industrial GDP and service GDP.
The data sets are adopted in this research. We accumulated data of factors and number of containers from 1999 until 2009 (by monthly), and factors are impacted to this research such as population , GDP,
world’s GDP, exchange rate, interest rate, inflation rate, fuel price. These factors are applied to the research because all of them are Thailand’s Economic indicators and the others affect to both of importing and exporting.
The scope of this work is forecasting the container throughput only in Bangkok Port. In this study, we consider two accuracy measurements to the neural networks model. They are the root mean squared error (RMSE) and the mean absolute error (MAE) defined as follows:
Note, Yi and Y^i are the actual and the predicted values of the time series in period i, respectively. Obviously, both of measures are positive invalue and the smaller the value obtained for each of the measures calculated, the better the performance of the forecasting method. The quantity r, called the linear correlation coefficient, measures the strength. The value of ris between -1 < r < +1. The + and – signs are used for positive correlations and negative correlations, respectively. Positive correlation: If x and y have a strong positive linear correlation, r is close to +1. An r value of exactly +1 indicates a perfect positive fit. Positive values indicate a relationship between x and y variables such as values for x increase, values for y also increase.
IV. RESULTS AND DISCUSSION
This section presents the results of the neural network model for forecasting container throughput and gives the discussion of the results. The results from the model are shown in Figure 2 illustrating the actual and predicted number of container throughput volumes in monthly order. The trend of the container throughput had gone up since 1999 until the year 2008 the trend seems to go down because of the effect of the world’s economic crisis.
Figure 2: The comparison of actual and predicted
container
throughput volumes of Bangkok port (unit: TEU)
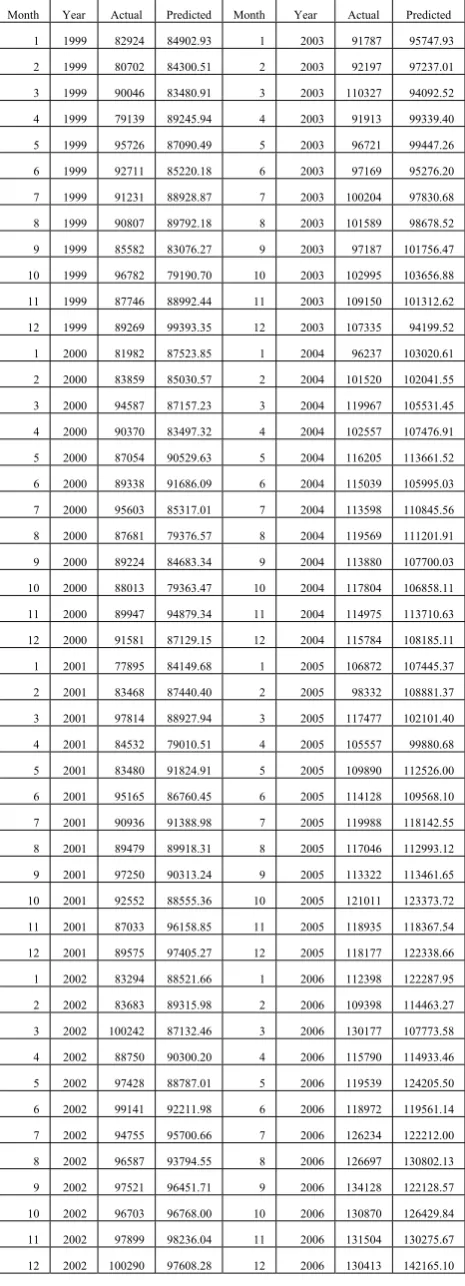
When using the neural network to predict container throughput volumes for import and export, the factors discussed in Section III were analyzed to find the relationship of the factors to the number of exporting and importing. From the analysis, the world’s GDP, interest rate, exchange rate, population and interest rate affect to the export volumes. On the other hand, fuel price and interest rate affects to the cost of productions which mean the factors affected to the volumes of import include interest rate, exchange rate, population, inflation rate, fuel price and GDP. Applying these factors in the neural networks for predicting import and export container volumes, the predicted container throughput volumes are presented in Table 1.
0 20000 40000 60000 80000 100000 120000 140000 160000
1 7 13 19 25 31 37 43 49 55 61 67 73 79 85 91 97
103 109 115 121 127
[image:3.595.315.558.448.585.2]Table 1: Actual and predicted container throughput volumes of Bangkok port unit: TEU.
Month Year Actual Predicted Month Year Actual Predicted
1 1999 82924 84902.93 1 2003 91787 95747.93
2 1999 80702 84300.51 2 2003 92197 97237.01
3 1999 90046 83480.91 3 2003 110327 94092.52
4 1999 79139 89245.94 4 2003 91913 99339.40
5 1999 95726 87090.49 5 2003 96721 99447.26
6 1999 92711 85220.18 6 2003 97169 95276.20
7 1999 91231 88928.87 7 2003 100204 97830.68
8 1999 90807 89792.18 8 2003 101589 98678.52
9 1999 85582 83076.27 9 2003 97187 101756.47
10 1999 96782 79190.70 10 2003 102995 103656.88
11 1999 87746 88992.44 11 2003 109150 101312.62
12 1999 89269 99393.35 12 2003 107335 94199.52
1 2000 81982 87523.85 1 2004 96237 103020.61
2 2000 83859 85030.57 2 2004 101520 102041.55
3 2000 94587 87157.23 3 2004 119967 105531.45
4 2000 90370 83497.32 4 2004 102557 107476.91
5 2000 87054 90529.63 5 2004 116205 113661.52
6 2000 89338 91686.09 6 2004 115039 105995.03
7 2000 95603 85317.01 7 2004 113598 110845.56
8 2000 87681 79376.57 8 2004 119569 111201.91
9 2000 89224 84683.34 9 2004 113880 107700.03
10 2000 88013 79363.47 10 2004 117804 106858.11
11 2000 89947 94879.34 11 2004 114975 113710.63
12 2000 91581 87129.15 12 2004 115784 108185.11
1 2001 77895 84149.68 1 2005 106872 107445.37
2 2001 83468 87440.40 2 2005 98332 108881.37
3 2001 97814 88927.94 3 2005 117477 102101.40
4 2001 84532 79010.51 4 2005 105557 99880.68
5 2001 83480 91824.91 5 2005 109890 112526.00
6 2001 95165 86760.45 6 2005 114128 109568.10
7 2001 90936 91388.98 7 2005 119988 118142.55
8 2001 89479 89918.31 8 2005 117046 112993.12
9 2001 97250 90313.24 9 2005 113322 113461.65
10 2001 92552 88555.36 10 2005 121011 123373.72
11 2001 87033 96158.85 11 2005 118935 118367.54
12 2001 89575 97405.27 12 2005 118177 122338.66
1 2002 83294 88521.66 1 2006 112398 122287.95
2 2002 83683 89315.98 2 2006 109398 114463.27
3 2002 100242 87132.46 3 2006 130177 107773.58
4 2002 88750 90300.20 4 2006 115790 114933.46
5 2002 97428 88787.01 5 2006 119539 124205.50
6 2002 99141 92211.98 6 2006 118972 119561.14
7 2002 94755 95700.66 7 2006 126234 122212.00
8 2002 96587 93794.55 8 2006 126697 130802.13
9 2002 97521 96451.71 9 2006 134128 122128.57
10 2002 96703 96768.00 10 2006 130870 126429.84
11 2002 97899 98236.04 11 2006 131504 130275.67
12 2002 100290 97608.28 12 2006 130413 142165.10
Table 1: Actual and predicted container throughput volumes of Bangkok port unit: TEU. (cont.)
Month Year Actual Predicted Month Year Actual Predicted
1 2007 120199 108659.10 7 2008 125,586 130577.54
2 2007 123279 119975.51 8 2008 121920 125788.37
3 2007 135904 117625.09 9 2008 89889 92987.38
4 2007 115333 123451.82 10 2008 108213 110322.68
5 2007 121715 125440.92 11 2008 115999 120588.64
6 2007 126415 122197.46 12 2008 107015 110388.95
7 2007 133815 128113.45 1 2009 96382 97931.05
8 2007 125072 131898.22 2 2009 86246 76211.68
9 2007 124232 138883.73 3 2009 117320 99922.30
10 2007 133054 145538.39 4 2009 95849 113072.59
11 2007 138617 142512.28 5 2009 109165 108434.16
12 2007 137846 130544.75 6 2009 113243 115288.95
1 2008 97197 122868.88 7 2009 116678 115594.75
2 2008 111977 118293.79 8 2009 120556 118107.62
3 2008 132926 77778.85 9 2009 115432 119333.96
4 2008 116416 130053.19 10 2009 117577 120801.51
5 2008 120083 132000.23 11 2009 121924 119004.29
6 2008 115113 114578.65 12 2009 116646 86557.55
The results of the neural network forecasting are presented in Table 2. The number correlation coefficient describes the relationship of factors and the container volumes. The correlation coefficient of import and total volumes are pretty high at 0.86 and 0.84 respectively while those factors can explain the relationship of export container volumes at 0.78.
Table 2: Performance of forecasting number of container
V. CONCLUSION
It is very important for the government body and private organizations to predict the volumes of container throughput at Bangkok Port. The forecast number will enable Bangkok Port Authority manage and develop the main infrastructures and equipments for supporting the country’s competitiveness. Moreover, Bangkok Port Authority will be able to cooperate with the government and private sectors to invest for port business in order to serve transportation system and facilities for customer satisfactions, to ensure optimum efficiency and fairness of port services. The result of this study contributes to the knowledge of what factors are important and affect to the import and export container volumes. The forecasting accuracies are satisfactory and the values of correlation coefficients are more than 75%. The accuracies of predicting are evaluated by calculating MAE and RMSE. In this research, neural networks are one of valuable tools for nonlinear time-series analysis and forecasting. In the future, it may be worthwhile to explore other forecasting methods as times series methods to compare to the latest technologies as neural networks for predicting container throughput volumes.
Item Import Export Total
ACKNOWLEDGMENT
I would like to honestly thank my supervisors, Dr.Watcharavee Chandraprakaikul, and Dr. Supaporn Kiattisin for patient guidance and assistance. I sincerely appreciate my program director, Dr.Nanthi Suthikarnnarunai for helpful suggestion.
REFERENCES
[1] “Final Report for the Study on Modernization of Bangkok Port in the Kingdom of Thailand”, Vol.1 1994, pp. 199-202.
[2] “Annual Report Year 2008: Port Authority of Thailand”, September, 2009, pp. 58-59.
[3] D. Dollar, “Outward-oriented developing economies really do grow more rapidly: Evidence from 95 LDCs, 1976–1985”, Economic Development and Cultural Change 40, 1992, pp. 523– 544.
[4] D. Greenaway, C.H. Nam, “Industrialization and macroeconomic performance in developing countries under alternative trade strategies”, Kyklos 41, 1988, pp. 419–435.
[5] R. Ram, “Exports and economic growth: Some additional evidence”, Economic Development and Cultural Change 33, 1985, pp. 415–425.
[6] C.-Chang Chou, C.-Wu Chub, G.-Shuh Liang, “A modified regression model for forecasting the volumes of Taiwan’s import containers”, Mathematical and Computer Modelling 47, 2008, pp. 797–807.
[7] W.Y.Peng, C.W.Chu, “A comparison of univariate methods for forecasting container throughput volumes.”, Mathematical and Computer Modelling 50”, 2009, pp. 1045-1057.
[8] www.bot.or.th, Bank of Thailand.
[9] www.nesdb.go.th, Office of the National Economic and Social Development Board.
[10] J. Scott. Armstrong, “A Handbook for Researchers and Practioners”, Kluwer Academic Publishers, 2001, pp. 2-8.
[11] S.Makridakis, S.C.Wheelwright, R.J.Hyndman“Forecasting: Methods and Applications”, 3rd edition, John Wiley & Son, Inc. pp. 1-16.
[12] C. L. Jain, “Benchmarking Forecasting Models”, The Journal of Business Forecasting, Winter 2006-2007, pp. 14-17.
[13] Yule, G. U., “On the method of investigating periodicities in
disturbed series, with special reference to Wolfer’s sunspot
numbers”. Philosophical Transactions of the Royal Society
London, Series A. 226, 1927, pp. 267– 298.
[14] Box, G. E. P., G.M.Jenkins. “ Time Series Analysis Forecasting
and control”, Holden-Day, San Francisco, 1970.
[15] L.R.Weatherford, S.E.Kimes, “A comparison of forecasting methods for hotel revenue management”, International Journal of Forecasting 19”, 2003, pp. 401-415.
[16] M.W. Babcock, X. Lu, “Forecasting inland waterway grain traffic”, Transportation Research Part E 38, 2002, pp. 65-74.
[17] X. Tang “Time series forecasting of quarterly barge grain tonnage on the McClellan-Kerr Arkansas River navigation system”, Journal of the Transportation Research Forum 40, 2001, pp. 91-108.
[18] D.C. Montgomery, E.A. Peak, G.G. Vining, “Introduction to Linear Regression Analysis”, John Wiley & Sons, Inc., 1982, pp. 1-6.
[19] N.Wiener, “Non-Linear Problems in Random Theory”, London, Wiley, 1958, pp. 1-15.
[20] G.De.Gooijer, K.Kumar, “Some Recent Developments in Non- Linear Series, testing and forecasting”, International Journal of Forecasting, Volume 8, Issue 2, 1992, pp. 135-156.
[21] G.S. Maddala, “Introduction to Econometrics”, 2nd edition, Prentice Hall, 1992, pp. 1-4.
[22] J.M. Wooldridge, “Introductory Econometrics: A Modern Approach”, South-Western Colledge Publishing, 2000, pp. 1-18. [23] M.Q.Patton, “Qualitative evaluation and research methods”, 2nd
edition Sage Publications, Newbury Park, CA, 1990, pp. 10.
[24] Someswar Kesh M.K. Raj, “Development of a qualitative reasoning model for financial forecasting” Information Management & Computer Security Vol. 13 No. 2, 2005, pp. 167- 179.
[25] C.H. Wei, Y.C. Yang, “A study on transit containers forecast in Kaohsiung port-applying artificial neural networks to evaluating input variables”, Journal of the Chinese Institute of Transportation 11, 1999, pp. 1-20.
[26] W.H.K. Lam, P.L.P. Ng, W. Seabrooke, E.C.M. Hui, “Forecasts and reliability analysis of port cargo throughput in Hong Kong”, Journal of Urban Planning and Development 130, 2004, pp 133- 144.
[27] G.P Zhang, D.M. Kline, “Quarterly time-series forecasting with neural networks”, IEEE Transactions on Neural Networks 18, 2007, pp. 1800-1814.
[28] S. Haykin, "Neural networks: a comprehensive foundation," 2nd edition, Prentice Hall, Upper Saddle River, NJ, 1999, pp. 1-6.
[29] D. M. Skapura, “Building Neural Networks, ACM Press, New York, 1996, pp. 143-148.
[30] Y.Bodyanskiy, S. Popov, “Neural Network approach to forecasting of quasiperiodic financial time series”, European Journal of operation Research 175”, 2006, pp. 1375-1366.
[31] M.J.C.Hu, H.E.Root, “Application of the adaline system to weather forecasting”, Journal of Applied Meteorology, Vol3, 1964, pp. 513-523.
[32] G. Peter Zhang, “An Investigation of neural networks for linear time-series forecasting”, Computer & Operation Research 28”, 2001, pp. 1183-1202.
[33] N.Agami, A. Atiya, M. Saleh, H. El-Shishiny, “ A neural network based dynamic forecasting model for trend Impact Analysis”, Technology Forecasting & Social Change 76, 2009, pp. 952-962. [34] M. Ghiassi, H. Saidane, D.K.Zimbra, “A dynamic artificial neural
network model for forecasting time series events”, International Journal of Forecasting 21”, 2005, pp. 341-362.
[35] H.S. Hippert, D.W. Bunn, R.C. Souza, “Large neural networks for electricity load forecasting: Are they overfitted?”, International Journal of Forecasting 21”, 2005, pp. 425-434.
[36] W.Wang, Z.Xu, J.W.Lu, “Three improved neural network models for air quality forecasting”, Engineering Computations, Vol.20, No.2, 2003, pp. 192-210.
[37] Lapedes, A., Farber, R., “Nonlinear signal processing using neural networks: prediction and system modeling”. Technical Report LA-UR-87-2662, Los Alamos National Laboratory, Los Alamos, NM., 1987
[38] Lapedes, A., Farber, R., “How Neural Nets Work”, Anderson, D.Z., (Ed.), Neural Information Processing Systems, American Institute of Physics, New York, 1988, pp. 442–456.
[39] G. Peter Zhang, “A neural network ensemble method with jittered training data for time series forecasting”, Information Science 177, 2007 pp. 5329-5346.
[40] S.Dutta, S.Shenkhar. “Bond rating: A non-conservative application of neural networks.” In Proceeding of the IEEE International Conference on Neural Networks, Vol.2, San Diego. CA., 1988, pp. 443-450.
[41] A.J.Surkan,J.C.Singleton. “Neural networks for Bond rating improved by multiple hidden layers.” Pp. 157-162.
[42] S.Heravi, D.R. Osborn., C.R. Birchenhall, “Linear Versus neural network forecasts for European industrial production series”, International Journal of Forecasting 20, 2004, pp. 435-446.
[43] E.Mahmoud “Accuracy in forecasting: A survey”. Journal of
Forecasting, Vol.3, 1984, pp.139– 159.
[44] R.Fildes, M.Hibon, S.Makridakis, N.Meade, “Generalising about univariate forecasting methods: Future empirical evidence”, International Journal of Forecasting 14, 1998, pp. 339-358.
[45] S.V.Kartaloppoulos, “Understand Neural Networks and Fuzzy
Logic”, IEEE Press, New York, pp. 68-70.