Tailoring Properties of Biocompatible PEG-DMA
Hydrogels with UV Light
Sania Bäckström1,2, Juana Benavente3, Rolf W. Berg4, Karin Stibius1,2, Marianne S. Larsen2, Henrik Bohr5, Claus Hélix-Nielsen1,2
1The Biomimetic Membrane Group, DTU Physics, Technical University of Denmark, Lyngby, Denmark; 2Aquaporin A/S, Ole
Maaløes Vej 3, Copenhagen, Denmark; 3Grupo de Caracterización Electrocinética en Membranas e Interfases, Departamento de
Física Aplicada I, Facultad de Ciencias, Universidad de Málaga, Málaga, Spain; 4DTU Chemistry, Technical University of Denmark,
Lyngby, Denmark; 5Quantum Protein Center, DTU Physics, Technical University of Denmark, Lyngby, Denmark.
Email: [email protected]
Received March 7th,2012; revised April 8th, 2012; accepted May 9th, 2012
ABSTRACT
Hydrogels are highly water-absorbent hydrophilic polymer networks, which show potential in many biocompatible ap- plications. In previous work, we demonstrated the feasibility of using poly(ethylene glycol) dimethacrylate (PEG-DMA) gels polymerized with a photoinitiator for encapsulation and stabilization of painted biomimetic membrane arrays for novel separation technologies or biosensor applications. These gels were formed from PEG-DMA monomers suspended in phosphate buffered saline (PBS) solution and gelated by radical polymerization in the presence of the photoinitiator Darocur 1173. In this work, we show that the properties of a PEG-DMA hydrogel formed by photoinitiated polymerize- tion can be tailored by varying the photocrosslinking time. Fourier Transform Infrared Spectroscopy (FTIR) and Raman Spectroscopy (RS) showed that the optimal crosslinking time for the gel was 6 - 10 minutes and that the water content of the gels could be tuned in the range of 50 - 90 wt%. The resistivity was between 0.8 - 3.5 Ωm, which is comparable to that of PBS. The low resistivity of the gel makes it compatible for encapsulating membranes for (ion channel based) biosensor applications. With FTIR and RS we identified spectral features of the hydrogel, which may serve as a diag- nostic tool to monitor changes in the gels due to variation in parameters such as time, pH, temperature, aging or expo- sure to chemicals or biological material.
Keywords: Hydrogel Swelling; UV-Induced Polymerization; FTIR, Raman Spectroscopy; Impedance Spectroscopy
1. Introduction
Hydrogels are highly water absorbent hydrophilic poly- mer networks [1-3]. They are favored as scaffolds for tissue engineering where they may act as supports for cells [4-9] and biomimetic membranes [10,11]. With the advent of methods for producing large scale biomimetic membranes it becomes important to assess material prop- erties of hydrogels as encapsulation materials for tech- nological application of biomimetic membranes [12]. Poly(ethylene oxide) (PEO) synthetic hydrogels are the most commonly used synthetic hydrogel polymers for tissue engineering. Poly(ethylene glycol) (PEG)-based hydrogels are structurally similar to PEO and can be crosslinked by modifying each end with acrylates or methacrylates [7]. These materials are suitable for sup- porting cells and biomimetic membranes for several rea- sons: their chemistry and properties can be controlled by varying for example molecular weight, chemical compo- sition, the amount and type of initiator used and the de-
gree of crosslinking, which modifies their mass transport properties, physical properties and biological properties. Also, poly(ethylene glycol)-diacrylate (PEG-DA) hy- drogels have been shown to be compatible in vivo with porcine islet cells [8] and poly(ethylene glycol)-dimetha- crylate (PEG-DMA) hydrogels to be compatible with chondrocytes in vitro [9].
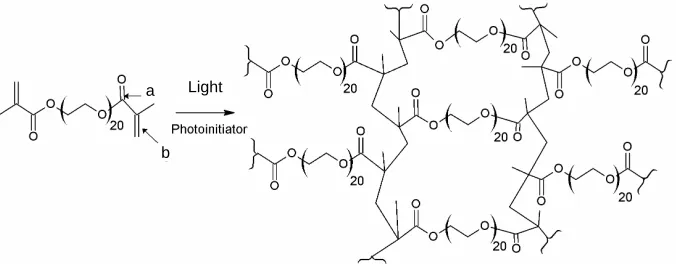
Photoactivated PEG-DMA hydrogels are formed from PEG-DMA monomers suspended in aqueous solution and gelate by radical polymerization in the presence of a photoinitiator. The polymerization reaction starts when the solution is exposed to UV light. Each PEG-DMA monomer has two methacrylate groups which can react with up to two other methacrylate groups to make cova- lent bonds. Thus, each PEG-DMA monomer can cova- lently link to up to four other PEG-DMA monomers and the resulting polymer forms a covalently crosslinked branched network, see Figure 1.
Light a
[image:2.595.129.467.87.219.2]b
Figure 1. Chemical structure of PEG-1000-DMA and of the crosslinked PEG-1000-DMA meshwork. Gelation occurs through radical polymerization in which the methacrylate groups participate in an addition reaction to form a branched polymeric network. The crosslinked gel, X1000P, was made from a hydrogel precursor solution containing 65 mM PEG-1000-DMA with 10 mM Darocur photoinitiator in aqueous buffer. The C=O (a) and C=C (b) bonds to which FTIR and RS spectral peaks are assigned are indicated.
becomes important. In previous work [10,16] we charac- terized chemically activated and photoactivated PEG-DMA and PEG-DA hydrogels with respect to volumetric sta- bility, water permeability, ionic permeability and porosity and showed successful hydrogel encapsulation of multi- ple lipid membranes formed across an aperture array.
In this work we address how transport properties of PEG-DMA hydrogels suitable for biomimetic applica- tions can be tailored by varying the photocrosslinking time and thereby the degree of crosslinking. We show that we can change the water absorption capability and the ionic conductivity of the gel, which could be used to control the gel’s flux properties. Using Fourier Trans- form Infrared spectroscopy (FTIR) and Raman spectros- copy (RS) we obtain the spectral fingerprint profile of the gel and find that there is a shift in the C=O peak wave- number and a decrease in the intensity of the C=C peak due to crosslinking. Furthermore, RS measurements show how the fingerprint is altered with specific spectral peaks receding and other peaks appearing with increased UV irradiation time. The spectral fingerprint of the gel may be applicable as a diagnostic tool to detect changes in the gel in response to variation in parameters, such as tem- perature, pH, aging and exposure to chemicals.
2. Materials and Methods
2.1. Materials
Poly(ethylene glycol)-1000-dimethacrylate (PEG-1000- DMA) was from Polysciences (Warrington, PA, USA). 2- Hydroxy-2-methyl-1-phenyl-propan-1-one (Darocur® 1173)
was from Ciba Specialty Chemicals (Basel, Switzerland). Phosphate buffered saline (PBS) was from Sigma Al- drich Denmark (Brøndby, Denmark).
2.2.Preparation of Hydrogels
The hydrogel was prepared as in [10,16]. Briefly, the
hydrogel precursor solution (HPS) consisted of 65 mM PEG-1000-DMA and 10 mM Darocur® 1173 (a photoini-
tiator) in PBS. We will refer to this solution as 1000P. Free-radical polymerisation of 1000P was initiated by 4, 6, 8, 10 or 15 min of photocrosslinking of the HPS by UV light from an EA-140 UV lamp with wavelength λ = 365 nm (Spectroline, Westbury, NY, USA) at a lamp distance of 1 cm. The lamp intensity at a distance of 15 cm was 800 µW·cm–2. We will refer to the crosslinked
gel as X1000P.
2.3.Swelling Experiments
Equilibrium swelling experiments were used to deter- mine the structural characteristics of the PEG-DMA gels. Irradiated hydrogel samples were prepared from 3 ml of HPS per sample. Excess liquid was poured off and the gels were allowed to equilibrate at ambient temperature (~25˚C) for 24 h. Thereafter, the gels were weighed to determine the irradiated gel weight, Wir. Then they were dried under vacuum for 24 h to remove all water (the dried gel mass corresponded to the expected dry mass of PEG-1000-DMA and Darocur in 3 ml of HPS) and weighed to determine the dry gel weight Wd, as in [17]. The per- centage of water content in the irradiated gels was calcu- lated as (Wi – Wd)/Wir·100% [18]. The dried gels were rehydrated in PBS at ambient temperature (~25˚C) for 24 h. Excess liquid was poured off and the gels were al- lowed to equilibrate at ambient temperature (~25˚C) for 24 h. Then the gels were weighed to determine the swol- len gel weight, Ws and percentage of water content de- termined as (Ws– Wd)/Ws·100%.
2.4. Fourier Transform Infrared (FTIR) Spectroscopy
from Thermo Scientific, MA, USA. The FTIR spectra were recorded using OMNIC software from Thermo Nicolet Corporation with an average of 32 scans in the range 650 - 4000 cm–1 and at a resolution of 4 cm–1.
Samples were dried in a vacuum dessicator for 24 h prior to analysis in order to reduce the contribution from water in the recorded spectrum.
2.5. Raman Spectroscopy
Raman spectra were obtained as in [19] by use of a DILOR-XY 800 mm focal length multichannel spec- trometer with horizontal Nd:YVO4 laser excitation (532.8
nm, ~300 mW, vertically polarized). Rayleigh-scattered light was filtered off with a double pre-monochromator (slit width 500 µm). The Raman light was collected at 90˚ scattering, dispersed by use of an 1800 lines/mm grating, and focused onto a charge-coupled device (CCD) detector, cooled to 140 K by liquid nitrogen. The spectral resolution was approximately 4 cm–1. Hydrogel samples
were prepared as described above and were not dried prior to measurements. The recorded spectra were nor-malized to obtain the same intensity for the spectral peak at 1470 cm–1 (attributed to H-C-H bending). The relative
number of C=C bonds in the gels was obtained by com-paring the peak height at 1640 cm–1 (attributed to C=C
stretching), which was used as a measure of the degree of crosslinking.
2.6. Impedance Spectroscopy (IS)
The test cell for impedance spectroscopy measurements consisted of a Teflon support with two Pt electrodes be- tween which a cylindrical crown rubber support (ap- proximately 2.2 mm height and 1.5 cm diameter) filled with gel sample was placed and clamped as previously described [20]. The electrodes were connected to a Fre- quency Response Analyzer (Solartron 1260, Farnborough, England) and measurements were recorded for 100 data points in the frequency range of 1 Hz - 10 MHz, at a maximum voltage of 0.01 V.
3. Results and Discussion
3.1. Water Content
The water content of the gel influences the mechanical integrity and strength of the gel as well as the diffusion of nutrients and metabolites through the gel to a cell/ biomimetic membrane [7]. Controlling the gel water con- tent is important for the gel’s interaction with hydrogel- encapsulated biomimetic membranes, such as those pre- sented in our earlier work [10]. The high water absorb- ance of hydrogels is one of their most important material properties and therefore, it is crucial to be able to tailor the water content of the gels to suit the application that
they are intended for.
We found that the irradiated and equilibrated PEG- DMA hydrogels contained ~92 wt% water independent of UV irradiation time, see Figure 2. However, after the gels were dried and rehydrated overnight, the water up- take ability of the gels increased with an increase in the photocrosslinking time with a water content ranging from 50% for samples irradiated for 4 min to 90 wt% for sam- ples irradiated for 15 min approaching the water content of the non-dried gels, see Figure 2.
An explanation for the increased water uptake ability with increased UV irradiation could be that drying the gels causes partial reversible collapse of pores in the gel meshwork as has been observed for similar gels by Wu et al. [17], with an increased degree of pore collapse for shorter crosslinking times. Increasing the crosslinking time would increase the crosslinking density and thereby improve the stability of the gel meshwork, leading to less pore collapse. Less pore collapse entails more pores that can be filled with water and thus more water absorption. Interestingly, Andreopoulos et al. [21] report that the water content in a PEG-based gel decreases with in- creased photocrosslinking time. It is thus possible to tai- lor the water content of PEG-DMA hydrogels by select- ing a suitable UV photocrosslinking time.
3.2. Crosslinking Revealed by Fourier
Transform Infrared Spectroscopy (FTIR) and Raman Spectroscopy (RS)
In order to analyze whether this trend corresponded to an increase in crosslinking with increased UV irradiation time, we studied samples with FTIR and RS. With FTIR we compared spectral peaks at 1680 - 1780 cm–1 (as-
signed to C=O bond vibrations and indicated by the label “a” in Figure 1) and with RS spectral peaks at 1640 cm–1
[image:3.595.339.508.549.677.2](assigned to C=C bonds and indicated by the label “b” in Figure 1) [22]. These bands originate from the methacry-
late groups, which form covalent bonds through an addi- tion reaction during the polymerization. In the addition reaction, the alkene functionality is converted to an al- kane functionality. Therefore, the number of C=C bonds can be used as a measure of the degree of crosslinking of the polymer meshwork. In FTIR, the C=C peak over- lapped a peak from water, which restricted quantification of the relative number of C=C bonds to dry gels. There- fore we used Raman spectroscopy (RS) to quantify C=C bonds in the wet gel, due to the low Raman scatter from bulk water.
3.2.1. FTIR Analysis
The FTIR spectra showed that the C=O peak had shifted when comparing crosslinked PEG-DMA hydrogels with the PEG-DMA monomer, see Figure 3(a). The untreated dry PEG-DMA had a C=O peak at 1716 cm–1, and with
the addition of PBS, the C=O peak was still at 1716 cm–1.
After 15 min UV irradiation the resulting hydrogel sam- ple showed a shift to C=O peak at 1728 cm–1 indicating a
change in the chemical environment in the vicinity of the C=O bond. The PEG-DMA monomer contains C=O bonds conjugated with the adjacent C=C bonds. In the crosslinked gel the C=C bond was converted by addition polymerization to a C-C bond and the C=O bonds are no longer conjugated giving rise to the observed shift in agreement with previous observations [23]. Since 15 min of photocrosslinking, shifted the C=O peak cleanly to 1728 cm–1 without any residual peak remaining at 1716
cm–1, this indicates that virtually all the PEG-DMA mo-
nomers are used up in the reaction and effectively no C=O bonds conjugated with C=C bonds remain.
Examining the C=O peak shift as a function of UV ir- radiation time, we found that for photocrosslinking times
exceeding 6 min the C=O peak is shifted from 1716 cm–1
to 1728 cm–1, and that the turning point is after 4 min
photocrosslinking, where the large standard deviation reflects that some samples have a C=O peak at 1728 cm–1
and others at 1718 cm–1, see Figure 3(b). This indicates
that the polymerization reaction once started occurs rap- idly. Either there was no crosslinking and the C=O was at 1716 - 1718 cm–1 or the crosslinking reaction was com-
plete and the C=O peak was at 1728 - 1730 cm–1. Photo-
crosslinking times < 2 min were not sufficient to peak cause any crosslinking of the gel (results not shown).
3.2.2. RS Analysis
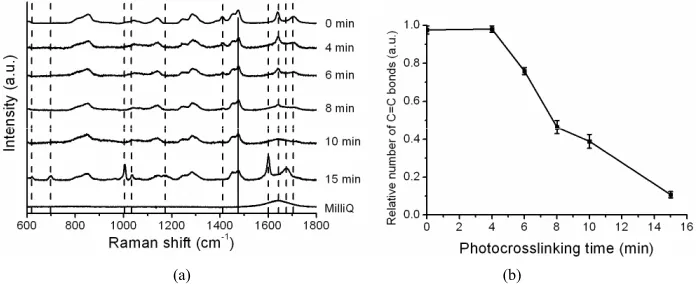
In order to follow the C=C bond formation in the reac- tion we analyzed how the RS signature of the wet hy- drogel changes with photocrosslinking time, see Figure 4(a). Raman peaks at 1410 cm–1, 1640 cm–1 (interpreted
as stretching of C=C bonds) and 1705 cm–1 decrease in
intensity as the photocrosslinking time increases and disappear entirely at a photocrosslinking time of 15 min. Examining the C=C peak with RS, we found that at t = 4 min, virtually all of the original C=C bonds remain, see Figure 4(b). After 6 minutes of photocrosslinking, 25% of the C=C bonds are used up in the crosslinking reaction. The relative number of C=C bonds decreases linearly with increased photocrosslinking time and after 15 min- utes, only 10% of the C=C bonds remain. RS measure- ments showed a linear decrease in the number of C=C bonds, and therefore an increase in crosslinking density, with photocrosslinking time. This correlates with the linear increase in water uptake of the gel, which suggests that the increased water uptake is due to a difference in crosslinking density of the gel.
At a photocrosslinking time of 15 min, new Raman
[image:4.595.115.484.506.658.2](a) (b)
(a) (b)
Figure 4. Spectral fingerprints of X1000P hydrogel as a function of photocrosslinking time obtained by Raman spectroscopy. (a) Raman spectra were normalized to make the peak at 1470 cm–1 (attributed to H-C-H bending, indicated with a solid line) have equal intensity and then the spectra were offset for clarity. Dashed lines indicate Raman peaks of the gel that change with increased photocrosslinking time; (b) The relative number of C=C bonds in the hydrogel as a function of photo-crosslinking time (n = 3).
[image:5.595.125.474.302.435.2](a) (b)
Figure 5. Gel impedance (a) and specific electrical resistance, ρ; (b) of X1000P hydrogel as a function of the photocrosslinking time (n = 3).
peaks appear at 618 cm–1, 700 cm–1, 1003 cm–1, 1035
cm–1, 1174 cm–1, 1600 cm–1 and 1676 cm–1, see Figure
4(a).
The appearance of Raman peaks at 15 min is likely to be due to reaction end products from the Darocur1173 initiator used in the photocrosslinking reaction. This ini- tiator is split by UV light into a benzoyl radical and an alkyl radical and one of the possible reaction end prod- ucts is benzoic acid [24]. Benzoic acid Raman peaks that match closely to those observed at 15 min crosslinking are at 618 cm–1, 708 cm–1, 1035 cm–1 and 1165 cm–1 [25]
and the Raman peaks at 1003 cm–1 and 1600 cm–1 are
attributed to C=C aromatic ring stretching from other biproducts of the benzoyl radical. The reaction end prod- ucts from the benzoyl radical are yellow and those from the alkyl radical generally evaporate during the polym- erization process. Although no yellowing of gels was observed, the appearance of additional Raman peaks af- ter 15 min crosslinking indicates that 10 min photo- crosslinking is optimal in order to avoid contamination of the gel with reaction end products.
3.3. Hydrogel Specific Electrical Resistance
A physical parameter of great interest in determining sample changes is the specific electrical resistance, which can be determined from impedance spectroscopy (IS) measurements using equivalent circuits as models [26, 27]. We collected the impedance plots for the hydrogel at different photocrosslinking times, and clear differences could be observed as shown in Figure 5(a). The fitting of the impedance data by using a non-linear program [28] allows determination of the electrical resistance of the different gel samples (RG), which can be converted to specific electrical resistance, ρ, using ρ = RG·A/l, where A = 177 mm2 is the surface area of the gel sample and l =
This showed that the gels had a low resistivity (and a high conductivity), making them suitable for use in ion channel-containing hydro gel-encapsulated membranes for biosensor applications. An increase in the specific electrical resistance as a result of an increase in the pho- tocrosslinking time was obtained, which correlated with an increase in the crosslinking density of the gel network. It is remarkable that an increase in photocrosslinking increased the water absorption of the gel, while also in- creasing its resistivity. We attribute the increased gel resistance to the presence of the hydrophobic initiator Darocur consistent with previous work [16].
4. Conclusion
We show that the properties of a PEG-DMA hydrogel formed by photoinitiated polymerization can be tailored by varying the photocrosslinking time. The water content and the specific electrical resistance of the gel can be controlled between 50 - 90 wt% and 0.7 - 3.5 Ωm, re- spectively within 4 - 15 min crosslinking time. FTIR spec- troscopy revealed a change in C=O vibrations from 1716 cm–1 to 1728 cm–1 upon UV illumination consistent with
formation of a polymeric network. RS revealed a corre- sponding decrease in the relative number of C=C bonds indicating the conversion from alkene to alkane bond upon polymerization. Furthermore RS revealed reaction end products from photoinitiator degradation (likely benzoic acid) after prolonged (15 min) UV illumination. Thus both FTIR and RS should be useful as diagnostic tools to study changes in PEG-DMA hydrogels due to e.g. aging, pH, temperature, or chemical exposure.
5. Acknowledgements
This work was supported through MEMBAQ, a Specific Targeted Research Project (STREP), by the European Commission under the Sixth Framework Programme (NMP4-CT-2006-033234), by the Danish National Ad-vanced Technology Foundation (023-2007-1), by a grant to DTU Physics from the Danish National Research Foundation.
REFERENCES
[1] A. S. Hoffman, “Hydrogels for Biomedical Applications,”
Advanced Drug Delivery Reviews, Vol. 54, No. 1,2002, pp. 3-12. doi:10.1016/S0169-409X(01)00239-3
[2] N. A. Peppas, Y. Huang, M. Torres-Lugo, J. H. Ward and J. Zhang, “Physicochemical Foundations and Structural Design of Hydrogels in Medicine and Biology,” Annual Review of Biomedical Engineering, Vol. 2, 2000, pp. 9- 29.
[3] N. A. Peppas, P. Bures, W. Leobandung and H. Ichikawa, “Hydrogels in Pharmaceutical Formulations,” European Journal of Pharmaceutics and Biopharmaceutics,Vol. 50,
No. 1, 2000, pp. 27-46.
doi:10.1016/S0939-6411(00)00090-4
[4] S. Tanaka, A. Ogura, T. Kaneko, Y. Murata and M. Aka- shi, “Adhesion Behavior of Peritoneal Cells on the Sur- face of Self-Assembled Triblock Copolymer Hydrogels,”
Biomacromolecules,Vol. 5, No. 6, 2004, pp. 2447-2455. doi:10.1021/bm049653o
[5] M. Tanaka, M. Tutus, S. Kaufmann, F. F. Rossetti, E. Schneck and I. M. Weiss, “Native Supported Membranes on Planar Polymer Supports and Micro-Particle Sup- ports,” Journal of Structural Biology, Vol. 168, No. 1, 2009, pp. 137-142. doi:10.1016/j.jsb.2009.05.008
[6] M. Tanaka and E. Sackmann, “Supported Membranes as Biofunctional Interfaces and Smart Biosensor Platforms,”
Physica Status Solidi A,Vol. 203, No. 14, 2006, pp. 3452- 3462. doi:10.1002/pssa.200622464
[7] J. L. Drury and D. J. Mooney, “Hydrogels for Tissue En- gineering: Scaffold Design Variables and Applications,”
Biomaterials,Vol. 24, No. 24, 2003, pp. 4337-4351. doi:10.1016/S0142-9612(03)00340-5
[8] G. M. Cruise, O. D. Hegre, F. V. Lamberti, S. R. Hager, R. Hill, D. S. Scharp and J. A. Hubbell, “In vitro and in Vivo Performance of Porcine Islets Encapsulated in Inter-facially Photopolymerized Poly(Ethylene Glycol) Dia- crylate Membranes,” Cell Transplantation,1999, Vol. 8, No. 3, pp. 293-306.
[9] J. Elisseeff, W. McIntosh, K. Anseth, S. Riley, P. Ragan and R. Langer, “Photoencapsulation of Chondrocytes in Poly (Ethylene Oxide)-Based Semi-Interpenetrating Net- works,” Journal of Biomedical Materials Research,Vol. 51, No. 2, 2000, pp. 164-171.
doi:10.1002/(SICI)1097-4636(200008)51:2<164::AID-JB M4>3.0.CO;2-W
[10] S. Ibragimova, K. B. Stibius, P. Szewczykowski, M. Perry, H. Bohr and C. H. Nielsen, “Hydrogels for in Situ Encap- sulation of Biomimetic Membrane Arrays,” Polymers for Advanced Technologies, Vol. 23, No. 2, 2012, pp. 182- 189. doi:10.1002/pat.1850
[11] T. J. Jeon, N. Malmstadt and J. J. Schmidt, “Hydrogel- Encapsulated Lipid Membranes,” Journal of the Ameri- can Chemical Society,Vol. 128, No. 1, 2006,pp. 42-43. doi:10.1021/ja056901v
[12] C. H. Nielsen, “Biomimetic Membranes for Sensor and Separation Applications,” Anal Bioanal Chem,Vol. 395, No. 3, 2009, pp. 697-718.
doi:10.1007/s00216-009-2960-0
[13] J. S. Hansen, M. Perry, J. Vogel, J. S. Groth, T. Vissing, M. S. Larsen, O. Geschke, J. Emneus, H. Bohr and C. H. Nielsen, “Large Scale Biomimetic Membrane Arrays,”
Analytical and Bioanalytical Chemistry,Vol. 395, No. 3, 2009, pp. 719-727. doi:10.1007/s00216-009-3010-7 [14] J. S. Hansen, M. Perry, J. Vogel, T. Vissing, C. R. Han-
sen, O. Geschke, J. Emneus and C. H. Nielsen, “Devel- opment of an Automation Technique for the Establish- ment of Functional Lipid Bilayer Arrays,” Journal of Mi- cromechanics and Microengineering, Vol. 19, No. 2, 2009, Article ID: 025014. doi:10.1088/0960-1317/19/2/025014 [15] J. Vogel, M. Perry, J. S. Hansen, P. Y. Bolinger, C. H.
metic Applications,” Journal of Micromechanics and Mi-croengineering,Vol. 19, No. 2, 2009, Article ID: 025026. doi:10.1088/0960-1317/19/2/025026
[16] L. Pelaez, V. Romero, S. Escalera, S. Ibragimova, K. Stibius, J. Benavente and C. H. Nielsen, “Electrochemical Characterization of Hydrogels for Biomimetic Applica- tions,” Polymers for Advanced Technologies,Vol. 22, No. 9, 2011, pp. 1381-1388. doi:10.1002/pat.2028
[17] Y. H. Wu, H. B. Park, T. Kai, B. D. Freeman and D. S. Kalika, “Water Uptake, Transport and Structure Charac- terization in Poly(Ethylene Glycol) Diacrylate Hydrogels,”
Journal of Membrane Science,Vol. 347, No. 1-2, 2010, pp. 197-208. doi:10.1016/j.memsci.2009.10.025
[18] D. Myung, D. Waters, M. Wiseman, P. E. Duhamel, J. Noolandi, C. N. Ta and C. W. Frank, “Progress in the Development of Interpenetrating Polymer Network Hy- drogels,” Polymers for Advanced Technologies,Vol. 19, No. 6, 2008, pp. 647-657. doi:10.1002/pat.1134
[19] L. Jensen, P. M. Mortensen, R. Trane, P. Harris and R. W. Berg, “Reaction Kinetics of Acetone Peroxide Formation and Structure Investigations Using Raman Spectroscopy and X-Ray Diffraction,” Applied Spectroscopy, Vol. 63, No. 1, 2009, pp. 92-97.
doi:10.1366/000370209787169687
[20] J. Benavente, M. I. Vázquez, J. Hierrezuelo, R. Rico, J. M. López-Romero and M. R. López-Ramirez, “Modification of a Regenerated Cellulose Membrane with Lipid Nano- particles and Layers. Nanoparticle Preparation, Morpho- logical and Physicochemical Characterization of Nano- particles and Modified Membranes,” Journal of Mem- brane Science, Vol. 355, No. 1-2, 2010, pp. 45-52. doi:10.1016/j.memsci.2010.03.004
[21] F. M. Andreopoulos, E. J. Beckman and A. J. Russell, “Light-Induced Tailoring of PEG-Hydrogel Properties,”
Biomaterials, Vol. 19, No. 15, 1998, pp. 1343-1352. doi:10.1016/S0142-9612(97)00219-6
[22] M. Ladd, “Introduction to Physical Chemistry,” 3rd Edi- tion, Cambridge University Press, Cambridge, 1998. [23] K. Y. Suh, J. Seong, A. Khademhosseini, P. E. Laibinis
and R. Langer, “A Simple Soft Lithographic Route to Fabrication of Poly(Ethylene Glycol) Microstructures for Protein and Cell Patterning,” Biomaterials,Vol. 25, No. 3, 2004, pp. 557-563.
doi:10.1016/S0142-9612(03)00543-X
[24] W. A. Green, “Industrial Photoinitiators,” CRC Press, Boca Raton, 2010.
[25] V. Krishnakumar and R. Mathammal, “Density Func-tional and Experimental Studies on the FT-IR and FT- Raman Spectra and Structure of Benzoic Acid and 3,5- Dichloro Salicylic Acid,” Journal of Raman Spectroscopy, Vol. 40, No. 3, 2009, 264-271.
doi:10.1002/jrs.2118
[26] K. Asaka, “Dielectric-Properties of Cellulose-Acetate Re- verse-Osmosis Membranes in Aqueous Salt-Solutions,”
Journal of Membrane Science,Vol. 50, No. 1, 1990, pp. 71-84. doi:10.1016/S0376-7388(00)80887-X
[27] J. Benavente, “Surface Electrical Phenomena in Mem- branes and Microchannels,” Transworld Research Net- work, Kerala, 2008.
[28] B. A. Boukamp, “A Package for Impedance Admittance Data-Analysis,” Solid State Ionics, Vol. 18-19, 1986, pp. 136-140. doi:10.1016/0167-2738(86)90100-1
[29] R. M. Pashley, M. Rzechowicz, L. R. Pashley and M. J. Francis, “De-Gassed Water Is a Better Cleaning Agent,”