RbCa
2Nb
3O
10from X-ray powder data
Zhen-Hua Liang,a,bKai-Bin Tang,a,b* Qian-Wang Chenb and Hua-Gui Zhenga
a
Department of Chemistry, University of Science and Technology of China, Hefei, Anhui 230026, People’s Republic of China, andbDepartment of Nanomaterials and Nanochemistry, Hefei National Laboratory for Physical Sciences at Microscale, University of Science and Technology of China, Hefei, Anhui 230026, People’s Republic of China
Correspondence e-mail: [email protected]
Received 7 May 2009; accepted 13 May 2009
Key indicators: powder X-ray study;T= 298 K; mean(Nb–O) = 0.003 A˚;Rfactor = 0.035;wRfactor = 0.053; data-to-parameter ratio = 9.2.
Rubidium dicalcium triniobate(V), RbCa2Nb3O10, has been synthesized by solid-state reaction and its crystal structure refined from X-ray powder diffraction data using Rietveld analysis. The compound is a three-layer perovskite Dion– Jacobson phase with the perovskite-like slabs derived by termination of the three-dimensional CaNbO3 perovskite structure along the ab plane. The rubidium ions (4/mmm symmetry) are located in the interstitial space.
Related literature
For the synthesis of RbCa2Nb3O10, see: Dionet al.(1981). For related three-layer Dion–Jacobson analogues, see: CsCa2Nb3O10(Dionet al., 1984); RbSr2Nb3O10(Thangadurai et al., 2001); KCa2Nb3O10 (Fukuoka et al., 2000). For the application of Dion–Jacobson phases, see: Thangaduraiet al. (2001); Liet al.(2007); Idaet al.(2008); Compton & Osterloh (2009). For properties of RbCa2Nb3O10, see: Thangadurai & Weppner (2001, 2004); Byeonet al.(2003).
Experimental
Crystal data
RbCa2Nb3O10
Mr= 604.34
Tetragonal,P4=mmm a= 3.85865 (6) A˚ c= 14.9108 (3) A˚ V= 222.01 (1) A˚3 Z= 1
CuKradiation T= 298 K
Specimen shape: flat sheet 10151 mm
Specimen prepared at 1423 K Particle morphology: plate-like,
white
PANalytical X’pert PRO diffractometer
Specimen mounting: packed powder pellet
Specimen mounted in reflection mode
Scan method: continuous 2min= 10.0, 2max= 110.0
Increment in 2= 0.02
Refinement
Rp= 0.035
Rwp= 0.053
Rexp= 0.008
S= 2.54
Wavelength of incident radiation: 1.54178 A˚
Profile function: pseudo-Voigt
238 reflections 26 parameters
Preferred orientation correction: March–Dollase (Dollase, 1986) AXIS 1 Ratio = 0.95964,h=k= 0, l= 1; correction range: min = 0.94007, max = 1.13156
Data collection: X’pert Data Collector (PANalytical, 2003); cell refinement:GSAS(Larson & Von Dreele, 2000) andEXPGUI(Toby, 2001); data reduction:X’pert Data Collector; method used to solve structure: coordinates taken from an isotypic compound (Thanga-duraiet al., 2001); program(s) used to refine structure:GSAS and EXPGUI; molecular graphics: VESTA (Momma & Izumi, 2008); software used to prepare material for publication:publCIF(Westrip, 2009).
The authors are grateful for financial support by the National Natural Science Foundation of China, the 973 Projects of China and the Program for New Century Excellent Talents in Universities (NCET).
Supplementary data and figures for this paper are available from the IUCr electronic archives (Reference: BR2107).
References
Byeon, S. H., Kim, H. J., Kim, D. K. & Hur, N. H. (2003).Chem. Mater.15, 383– 389.
Compton, O. C. & Osterloh, F. E. (2009).J. Phys. Chem. C.,113, 479–485. Dion, M., Ganne, M. & Tournoux, M. (1981).Mater. Res. Bull.16, 1429–1435. Dion, M., Ganne, M. & Tournoux, M. (1984).Rev. Chim. Mineral.21, 92–103. Dollase, W. A. (1986).J. Appl. Cryst.19, 267–272.
Ida, S., Ogata, C., Eguchi, M., Youngblood, W. J., Mallouk, T. E. & Matsumoto, Y. (2008).J. Am. Chem. Soc.130, 7052–7059.
Fukuoka, H., Isami, T. & Yamanaka, S. (2000).J. Solid State Chem.151, 40–45. Larson, A. C. & Von Dreele, R. B. (2000).GSAS. Los Alamos National
Laboratory, New Mexico, USA.
Li, L., Ma, R., Ebina, Y., Fukuda, K., Takada, K. & Sasaki, T. (2007).J. Am. Chem. Soc.129, 8000–8007.
Momma, K. & Izumi, F. (2008).J. Appl. Cryst.41, 653–658.
PANalytical (2003). X’pert Data collector. PANalytical BV, Almelo, The Netherlands.
Thangadurai, V., Beurmann, P. S. & Weppner, W. J. (2001).Solid State Chem.
158, 279–289.
Thangadurai, V. & Weppner, W. (2001).Ionics,7, 22–31.
Thangadurai, V. & Weppner, W. (2004).Solid State Ionics,174, 175–183. Toby, B. H. (2001).J. Appl. Cryst.34, 210–213.
Westrip, S. P. (2009).publCIF.In preparation. Structure Reports
Online
supporting information
Acta Cryst. (2009). E65, i44 [doi:10.1107/S1600536809018157]
RbCa
2Nb
3O
10from X-ray powder data
Zhen-Hua Liang, Kai-Bin Tang, Qian-Wang Chen and Hua-Gui Zheng
S1. Comment
The Dion-Jacobson phase which was first discovered by Dion et al. (1981), has a general formula A′[An-1BnO3n+1], where
A'is a monovalent ion, A is a divalent alkaline earth metal ion and B is a tetravalent or pentavalent transition metal ion.
Related crystal structures of three-layer Dion-Jacobson phase have been reported for KCa2Nb3O10 (Dion et al., 1984),
RbSr2Nb3O10 (Thangadurai et al., 2001), and KCa2Nb3O10 (Fukuoka et al., 2000). Although the three-layer Dion-Jacobson
phase RbCa2Nb3O10 was first synthesized by Dion et al. (1981), its crystal structure has not yet been reported. The
structure of RbCa2Nb3O10 has now been refined by the Rietveld method from powder diffraction data in the present
communication.
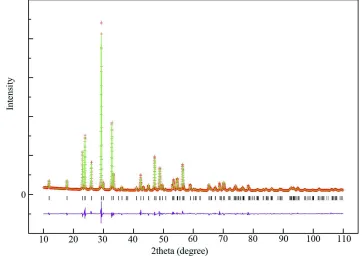
The observed, calculated and intensities difference plots of the Rietveld refinement are shown in Fig. 1. There are some
00 l preferential orientation which were often observed in the Rietveld refinement of the layered perovskites. Then we applied the March-Dollase option for a correction in the EXPGUI program and obtain the best result finally.
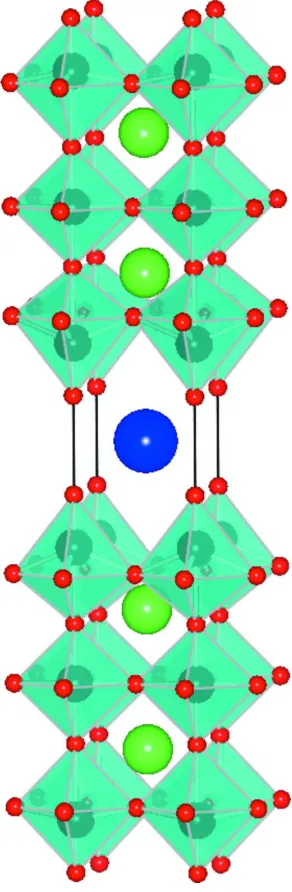
The structure of the compound is illustrated in Fig. 2. The structure consists of three layers of corner-sharing NbO6
octahedra that run perpendicular to the c axis; adjacent sets of layers are staggered.
Table 1 shows refined interatomic distances and angles for the RbCa2Nb3O10 structure. The octahedra forming the inner
layer are less distorted with Nb—O distances ranging from 1.876 (7) to 1.92932 (3)Å (Table 2), which is typical for
layered perovskites involving Nb(V). As it is well known in layered perovskites, the NbO6 octahedra forming the outer
layer of the slabs are characterized by off-centering of the Nb atoms, leading to four equal equatorial Nb—O distances
within the perovskite layers [1.9663 (11) Å], a short Nb—O bond toward the interlayer spacing [1.650 (8) Å], and a long
opposite Nb—O bond [2.379 (7) Å]. Such a distortion is quite similar to that encountered in homologous niobates and
tantalates where the niobium shows an out-of-plane distortion, moving away from the more positively charged calcium
towards the rubidium layer. Similar behavior has been observed in a number of d0 systems containing niobium, tantalum,
and titanium. This has been attributed to a second-order Jahn-Teller effect. Concerning the interlayer, the rubidium ions
are coordinated with eight terminal oxygen atoms to form the same eight Rb—O bonds [3.318 (4) Å]. These distances, as
for the Ca—O bonds [2.560 (4)–2.9207 (22) Å] are close to those commonly observed in layered perovskites.
S2. Experimental
RbCa2Nb3O10 powders were prepared by a conventional solid state reaction described previously (Byeon et al., 2003). All
starting materials were of analytical grade and were used without further purification. Stoichiometric amounts of CaCO3
and Nb2O5 with a 50% molar excess of Rb2CO3 were mixed together and heated in air at 1423 K for 24 h (heating rate 5
K /min). The calcination procedure was repeated one time after grinding to ensure a complete reaction. A 50% molar
excess of Rb2CO3 was used in the reaction to offset the volatilization of the alkali oxides at the synthesis temperature. The
products were washed thoroughly with distilled water to remove excess alkali oxides, and were then dried at 393 K
All peaks of the XRD pattern could be indexed on a tetragonal cell and the systematic absences show simple tetragonal
symmetry. The P4/mmm crystal structure of RbSr2Nb3O10 (Thangadurai et al., 2001) was used as a starting model for the
Rietveld refinement of the structure of RbCa2Nb3O10. The corresponding isotropic atomic displacement parameters of all
oxygen atoms are constrained to be equal. The March-Dollase option in the EXPGUI program was applied to correct 00 l
[image:3.610.123.486.169.425.2]preferential orientation which were often observed in the Rietveld refinement of the layered perovskites.
Figure 1
Rietveld difference plot for the multi-phase refinement of RbCa2Nb3O10. The red crosses, and green and pink lines show
respectively the observed, calculated and difference plots. Calculated Bragg reflection positions are indicated by black
Figure 2
The crystal structure of RbCa2Nb3O10. blue octahedron show NbO3 units with Nb5+ cations as black spheres and O
2-anions as red spheres. Large green spheres represent Ca2+ cations and large blue spheres Rb+ cations.
Rubidium dicalcium triniobate(V)
Crystal data
RbCa2Nb3O10
Mr = 604.34
Tetragonal, P4/mmm
Hall symbol: -P 4 2
a = 3.85865 (6) Å
c = 14.9108 (3) Å
V = 222.01 (1) Å3
Z = 1
Dx = 4.520 Mg m−3
Cu Kα radiation, λ = 1.54178 Å
T = 298 K
Particle morphology: plate-like white
flat sheet, 10 × 15 mm
PANalytical X'pert PRO diffractometer
Radiation source: sealed tube Graphite monochromator
Specimen mounting: packed powder pellet Data collection mode: reflection
Scan method: continuous
2θmin = 10.008°, 2θmax = 109.985°, 2θstep = 0.017°
Refinement
Refinement on F2 Least-squares matrix: full
Rp = 0.035
Rwp = 0.053
Rexp = 0.008
R(F2) = 0.08530
χ2 = 6.452 ? data points
Profile function: pseudo-Voigt
26 parameters 0 restraints
w = 1/[σ2(F
o2) + (0.0677P)2] where P = (Fo2 + 2Fc2)/3 (Δ/σ)max = 0.020
Preferred orientation correction: March–Dollase (Dollase, 1986) AXIS 1 Ratio= 0.95964, h = k = 0, l = 1. Prefered orientation correction range: min = 0.94007, Max = 1.13156
Fractional atomic coordinates and isotropic or equivalent isotropic displacement parameters (Å2)
x y z Uiso*/Ueq
Rb1 0.5 0.5 0.5 0.0433 (8)*
Ca1 0.5 0.5 0.14706 (19) 0.0281 (8)*
Nb1 0.0 0.0 0.0 0.0127 (6)*
Nb2 0.0 0.0 0.28537 (8) 0.0134 (5)*
O1 0.0 0.5 0.0 0.0716 (14)*
O2 0.0 0.0 0.1258 (5) 0.0716 (14)*
O3 0.0 0.5 0.2599 (4) 0.0716 (14)*
O4 0.0 0.0 0.3960 (6) 0.0716 (14)*
Geometric parameters (Å, º)
Rb1—O4 3.138 (4) Ca1—O3 2.560 (4)
Rb1—O4i 3.138 (4) Ca1—O3ii 2.560 (4)
Rb1—O4ii 3.138 (4) Ca1—O3iv 2.560 (4)
Rb1—O4iii 3.138 (4) Ca1—O3v 2.560 (4)
Rb1—O4 3.138 (4) Nb1—O1vi 1.9293 (1)
Rb1—O4 3.138 (4) Nb1—O1 1.9293 (1)
Rb1—O4 3.138 (4) Nb1—O1vii 1.9293 (1)
Rb1—O4 3.138 (4) Nb1—O1iv 1.9293 (1)
Ca1—O1 2.921 (2) Nb1—O2 1.877 (7)
Ca1—O1ii 2.921 (2) Nb1—O2 1.877 (7)
Ca1—O1iv 2.921 (2) Nb2—O2 2.379 (7)
Ca1—O1v 2.921 (2) Nb2—O3vi 1.9663 (11)
Ca1—O2 2.7468 (9) Nb2—O3 1.9663 (11)
Ca1—O2i 2.7468 (9) Nb2—O3vii 1.9663 (11)
Ca1—O2ii 2.7468 (9) Nb2—O3iv 1.9663 (11)
Ca1—O2iii 2.7468 (9) Nb2—O4 1.650 (8)
O1vi—Nb1—O1 180.0 O1iv—Nb1—O2 90.0
O1vi—Nb1—O1iv 90.0 O3vi—Nb2—O3 157.8 (3)
O1vi—Nb1—O2 90.0 O3vi—Nb2—O3vii 87.87 (6)
O1vi—Nb1—O2 90.0 O3vi—Nb2—O3iv 87.87 (6)
O1—Nb1—O1vii 90.0 O3vi—Nb2—O4 101.12 (16)
O1—Nb1—O1iv 90.0 O3—Nb2—O3vii 87.87 (6)
O1—Nb1—O2 90.0 O3—Nb2—O3iv 87.87 (6)
O1—Nb1—O2 90.0 O3—Nb2—O4 101.12 (16)
O1vii—Nb1—O1iv 180.0 O3vii—Nb2—O3iv 157.8 (3)
O1vii—Nb1—O2 90.0 O3vii—Nb2—O4 101.12 (16)
O1vii—Nb1—O2 90.0 O3iv—Nb2—O4 101.12 (16)
O1iv—Nb1—O2 90.0