Bachelor Assignment 01/03/2011
Industrial Engineering & Manangement Eef-‐Jan den Hartog
s0117714
University of Twente
Supply Chain Management
An in depth analysis of the export supply chains of Iris
Note of confidentiality
Due to the sensitive nature of the information in this research, names of companies, individuals, customers and locations have been modified. Companies are represented by names of flowers, and locations have been removed from this report. The research methodology and results are not affected. To obtain the original information, please contact BOZ of the faculty MB.
Management Summary
Lotus is the closures division of Hyacinth Inc., the world wide leader in packaging. Currently, one of their production locations for steel drum closures is IRIS, located in India. Besides sales to domestic and export customers in the Middle East, 52% of all products produced by IRIS are exported to Lotus sales centres and warehouses around the world.
Over the last years, the number of complaints regarding the unreliability of supply from IRIS has increased severely. In many cases, these issues had to be resolved by last minute re-‐allocating demand elsewhere in the Lotus network, which is very expensive in terms of transportation costs and heavily affects business of other production locations. Obviously, the image of Lotus being a reliable supplier is affected as well. These negative effects caused the need for a thorough research in order to improve the efficiency and reliability of supply from IRIS.
To achieve this, we used the Supply Chain Operations Reference (or SCOR®) model, developed by the Supply Chain Council in 1996 to standardize description and evaluation of supply chain processes, to acquire of a detailed understanding of the problems causing these inefficiencies and unreliability. Using the same methodology, we also developed solutions for the problems found. A large number of problems (‘disconnects’ in SCOR®) and potential solutions (‘best practices’ in SCOR®) were found. The ‘disconnects’ found were grouped and filtered, resulting in 9 key problems with supply from IRIS (see Figure 1). Similarly, the ‘best practices’ were grouped and filtered to identify 16 solutions that can solve the 9 key themes (again see Figure 1).
Figure 1 - From disconnect to solution
The key problem themes and solutions for these problems found during this research by using the SCOR® model are depicted in Table 1. All these solutions need to be developed into a detailed implementation schedule in order to solve the identified problems. Due to limitation in time, this research only developed this implementation schedule for the solution with the highest priority. With regards to this, we recommend Lotus® to:
- Use and configure the new ERP system. As IRIS’s new ERP system is due to go live on April 1st, 2011, all adjustments needed in the ERP system to solve the supply chain issues, mainly related to internal planning and communication, need to be completed before then.
performance when implementing the proposed solutions, the developed supply chain dashboard should be updated on a monthly basis.
- Develop implementation schedules for the remaining solutions. The remaining solutions will need to be developed in detailed implementation schedules in order to solve all problems found during this research.
Besides finding the key problems and presenting solutions for supply from IRIS, we like to believe that this research created the awareness needed to thoroughly improve and sustain the supply chain performance.
Key theme Solutions
Planning (internal)
• Use and configure new ERP system, which could potentially solve some supply chain related planning issues.
• Link ERP to SOP for customer communication. Communication should be a standard, repeatable process, possibly triggered by the ERP system.
Planning (external)
• Standardize lead-time for supply from IRIS. Lead-‐time for all customers should be equal, in order to facilitate production planning.
• Re-evaluated demand allocated to IRIS. Actual production volume does not meet total demand and production is at maximum capacity, hence some demand should be diverted elsewhere within the Lotus network. • Separate Customer A orders from Singapore orders. To facilitate planning
and avoid confusion, orders for Singapore and Customer A should be separated.
• Partial shipment of Customer A orders, with top priority. To prevent capacity issues in the warehouse and increase flexibility in production planning.
Packaging
• New sticker design including Lotus barcode. In order to solve issues with labeling, a new, standardized sticker should be designed.
• Container inspection. To eliminate the use of dirty and leaking containers, implement a thorough inspection of empty containers.
• Upgrade cartons. To prevent damaging products and packaging, upgrade the cartons to a higher quality.
Communication
• Develop SOP for customer communication. Communication should be a repeatable, standard process.
• Appoint/hire supply chain manager. Key in improving the supply chain performance is dedicating manpower to it.
Quality • Repair/reinstall visual check systems. To minimize delays caused by quality issues
Product Issues • Standardize descriptions and codes throughout the Lotus network. Descriptions and coding of products should be standard. Shipping/
Receiving • Develop proper warehouse management practices. In order to utilize capacity efficient and prevent in-‐house product damages.
Manufacturing
• Salaries and cross training of personnel. Make factory personnel more flexible and motivated.
• Upgrade production equipment. To increase production output and reliability, equipment should be upgraded.
Supply • Develop new supplier for Buna (square & round) washes. To decrease supplier dependency and eliminate non-‐availability of washers.
Table of content
Management Summary...3
Table of content ...5
1 Introduction ...6
2 Research Design...7
2.1 Research Goal... 7
2.2 Scope definition... 7
2.3 Research questions ... 8
2.4 Research method ... 9
2.5 Research Interest... 9
3 SCOR® methodology... 10
3.1 Introduction to the SCOR® model ...10
3.2 Using the SCOR® model ...15
3.3 SCOR® results in practice; the North America Project...16
3.4 Getting started ...17
4 Export supply chains ... 18
4.1 Products ...18
4.2 Export customers ...18
4.3 Supply chains...19
5 As-Is analysis of supply chains... 20
5.1 Level 2 configurations of the Lotus export supply chains...20
5.2 Level 3 processes of export supply chains ...23
6 Problems in the supply chains ... 29
6.1 Staple Yourself Interviews & disconnects ...29
6.2 Problem Statements...30
6.3 Key Themes...31
7 Analysis of solutions... 33
7.1 Separating the useful best practices...33
7.2 Best practices in IRIS’s unique business context ...33
7.3 Final solutions...36
8 Required action for solution implementation... 39
8.1 Use and configuration of ERP system...39
8.2 Supply chain dashboard ...40
9 Conclusions and Recommendations ... 42
9.1 Conclusions ...42
9.2 Recommendations...43
9.3 Recommendation for further research ...44
9.4 Discussion...44
10 References ... 46
Appendix A; SCOR® Project Roadmap ... 47
Appendix B; Example of a thread diagram... 48
Appendix C; SCOR® level 3 process elements... 49
Appendix D; SCOR® Enable processes... 52
Appendix E; Example flow chart... 53
Appendix F; Lotus® Steel Closures... 54
Appendix G; Reference of interviews... 56
Appendix H; Disconnects ... 57
Appendix I; Best Practices ... 61
1
Introduction
Steel drums are nowadays widely used for a variety of applications, ranging from the oil industry to transportation of chemicals and toxic waste. Hyacinth Inc. has been one of the largest producers of steel drums since the Second World War and almost doubled in size when they purchased Tulip Packaging NV, a Dutch based packaging firm from the 1920’s, in 2001 from Crocus-‐Tulip. After this acquisition, the company is now known as Hyacinth Inc. and is the leading firm in the packaging industry.
At the time of acquisition, part of Tulip Packaging NV was Lotus®, a closures division fulfilling the need for in-‐house closure production. Currently, Lotus® has 9 sales offices and 7 production locations word wide and produces high quality steel and plastic closures for a wide range of applications.
One of the Lotus® production sites is located in India. In 1994, a joint venture between Daisy & Co. Ltd., a large Indian multi-‐technology firm, and Tulip Packaging NV formed IRIS. Due to Indian regulations, the name has remained unchanged, even though Tulip is part of Hyacinth Inc. since 2001. The IRIS factory has 2 divisions; a steel closures division and a plastics division that produces plastic containers.
Even though IRIS produces high quality closures, the profit margins are relatively low and entrance barriers to the market are hardly present. Competitive advantage and profitability is therefore highly dependant on the efficiency of processes and the reduction of costs wherever possible. However, current performance of the closures production in terms of volume and reliability is lagging compared to other Lotus® Closures production locations and internal expectations. Therefore, Lotus® has initiated several projects to improve the performance of IRIS and ultimately increase competiveness of Hyacinth Inc. One of these projects is a supply chain improvement project supported by this research.
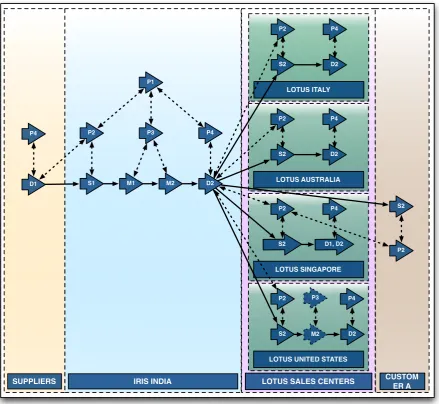
Currently, about 20% of IRIS’s total costs are caused by supply chain related activities (transportation, invoice handling, warehousing, etc) (Daisy -‐ Tulip, 2010). Obviously, handling these activities more efficient will result in considerable cost savings and increased reliability. Within this research, the current supply chain activities and opportunities for improving them will be investigated. Lotus® closures produced by IRIS are manufactured for export markets as well as domestic markets. A large part of the exported closures are dispatched to Lotus sales centres and warehouses, but other export customers (Iran and Saudi Arabia) and domestic customers are served as well (see Figure 2).
Figure 2 - Lotus supply chains
Suppliers
IRIS
Domestic
Export to Lotus
2
Research Design
To perform this research is a structured way, this chapter outlines the goal and the scope of this research, the research questions and methods used to achieve the research goal and finally outlines to who this research may be of interest.
2.1 Research Goal
The reliability (and thus the competitiveness) of any company is dependent on the delivery performance (in terms of reliability and delivery volumes) of its suppliers. Currently, the delivery of closures is unreliable, as only 55% of the orders are delivered on time (Daisy -‐ Tulip, 2010), causing the delivery of the sales centres and warehouses to be even more unreliable. In order to safeguard customers from this unreliability, the Lotus® sales centres and warehouses will have to dramatically increase safety stock levels and order increasing quantities of closures. As any inventory increase is expensive, Lotus tries to improve supplier reliability wherever possible to prevent this. As all Lotus® Closures to serve the South East Asia market are produced by IRIS, improving the reliability and efficiency of their processes is of great importance to Lotus. Several projects, as for example the implementation of an Enterprise Resource Planning (ERP) system, are initiated to support this desired increase in reliability and efficiency of IRIS.
This research will contribute to that by focussing on improving the supply chain processes of IRIS. The goal of this research is therefore to improve reliability and efficiency of supply from IRIS.
2.2 Scope definition
Due to limitations in time and resources, not all supply chain processes of IRIS will be researched. Some customers, products or processes are more important than others and they should be prioritized accordingly. Within this section, less important (parts of) supply chains will be excluded from further research.
This research will solely focus on export supply chains to customers within the Lotus group, leaving out domestic markets and other export customers. This is done for several reasons:
-‐ Lotus® has encountered some recurring problems with deliveries (incorrect deliveries, delayed deliveries, etc) from IRIS that affected their own business directly as described above. As such, Lotus® decided to initiate this supply chain project to improve upon these problems.
-‐ Second, the export to Lotus® sales centres in Italy and Australia combined with the warehouses in the United States and Singapore constitute for 52 % of IRIS’s total sales volumes (Figure 3), which makes it by far the largest (set of) customer(s) of IRIS (and thus the most important one).
One additional customer, that is not part of the Lotus® group, will be added to the scope of this research; a Korean company called Customer A. Customer A is within the top 5 customers of Hyacinth Inc worldwide. They used to be delivered from the Lotus warehouse in Singapore, but since October 2010, products are ordered from the Singapore warehouse, but shipped directly to Korea. This type of shipment will be referred to as drop shipments.
1 Domestic 2 Export Other 3 Export Lotus
Figure 3 - Total Sales IRIS 1st half 2010 (Daisy - Tulip, 2010)
By neglecting the domestic customers and other (non Lotus®) customers, this project will be able to solve some pressing issues for Lotus on a short term.
Another aspect that will be outside the scope of this research is the supply of raw material. As delivery performance of raw material suppliers is up to Hyacinth standards in terms of percentage of deliveries on time and accordance with contract agreements
(Iris, 2010), the supplier processes will be considered as static input. This will entail that the link between suppliers and IRIS will be part of this research, but the actual supplier processes are outside the scope of this research.
2.3 Research questions
In order to improve supply chain activities, it is eminent to know what these activities are, how they are currently performed, where problems occur and what improvement opportunities are. A very structured way of assessing supply chain performance is by using the Supply Chain Operations Reference (or SCOR®) model. This model, developed by the Supply Chain Council in 1996, is considered to be the new industry standard for describing supply chain activities and assessing supply chain performance (Wisner, Tan, & Keong Leong, 2009).
First, we need to know what the SCOR® model is, how to use it and what gains can be expected from using it. These topics will be answered in research question 1; How to use the SCOR® model? Once this is clear, we will use the SCOR® model to systematically analyse and improve the supply chains by following the SCOR® Project Roadmap (see Appendix A; SCOR® Project Roadmap). The phases as described in the project roadmap are converted into research questions that will guide this research. Per relevant phase of the SCOR® model, the matching research question is mentioned in Table 2.
After getting acquainted with the SCOR® model, we will start by determining which supply chains are within scope of this research (question 2), analyse how activities in these supply chain activities are performed (question 3), what problems with performing these activities cause the unreliability and low efficiency as mentioned earlier (question 4), what solutions the SCOR® model gives for these problems and which of these solutions are useful for Lotus® (question 5). Finally, we will go one step further then the SCOR® model by briefly investigating how the most promising solutions could be implemented in the business environment of IRIS (question 6). Table 2 also lists in which chapter each research question will be answered.
SCOR® Research question Ch
-‐ 1. How to use the SCOR® model? 3
Define scope 2. What are the supply chains of IRIS? 4
As-‐Is analysis 3. What is the current state of the supply chain activities? 5 Disconnects analysis 4. What are particular problems with the current state of the
described supply chain activities? 6
Best Practice & Opportunity analysis
5. How can these problems be resolved/improved upon? 7
Implementation 6. How can the solutions be implemented? 8
Table 2 - research questions
2.4 Research method
In order to obtain all the information necessary to perform this research, this section defines the appropriate data sources as well as the research method(s) per research question. Most of the information will come from either employees or data provided by the companies involved. If data is provided by one of the companies involved, Lotus® is listed as data source. An overview of the research methods and the data source per research question is given in Table 3.
For this research, a project team is established, consisting of the author, the factory manager and the senior manager Quality Assurance. Whenever necessary, the author consulted the other members of the project team will be during this research. Most research questions will be answered by performing a literature study. Research question 2, 3 and 4 however will be answered by extensively interviewing all staff involved, including the staff at the Lotus® sales centres, and critically reviewing procedures, documents and systems used.
Research question Research method Data source
1. SCOR® methodology Literature research Scientific literature
2. Supply chains of IRIS Interview Lotus
3. As-‐Is Analysis of supply chains Interview/data collection Lotus
4. Problems in the supply chain Interview Lotus
5. Solving/improving problems Literature research/brainstorm SCOR® Best Practices
6. Usefulness of solutions Brainstorm Lotus
7. Solutions implementation Literature research/brainstorm Scientific literature
Table 3 - Research methods
2.5 Research Interest
The outcomes of this research will be useful for several organizations and individuals. First and foremost this research will contribute to the business capabilities of Lotus. As this project will result in improvement opportunities for multiple companies within the researched supply chains, Lotus® will benefit in terms of supply chain efficiency and reliability.
Second, experiences acquired by the involved staff at IRIS can be used to perform similar studies for the supply chains that are outside the scope of this research; i.e. the domestic and other (non-‐Lotus®) export customers.
3
SCOR
®methodology
This chapter will provide an introduction into the basics of the SCOR® Methodology, as it’s understanding is vital for the rest of this research. First, the model itself will be discussed. Second, the relevant phases of the SCOR® Project Roadmap (see Appendix A; SCOR® Project Roadmap) will be discussed, as they provide a guide on how to use the SCOR® model in a SCOR® project. Finally, we will briefly elaborate on results from a previous SCOR® project.
3.1 Introduction to the SCOR® model
The Supply Chain Operations Reference (SCOR®) model was developed by the Supply Chain Council in 1996 in an attempt to standardize description and evaluation of supply chain processes. The model is nowadays widely used to describe and assess activities within a supply chain, benchmark performance against internal or industry standards and achieve improvements in delivery performance, sourcing cycle time and supply chain management cost (Wisner, Tan, & Keong Leong, 2009). The SCOR® model does not attempt to describe every business process or activity. More specific, the model does not address sales and marketing, product development, human resource, training, research and development and post delivery customer support.
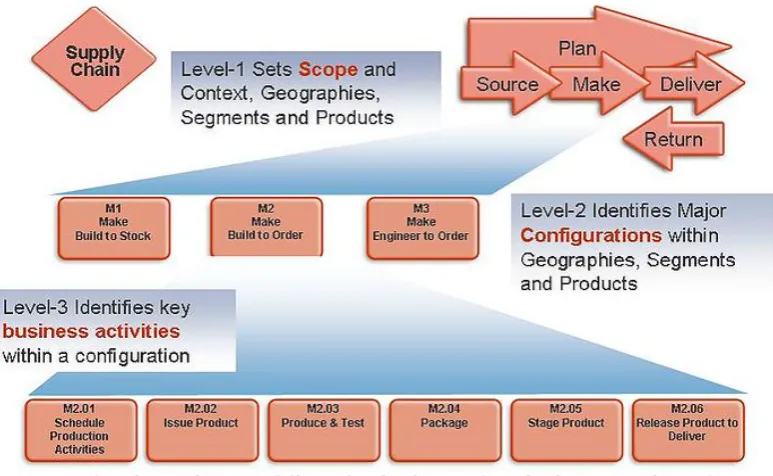
3.1.1 Outline of the SCOR® model & level 1 categories
The SCOR® model is organised around five core management processes; Plan, Source, Make, Deliver and Return, linking these activities for each company within the supply chain, from your supplier’s supplier to your customer’s customer (see Figure 4). By describing supply chains using these standard building blocks, the model can describe any supply chain using a common set of definitions, regardless of its complexity.
Figure 4 - SCOR® outline (Supply Chain Council, 2008)
Level 2 describes for each (level 1) category how that specific management process is configured; companies implement their operations strategy through the configuration they choose for their supply chain (Supply Chain Council, 2008). We will describe the level 2 processes in more detail in section 3.1.2.
Finally, level 3 defines for each (level 2) configuration the actual (operational) processes (or process elements as SCOR® calls them). See section 3.1.3 for a more detailed description. Figure 5 shows the hierarchy and the interaction between the different levels of the SCOR® model. As the level 2 configurations and the level 3 processes are key elements of describing a supply chain, they will be discussed further in detail.
Figure 5 - Relations between different levels of SCOR® (Supply Chain Council, 2008)
Besides the different levels, the SCOR® model also established three process types;
planning, execution and enable processes. A planning process aligns resources to meet expected demand on a strategic, long-‐term level. These strategic, long-‐term planning
processes are present in all 5 management processes (see Plan in Figure 4). Execution processes are performed on a tactical level. They include (short-‐term) scheduling and sequencing, transforming materials and services and moving products. All 3 levels of the management categories Source, Make, Deliver and Return are execution processes (see Figure 4). Finally, enable processes prepare, maintain and manage information or relations between business entities upon which planning and execution rely. The relation between the different levels and process types of the SCOR® model is clarified in Figure 6.
Figure 6 - SCOR® levels and process types Planning
Plan Source Make Deliver Return
Enable Plan
Enable Source
Enable Make
Enable Deliver
Enable Return Process type
Level 1 Level 2
Level 3
Proc
ess
level
[image:11.595.105.492.222.460.2] [image:11.595.119.482.645.745.2]
3.1.2 SCOR® level 2 configurations
Level 2 of the SCOR® model describes how each level 1 category is configured; it describes how companies implement the operations strategy they choose for their supply chain. The difference in configurations is strongly dependent on the influence of customer requirements (internal or external) on the process and is comparable with ‘conventional’ Customer Order Decoupling Points (CODP).
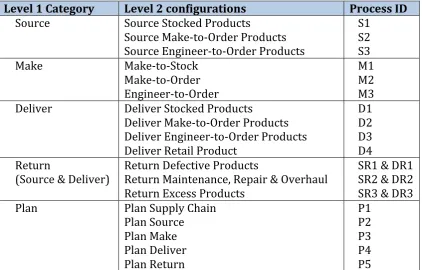
According to the SCOR® model, each of the level 1 execution processes (Source, Make, Deliver and Return) can be described using the level 2 configurations. For the Return processes, the SCOR® model distinguishes between two types of returns; Source Returns, describing the return process of sourced materials or products to the supplier and Deliver Returns, describing the return process of finished products from customers. Table 4 lists for each level 1 execution process the possible level 2 configurations and the process ID, which is used to facilitate modelling at a later stage.
As mentioned earlier, strategic, long-‐term planning processes are present in all 5 management processes. The level 2 configurations of the management process ‘Plan’ are therefore different from the level 2 configurations of the execution processes, as they are not related to the CODP (the term ‘configuration’ is therefore somewhat inapplicable, but is used anyway for the sake of unity within the SCOR® terminology). The level 2 configurations of ‘Plan’ relate to the execution process they provide the strategic and long term planning for (see Table 4). The only level 2 configuration of ‘Plan’ not directly related to an execution process is Plan Supply Chain; this configuration describes balancing resources and expected demand at the highest hierarchical level of the supply chain under consideration.
As said, the level 2 configurations are used to describe how companies have implemented their operations strategy. This implies that companies producing to stock (configuration M1) will also deliver products from stock (configuration D1). In general; the configurations of Make and Deliver processes are related. Source processes however can be configured differently; a company producing products according to customer specification (M2) can use standard materials (S1), possibly combined with customer specific materials (S2). A similar analogy as with Make and Deliver processes holds for Deliver and Source processes of different companies in the supply chain; if a company sources stocked products (S1), its supplier will obviously deliver stocked products (D1). Combining multiple configurations is also possible, as a company may produce stocked products as well as customer specific products (M1 and M2).
Level 1 Category Level 2 configurations Process ID
Source Source Stocked Products Source Make-‐to-‐Order Products Source Engineer-‐to-‐Order Products
S1 S2 S3
Make Make-‐to-‐Stock
Make-‐to-‐Order Engineer-‐to-‐Order
M1 M2 M3 Deliver Deliver Stocked Products
Deliver Make-‐to-‐Order Products Deliver Engineer-‐to-‐Order Products Deliver Retail Product
D1 D2 D3 D4 Return
(Source & Deliver) Return Defective Products Return Maintenance, Repair & Overhaul Return Excess Products
SR1 & DR1 SR2 & DR2 SR3 & DR3
Plan Plan Supply Chain
Plan Source Plan Make Plan Deliver Plan Return
P1 P2 P3 P4 P5
Table 4 - Level 2 configurations (Supply Chain Council, 2008)
3.1.3 SCOR® Level 3 processes
At this stage, all the processes (of the supplier(s), the company and the customer(s)) in the supply chain are described using the level 2 configurations and the relations and flows are modelled in a thread diagram. For each of the configurations listed in Table 4, the SCOR® model has defined specific level 3 process elements that are executed on an operational level. These level 3 process elements describe step by step what actual tasks are (or can be) executed within a certain configuration. For each of the level 2 configurations in Table 4, the corresponding level 3 process elements are listed in Appendix C; SCOR® level 3 . We see that for example Sourcing Stocked-‐Products (S1) consists of the elements Schedule Product Deliveries (S1.1), Receive Products (S1.2), Verify Product (S1.3), Transfer Product (S1.4) and Authorize Supplier Payment (S1.5). At this point, it is up the user to model the level 3 process elements of the supply chain under consideration in a flow chart. This flowchart depicts the flow of information and/or materials between different level 3 process elements within a certain company or business entity. Each company or other business entity in the supply chain is modelled in a separate flow chart. To keep the flowchart clear, it is convenient to keep the process elements performed by the same department/person on the same horizontal level. To construct a flowchart that best reflects the actual situation, some processes elements can be executed by multiple departments/persons whereas others may not be used at all.
[image:13.595.88.511.101.371.2]
given in Appendix D; SCOR® Enable processes. Looking again at sourcing products, it may very well be that the performance of suppliers is measured during the sourcing activities. This process is described by SCOR® as Assessing supplier performance (Process ID ES.2). The enable processes are put into the flow chart as well, as there presence (or absence) is key in understanding the supply chain performance. An example of a complete flow chart is given in Appendix E; Example flow chart.
3.1.4 Staple Yourself Interview
When arriving at this phase of SCOR®, we will have several flowcharts describing the flow of products and information within the different business entities in the supply chain. These flow chart will be the basis for the ‘Staple Yourself Interviews”. These extensive interviews are performed with every department (of every company) involved in the supply chain and are used to elaborate even further on daily operational tasks. The level 3 process elements as they were assigned to a specific department in the flow charts will guide this interview, as it tells the interviewer on what elements to focus. The goal of these interviews is to find the ‘disconnects’ that occur with executing daily activities. SCOR® defines ‘disconnects’ as the generation, misinterpretation, usage or absence of information, plans, schedules, personal capabilities and/or products that negatively affect supply chain efficiency and reliability (Supply Chain Council, 2008). These disconnects can occur in processes within a company (for example between department) as well as between different companies.
In order to identify the disconnects present within or between specific departments/ companies, the interviewer uses the Staple Yourself Worksheet, listing the name and accountable function of the interviewee, the relevant SCOR® process elements, the process steps, the technology used to execute the process, the business rules in place, a description of the disconnects found and ideas to improve the process. Each of these subjects will be briefly discussed.
-‐ Name and accountable function; list the name and accountable function of the interviewee.
-‐ SCOR elements; list the SCOR® level 3 process elements executed by the interviewee. This list is used to check whether all activities have been discussed during the interview.
-‐ Process steps; all steps in executing the level 3 processes as listed above are discussed, starting with where input (of information as well as material) comes from, how the process is executed and where output (of information as well as material) goes to.
-‐ Technology used; describes the technology used for executing the processes. This can be as simple as using a telephone to as complex as the support of an advanced IT-‐solution as for example an ERP system.
-‐ Business rules; lists corporate policies or special (standard operating) procedures that apply to the activities of the interviewee.
-‐ Disconnect description; lists all disconnects that were found during the interview. As stated before, a ‘disconnect’ can be anything; from order numbers that do not match between companies till untimely communications on delays.
3.1.5 From disconnect to best practice
The most important information subtracted from the staple yourself interviews are the ‘disconnects’. The user should indicate for each disconnect to what level 3 process element it applies. After this is done, the ‘disconnects’ will be grouped according to the field of problems it belongs to. For example, all disconnects relating to communicational issues will be grouped under ‘communication’. These categories are developed by the user; if a specific disconnect does not fit within one of the existing categories, create a new category until all disconnects are listed. These brainstorm categories are then used to group similar disconnects in a ‘problem statement’; a short description of the problems caused by the ‘disconnects’. By doing this, the total number of disconnects is reduced. After this, the problem statements are again grouped by defining certain key problem themes; areas that comprise many disconnects (and thus several problem statements). These key problem themes can be similar to the categories developed earlier, but that does not necessarily have to be the case.
After defining the key problem themes, the user should convert his attention towards the best practices database of the SCOR® model, which is accessible for all members of the Supply Chain Council. This database lists for each level 2 configuration proven best practices. This database is used to list the best practices for each problem area, by listing the best practices of each level 2 configuration per problem area. What we end up with is a list of problem areas, the SCOR® processes these specific problems relate to and potential solution to solve these problems and improve the processes. This is the output of the SCOR® model.
3.2 Using the SCOR® model
As we gained some understanding of the SCOR® model itself in the previous section, this section will focus on performing a project using the SCOR® model. This is done following the different phases of the SCOR® project roadmap (see again Appendix A; SCOR® Project Roadmap). Not all phases listed in the roadmap will be discussed, as some of them are left out of this research in accordance with the project description as given by Lotus®. This mainly comprises phase II; Metrics. This phase is normally used to assess the current performance of the supply chains. Given the large number of customer complaints with supply from IRIS, Lotus® has decided at this time to start a research for solutions rather than endlessly evaluate current performance. As metrics are important for any performance assessment, we will come back to this in section 8.3. The relevant phases of the project roadmap are briefly discussed.
3.2.1 Phase 0; Support
Gaining the right support for the project is of key importance for success. In this phase the project team is assembled, together with the hierarchical structure by which it will operate, whom it reports to and what other departments and/or persons are involved. 3.2.2 Phase I; Scope
Defining the scope of the project comprises defining the different supply chains, making a prioritisation and developing a project charter that will list the project scope, business need & benefits, the project approach, the project team & governance, deliverables, project timeline, assumptions, risks and constraints on the project.
3.2.3 Phase II; Metrics
Developing a scorecard and measuring supply chain performance, benchmarking the performance to internal or industry standards and defining the competitive requirements for you company; what measures need most improvement from a strategic point of view. Again, this phase will be excluded from this research.
3.2.4 Phase III; Analyze
This phase consists of a) creating a geographical map of the identified supply chain, graphically showing how products and information flows, b) developing a thread diagram that graphically shows the flow of information and products between the companies of the supply chain and c) starting with analysing the disconnects.
3.2.5 Phase IV; Work
Describing and analysing the activities related to the identified supply chains using the SCOR® model. Specifically assess transactions between subsequent level 3 process elements and analyse the best practices given by the SCOR® model.
3.2.6 Phase V; Implement
Analyse the improvement opportunities provided by the best practices of the SCOR® model on implementation effort, improvement potential and feasibility. Select the most promising one(s), based on the appropriateness and improvement potential and roughly define the project requirements for implementing the solutions, together with a plan for organizational deployment of that solution.
At this point, the SCOR® model and project stops. Developing any improvement opportunities into full proof implementation plans is a logical next step, but this is outside the scope of the SCOR® methodology.
3.3 SCOR® results in practice; the North America Project
This chapter will briefly discuss some results of a previous SCOR® project, to gain some insight in the expected results. In general, improving supply chain management by using the SCOR® model is expected to yield one or more of the following results (The Performance Measurement Group, 2011):
-‐ 25 – 50% reduction in total supply chain costs -‐ 25 – 60% reduction in inventory holding costs -‐ 25 – 80% increase in forecast accuracy
-‐ 30 – 50 % improvement in order-‐fulfilment cycle
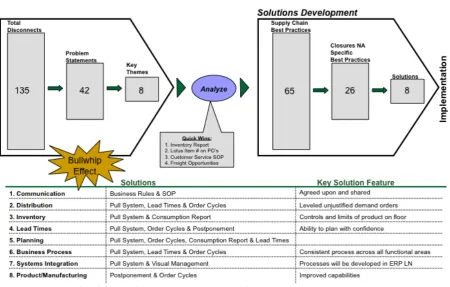
To see some of these results in practice, we will discuss a previous SCOR® study that was executed within Hyacinth Inc. In 2009, a SCOR® study was executed at Aster & Mfg, a company within the Lotus® group, in order to improve performance of supply chains leading to and going from Aster & Mfg. The project team followed the steps of the SCOR® project as described above, and came up with a total of 135 disconnects, grouped in 43 problem areas and leading to 8 key themes for improvement. Using the SCOR® best practices, they found 65 supply chain best practices, of which 26 were useful for the supply chain under consideration. After careful analysis, they found 8 solutions best solving the key problem themes, and 4 quick wins which could be implemented immediately in order to improve performance. These results are depicted in Figure 7. In order to visualize this process a bit more, consider the following; amongst the 135 disconnects found were the disconnects “Lack of proactive
communication to plant from Aster for changes in the purchase order or late shipment”, “Time zone variation” and “Phone call and/or emails not returned”. These disconnect were grouped together in the problem statement “Lacking proactive, timely and consistent feedback loop between Hyacinth and Aster”. This problem statement was then considered part of the key theme “Communication”.
Similar grouping exercises were performed for all solutions presented by the SCOR® best practices that could solve communicational issues, eventually leading to “Business Rules & Standard Operating Procedures (SOP)”. The best fitting solution to solve the communicational issues was to agree on business rules and SOP on how communication should be executed, complemented with pre-‐defined input and output channels and an accountable person for each step in the procedure. For the other 7 key themes, solutions were found in a similar way. The entire project yielded the following results (Hyacinth, 2009):
-‐ 20% improvement on perceived performance by Aster
-‐ Backordered line items improved from 6.08% in 2009 to 2.82 % in 2010 -‐ 94.96% On-‐time delivery to Hyacinth plants
-‐ 96.74% Fill Rate on Hyacinth orders
-‐ 94.58% Hyacinth compliance to agreed upon ordering lead times
Figure 7 - Results of the North America project (Hyacinth, 2009)
3.4 Getting started
[image:17.595.74.525.335.622.2]
4
Export supply chains
To answer the second research question and to determine which supply chains will be further researched, it is important to obtain some knowledge on products and (Lotus®) customers of IRIS, as any combination of these is a potential supply chain. After these topics are discussed, the final supply chains will be defined. As stated, the suppliers are outside the scope of this research and will not be discussed.
4.1 Products
Lotus® Closures are produced in a wide variety, ranging from small plastic plugs to large steel closure rings. IRIS only produces Steel Drum Closures (S.D.C.), Light Closures (L.C.) and light metal closures. The focus of this research will be on the S.D.C.’s, as the other products are not exported to Lotus® customers.
4.1.1 Flanges & Plugs
Steel closures consist of a flange and a plug and both come in 2 types; G2 (50mm in diameter) and G¾ (20mm in diameter). Flanges and plugs can be plated with a variety of coatings to protect them against different types of corrosion. Export flanges and plugs produced by IRIS are all zinc plated. For pictures of the different flanges and plugs see Appendix F; Lotus® Steel Closures.
4.1.2 Washers
In order to provide a reliable seal, the flanges and plugs can be fitted with a washer. Washers fitted on a flange ensure a reliable seal between the closure and the drum when the flange is fitted into the drum, whereas washers fitted on a plug ensure a reliable seal when the drum is closed off. Washers can only be fitted to plated flanges and plugs. Washer used for flanges are Black Nitrile (BN), Ethylene-‐Propylene-‐Diene-‐Monomer (EPDM), Poly Ethylene (PE) and the Dual washer (a combination of an EPDM washer and a smaller BN washer). For plugs, only BN, EPDM and PE washer are used. Normal washers have a square cross-‐section. Round ones however are also used upon customer request. See Appendix F; Lotus® Steel Closures for examples of different washers.
4.2 Export customers
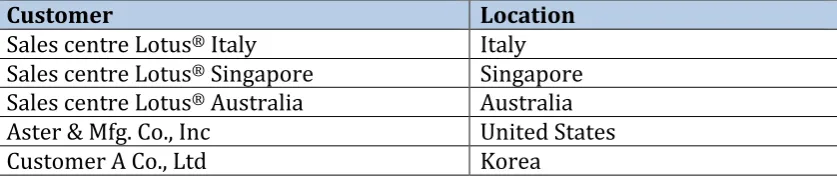
As explained earlier, the focus of this research is on customers of IRIS within the Lotus® group. Four major customers can be identified within this scope. The fifth customer under consideration is Customer A, for reasons stated earlier. The customers and their locations are listed in Table 5.
Customer Location
Sales centre Lotus® Italy Italy Sales centre Lotus® Singapore Singapore Sales centre Lotus® Australia Australia Aster & Mfg. Co., Inc United States
Customer A Co., Ltd Korea
[image:18.595.89.508.595.684.2]
4.3 Supply chains
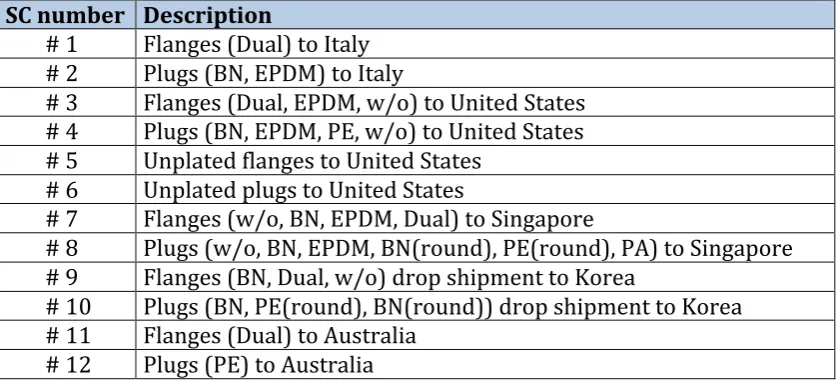
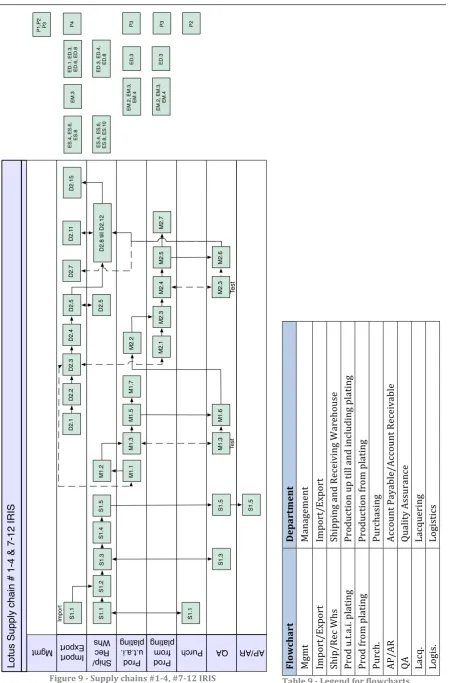
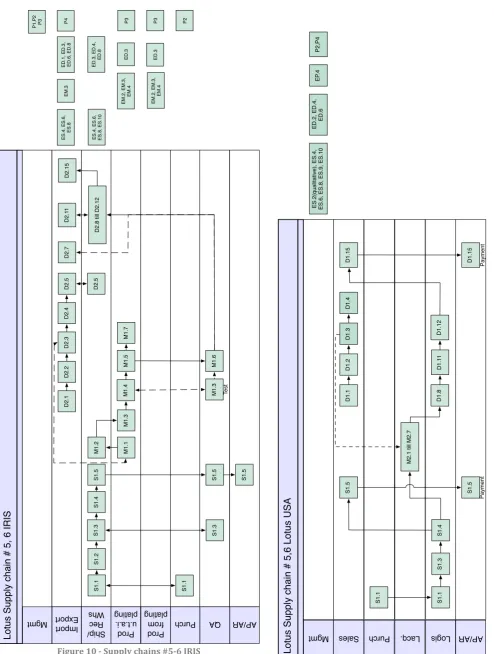
In order to determine the export supply chains within scope, the products are grouped into flanges and plugs, each with a specific destination/customer. The washer type used puts specific demands on the supply chain, as some washer are imported, whereas others are sourced locally. As suppliers are outside the scope of this research, this sourcing difference can be left out and the washer type no longer puts specific demands on the supply chain. For that reason they are considered to be a product family for a specific flange or plug. The various washer-‐types exported to a specific destination are put between brackets. Besides these combinations, IRIS also exports unplated flanges and plugs to the United States. As the production of these products differs somewhat from the plated closures, they are considered separately. All the above results in the supply chains listed in Table 6. Each of these supply chains will be analysed in detail in this research.
SC number Description
# 1 Flanges (Dual) to Italy # 2 Plugs (BN, EPDM) to Italy
# 3 Flanges (Dual, EPDM, w/o) to United States # 4 Plugs (BN, EPDM, PE, w/o) to United States # 5 Unplated flanges to United States
# 6 Unplated plugs to United States
# 7 Flanges (w/o, BN, EPDM, Dual) to Singapore
# 8 Plugs (w/o, BN, EPDM, BN(round), PE(round), PA) to Singapore # 9 Flanges (BN, Dual, w/o) drop shipment to Korea
# 10 Plugs (BN, PE(round), BN(round)) drop shipment to Korea # 11 Flanges (Dual) to Australia
# 12 Plugs (PE) to Australia
[image:19.595.89.508.282.472.2]
5
As-Is analysis of supply chains
The SCOR® model will be used to review the current state of activities for the supply chains defined in research question 3. Through extensive interviews (see Appendix G; Reference of interviews) with staff members and assessing day-‐to-‐day activities, procedures, documents and systems, this chapter will eventually provide the flowcharts, consisting of level 3 process elements, for all companies involved. Imported to keep in mind is that by defining the supply chains as we did in Chapter 4, we also defined across what business entities level 1 spans; IRIS as the centre company, the Lotus sales centres/warehouses as its customers and Customer A as the customer’s customer (see again Figure 4). The actual processes at the suppliers are still considered as static input. We will analyze the level 2 configurations for each of the identified supply chains in section 5.1 and discuss the appropriate level 3 process elements in section 5.2, resulting in the level 3 flowcharts.
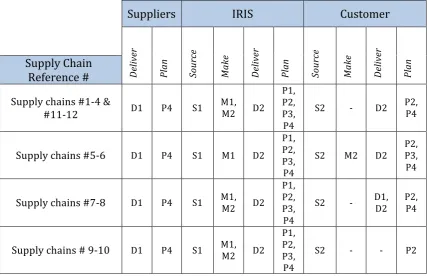
5.1 Level 2 configurations of the Lotus export supply chains
For each company in the supply chain, the level 2 configurations will be determined, starting with the supplier and ending at the customers.
Suppliers
As supplier processes are considered as static input (see section 2.2), we will only have to consider how and when products are delivered to IRIS in order to determine the configuration of the supplier delivery process. Again, the possible SCOR® level 2 configurations are listed in Table 4. After consulting with the purchasing department of IRIS, the delivery configuration turned out to be Deliver Stocked Products (D1), as agreements on delivery requirements and prices are already in place and suppliers deliver standard materials to IRIS from stock. Plan Deliver (P4) supports planning these deliveries.
IRIS
In order to find the level 2 configurations for IRIS, the project team was brought together to assess the Plan, Source, Make, Deliver and Return processes. The challenge was to translate ‘business as usual’ into the SCOR® configurations. After careful consideration, we established for each of the 5 management processes the following configurations:
Source; Obviously, as materials are delivered from stock (D1 with the supplier), the sourcing process at IRIS should have the same configuration. Hence, sourcing is done for all supply chains (#1-‐12) according to the Source Stocked Products (S1) configuration.
Deliver; Once the flanges and/or plugs are fitted with the right washer, they are directly shipped to the customer. As the second part of the production process is based on a specific customer order, the delivery process should be configured accordingly. Therefore, delivery in all supply chains is configured according to the Deliver-‐Make-‐to-‐ Order-‐Products (D2) configuration.
For supply chains #5 and #6, this appears to be incorrect, as they only require the production operations up till plating (part of the Make-‐to-‐Stock process) and hence delivery should be configured as Deliver-‐Make-‐to-‐Stock Products (D1). However, as unplated products are only produced upon specific customer request, the delivery is configured similar as with plated (and washered) products; Deliver-‐Make-‐to-‐Order Products (D2).
Return; Occasionally, IRIS receives complaints that products that are not in accordance with customer requirements on product type and/or quality. At this point, the non-‐ conform products are scrapped on customer site and IRIS is requested to replace them with new products. The same goes for raw material; some deliveries from suppliers are rejected and discarded at the IRIS factory. Suppliers are requested to replace the defective materials. As there is no physical return flow of products, Return processes will be excluded from further research.
Plan; The Source, Make and Deliver activities mentioned above are supported by Plan-‐ activities. After carefully analyzing the different planning activities, we found that Plan Supply Chain (P1), Plan Source (P2), Plan Make (P3) and Plan Deliver (P4) are accounted for at IRIS.
Customers
For each of the five customers that are part of this research, we have determined the level 2 configurations as well. As the different customers are geographically dispersed, this was done conductin