http://wrap.warwick.ac.uk/
Original citation:Alesina, Alberto, Michalopoulos, Stelios and Papaioannou, Elias (2013) Ethnic inequality. Working Paper. Coventry, UK: Department of Economics, University of Warwick. (CAGE Online Working Paper Series).
Permanent WRAP url:
http://wrap.warwick.ac.uk/59306 Copyright and reuse:
The Warwick Research Archive Portal (WRAP) makes this work of researchers of the University of Warwick available open access under the following conditions. Copyright © and all moral rights to the version of the paper presented here belong to the individual author(s) and/or other copyright owners. To the extent reasonable and practicable the material made available in WRAP has been checked for eligibility before being made available.
Copies of full items can be used for personal research or study, educational, or not-for-profit purposes without prior permission or charge. Provided that the authors, title and full bibliographic details are credited, a hyperlink and/or URL is given for the original metadata page and the content is not changed in any way.
A note on versions:
The version presented here is a working paper or pre-print that may be later published elsewhere. If a published version is known of, the above WRAP url will contain details on finding it.
WORKING PAPER SERIES
Centre for Competitive Advantage in the Global Economy
Department of Economics
Sep 2013
No.155
Ethnic Inequality
Alberto Alesina
Harvard University, NBER and IGIER
Stelios Michalopoulos
Ethnic Inequality
∗Alberto Alesina
Harvard University, NBER and IGIER
Stelios Michalopoulos Brown University and NBER Elias Papaioannou
London Business School and CEPR and NBER
First Draft: October 2012
Revised July 2013
Abstract
This study explores the consequences and origins of between-ethnicity economic inequality both across and within countries. First, combining satellite images of nighttime luminosity with the historical homelands of ethnolinguistic groups we construct measures of ethnic in-equality for a large sample of countries and show that the latter is strongly inversely related to comparative development. Second, differences in geographic endowments across ethnic home-lands explain a sizable portion of ethnic inequality contributing to its persistence over time. Third, exploiting across-district within-African countries variation using individual-level data on ethnic identification and well-being from the Afrobarometer Surveys we find that between-ethnic-group inequality is systematically linked to regional under-development. In this sample we also explore the channels linking ethnic inequality to (under) development, finding that ethnic inequality maps to political inequality, heightened perceptions of discrimination and undersupply of public goods.
Keywords: Ethnicity, Diversity, Inequality, Development, Geography
JEL classification Numbers: O10, O40, O43.
∗We thank Christian Dippel, Nathan Nunn, Debraj Ray, Andrei Shleifer, Enrico Spolaore, Pierre Yared, Romain
1
Introduction
Ethnic diversity has costs and benefits. On the one hand, diversity in skills, education, and en-dowments can enhance productivity by promoting trade and innovation, especially in advanced economies. On the other hand, ethnic diversity is often associated with poor policies, low public goods provision, conflict, and hatred. In fact a large literature shows a negative effect of ethno-linguistic fragmentation on various aspects of economic performance, with the possible exception of wealthy economies (see Alesina and Ferrara (2005) for a review). Income inequality may also have both positive and negative effects on development. On the negative side, a higher degree of income inequality may lead to conflict, crime, prevent the poor from acquiring education and/or lead to expropriation and lofty taxation discouraging investment. On the positive side, however, income inequality may spur innovation and entrepreneurship by motivating individuals. Further complicating the relationship between the two, a positive correlation between inequality and de-velopment may simply reflect Simon Kuznetz’s conjecture that industrialization translates into higher levels of inequality at the early stage of development; while at later stages the association becomes negative. Given the theoretical ambiguities (and data issues) perhaps it comes at no surprise that it has been very hard to detect empirically a robust association between inequality and development (see Benabou (2005) and Galor (2011) for surveys).
This paper puts forward and tests an alternative conjecture that focuses on the inter-section of ethnic diversity and inequality. Our thesis is that what mostly matters for development are economic differences between ethnic groups coexisting in the same country, rather than the de-gree of fractionalization per se or income inequality conventionally measured (i.e., independent of ethnicity). Inequality in income along ethnic lines is likely to lead to political inequality, increase animosity, and lead to discriminatory policies of one (or more) groups against the others. Fur-thermore, differences in preferences across both ethnic and income lines may lead to inadequate public goods provision, as groups’ ideal allocation of public goods will be quite distant. More-over, the presence of an economically dominant ethnic minority may lower support for democracy and free-market institutions, as the majority of the population usually feels that the benefits of capitalism go to just a handful of ethnic groups. Ethnic inequality often implies that well-being depends on group affiliation; hence it is more likely to generate envy and perceptions that the system is "unfair", more so than the conventionally measured economic inequality, since the latter can be more easily be thought of as the result of ability or effort.
groups with satellite images of light density at night, which are strong proxies of development and are available at a fine grid (see Henderson, Storeygard, and Weil (2012)). The cross-ethnic group inequality index is weakly correlated with the commonly employed -and notoriously poorly measured- income inequality measures at the country level. To isolate the cross-ethnic compo-nent of inequality from the overall inequality across regions, we also construct proxies of spatial inequality.
Second, we document a strong negative association between ethnic inequality and real GDP per capita at the country level. This correlation holds even when we condition on the overall degree of spatial inequality, which is also inversely related to well-being (an novel finding by itself). We also uncover that the negative correlation between ethnolinguistic fragmentation and development weakens considerably when we account for ethnic inequality; this suggests that it is the unequal concentration of wealth across ethnic lines that is detrimental for development rather than diversity per se.
Third, in an effort to shed light on the roots of ethnic inequality we construct measures reflecting differences in geographic endowments across ethnic homelands and show that the latter is a strong predictor of ethnic inequality. In contrast there is no link between contemporary ethnic inequality and historical variables capturing the type of colonization, state formation, legal origin, etc. Fourth, we show that contemporary development at the country level is also inversely related to inequality in geographic endowments across ethnic homelands.
Fifth, we examine the link between ethnic inequality and development using individual-level data from the Afrobarometer surveys, exploiting within-country across-district variation. Besides the immediate econometric benefits of looking within -rather than across countries- (effectively accounting for country-level fixed factors related to national institutions and policies, historical legacies, etc), this is quite useful for validating the cross-country results (based on luminosity and ethnographic maps) using detailed micro-level data. Specifically, we construct measures capturing between-group and within-group inequality utilizing information from roughly20,000 respondents in 16 Sub-Saharan countries on ethnic identification and well-being. Our analysis shows that -conditional on numerous individual characteristics- respondents residing in ethnically unequal districts are less educated and have lower standards of living. This pattern also holds when we exploit within-ethnicity variation (this is feasible as we observe respondents from the same ethnicity residing in multiple districts), effectively accounting for both unobserved ethnic features and migration.
channels showing that ethnic inequality goes in tandem with political inequality and discrimina-tion across ethnic lines. We then examine the link between ethnic inequality and public goods provision building on the large literature in political economy showing that in ethnically diverse countries (as well as regions and cities within the United States and some other countries) there is under-provision of public goods. Our analysis shows that even when one looks within the same country access to basic public goods, such as piped water, a sewage system, and electrification is systematically lower in districts characterized by high levels of ethnic inequality. While this association does not necessarily reflect a causal relationship, it pertains even when controlling for numerous individual characteristics (including proxies of wealth and well-being) and ethnicity fixed effects. Finally, we examine the link between ethnic inequality and individual beliefs on the merits of democracy. This investigation is motivated by the influential thesis of Chua (2003), who argues that the spread of democracy (and free market institutions) since the 1990s does not necessarily lead to improved economic efficiency, when wealth is concentrated across ethnic lines. The uncovered evidence is supportive of this conjecture. Respondents found in ethnically un-equal districts feel unfairly treated by the government and are less satisfied with the functioning of democratic institutions.
Related Works While both the literature linking ethnolinguistic diversity and economic
performance and the literature studying the interplay between inequality and development are voluminous, there have been very few works examining the role of ethnic inequality on well-being. Exploiting data from29developing countries (from the Demographic and Health Surveys), Kyriacou (2013) finds that socioeconomic ethnic group inequalities reduce government quality. Cederman, Weidman, and Gleditch (2011) combine proxies of local economic activity from the G-Econ database with ethnolinguistic maps to construct an index of ethnic inequality for a sub-set of "politically relevant ethnic groups" (as defined by Ethnic Power Relations Datasub-set) and then show that in highly unequal countries, both rich and poor groups fight more often than those groups whose wealth is closer to the country average.
Structure The paper is organized as follows. In section2 we describe the construction
explore the channels linking ethnic inequality to development. In the last section we summarize and discuss potential avenues for future research.
2
Data and Descriptive Statistics
Since data on income-wages at the ethnicity level are not readily available for a large number of countries, to construct proxies of ethnic inequality for a large number of countries we combine information from ethnographic maps on the location of ethnic-linguistic groups with satellite images on light density at night that are available at a fine grid and can thus be aggregated at the historical ethnic homeland level. In this Section we discuss the construction of the cross-country measures capturing inequality in development (as reflected in luminosity) across ethnic homelands and across regions within 173countries.
2.1 Location of ethnic groups
We identify the location of ethnic groups employing two data sets/maps. First we use the Geo-Referencing of Ethnic Groups (GREG), which is the digitized version of theSoviet Atlas Narodov Mira (Weidmann, Rod, and Cederman (2010)). GREG portrays the homelands of 1,276 ethnic groups around the world. The information pertains to the early 1960’s so for many countries, in Africa in particular, it corresponds to the time of independence.1 The GIS data set uses the political boundaries of 1964to allocate groups to different countries. We thus project the ethnic homelands to the political boundaries of the 2000Digital Chart of the World (ignoring polygons of less than1km2
); this results in2,125ethnic homelands within contemporary countries. Most areas (1,630) are coded as pertaining to a single group whereas in the remaining495there can be up to three groups. For example, in Northeast India along an area of 4,380 km2 the Assamese, the Oriyas and the Santals overlap. In these cases we assign the respective homeland to all groups. The size of ethnic homelands varies considerably. The smallest polygon occupies an area of1.15 km2 (French in Monaco) and the largest extends over7,335,476km2 (American English in the US). The median (mean) group size is 4,198 (61,506)km2. The median (mean) country has8 (11.52) ethnicities with the most diverse being Indonesia with 94groups.
Our second source is the 15th edition of Ethnologue (Gordon (2005)) that maps 7,570 linguistic groups (using the political boundaries of2000 for the geo-referencing). In spite of the detailed linguistic mapping, Ethnologue’s coverage for some continents (e.g., Latin America) is limited while for others (i.e. Africa and Asia) is very detailed. Ethnologue’s mapping corresponds to the early 1990’s; thus the location of ethnic groups may be affected by national policies, conflict,
1The originalAtlas Narodov Mira consists of57ethnographic maps. The original sources are: (1) ethnographic
or other features. Each polygon in the Ethnologue delineates a traditional linguistic region; populations away from their homelands (in cities, refugee camps) are not mapped. Groups of unknown location, widespread and extinct languages are not mapped, the only exception is the English in the United States. Ethnologue also records areas where languages overlap; in this case we assign the polygon to all languages. Ethnologue provides a more refined linguistic aggregation compared to the GREG. As a result the median (mean) homeland extends to728(12,986)km2
. The smallest language is the Domari in Israel which covers 1.18km2 with the largest group is the English in the US covering9,327,331 km2. The median (mean) country has9 (41.9) groups with Papua New Guinea being the most diverse country with791linguistic groups.
GREG attempts to map major immigrant groups whereas Ethnologue generally does not. This is important for countries in the New World. For example, in Argentina GREG reports 16 groups, among them Germans, Italians, and Chileans, whereas Ethnologue reports20purely indigenous groups, such as the Toba and the Quechua. For Canada Ethnologue lists 77 mostly indigenous groups, like the Blackfoot and the Chipewyan with only English and French being his-torically non-indigenous; in contrast GREG that lists23groups is featuring many non-indigenous groups, such as Swedes, Russians, Norwegians and Germans. Hence, the two ethnolinguistic map-pings capture different cleavages, at least in some continents.2
2.2 Luminosity
Since comparable data on income per capita at the ethnicity level across all countries in the world do not exist, following Henderson, Storeygard, and Weil (2012) and subsequent studies (e.g., (Chen and Nordhaus (2011), Pinkovskiy (2011), Michalopoulos and Papaioannou (2012, 2013)) we use satellite image data on light density at night as a proxy.3 The luminosity data come from the Defense Meteorological Satellite Program’s Operational Linescan System that reports images of the earth at night. The six-bit number that ranges from 0 to 63 is available approximately at every square kilometer since1992. To construct luminosity at the desired level of aggregation we average all observations falling within the boundaries of an ethnic group and then divide with the population of each area using data from the Gridded Population of the World that reports geo-referenced pixel-level population estimates for 1990and2000.4
2We are including all groups in our analysis without attempting to make a distinction as to which cleavage is
more salient.
3These -and other works- show that luminosity is a strong correlate of development at various levels of
aggre-gation (countries, regions, ethnic homelands).
4The data is constructed using subnational census and other surveys of population at various levels (city,
2.3 Ethnic Inequality
We proxy the level development in ethnic homelandiwith average luminosity per capita,yi, and construct the Gini index that reflects inequality across ethnic groups (ethnic inequality) for each country. Specifically, the Gini coefficient for a country’s population consisting of ngroups with values of luminosity per capita for the historical homeland of ethnicityi,yi, wherei= 1to nare indexed in non-decreasing order (yi≤yi+1), is calculated as follows:
G= 1
n(n+ 1−2 n
i=1(n+ 1−i)yi n
i=1yi )
Note that the ethnic Gini index captures differences in mean income -as captured in lumi-nosity per capita at the ethnic homeland- across groups. For each of the two different linguistic maps we construct Gini coefficients for the maximum sample of countries using cross-ethnic-homeland data in 1992, 2000, and 2009. As a robustness we also construct the Gini coefficient dropping the capital cities and excluding small ethnicities, defined as those capturing less than 1% of the 2000 population in a country. For example, in Kenya the Atlas Narodov Mira (the Ethnologue) maps19(53) ethnic (linguistic) areas. Yet7ethnic (37linguistic) areas are less than one percent of the Kenya’s population as of2000. We thus construct the ethnic Gini index using all ethnic groups (19and 53), but also just using the12large ethnic and16 large linguistic areas in Kenya, respectively.
2.4 Spatial inequality
Since we use ethnic homelands (rather than individual-level) data to measure between-group inequality, the ethnic inequality measures also reflect regional disparities in income (that may not be related to ethnic diversity). To isolate the between-ethnicity component from regional inequality, we thus also construct Gini coefficients reflecting the overall (rather than the ethnic) degree of spatial inequality in each country. Since we couldn’t find a widely-accepted way to measure spatial inequality, we construct for robustness two measures of the overall degree of spatial inequality in each country.
Spatial Gini Coefficient 1. This index is based on aggregating luminosity per capita
across roughly equally-sized boxes. We first generate a global grid of pixels of2.5by 2.5decimal degrees (that extends from −180 to 180degrees longitude and from 85degrees latitude to −65 degrees latitude). Second, we intersect the resulting global grid with the 2000Digital Chart of the World that portrays contemporary national borders; this results in 4,512 pixels across the globe falling within country boundaries. The median (mean) pixel extends to 25,967 (29,780) km2, being comparable to the size of ethnic homelands in the GREG dataset, when we exclude
pixel (of 2.5x2.5 decimal degrees) we compute luminosity per capita in 1992, 2000, and 2009. Fourth, we aggregate the data at the country level estimating a Gini coefficient that captures the overall degree of economic spatial inequality.
Spatial Gini Coefficient 2 Virtual countries created by the 2.5 by 2.5 degree boxes
are on average somewhat larger than ethnic homelands; moreover, because of the fixed grid dimensionality, smaller countries end up having fewer boxes. Hence, to capture spatial inequality at a level of aggregation similar to the one in the data we also constructed an index of spatial inequality based on Thiessen polygons. The latter have the unique property that each polygon contains only one input point, and any location within a polygon is closer to its associated point than to the point of any other polygon. Importantly, we use as input points the centroids of the linguistic homelands according to theEthnologuedataset. Thus, Thiessen polygons have theexact same centroid as the actual linguistic homelands in the Ethnologue database; the key difference being that ethnic homelands rather than being symmetric polygons have idiosyncratic shapes. We then intersect the7,570Thiessen polygons with the country boundaries in2000 obtaining a total of9,116grids. We then construct a spatial Gini coefficient that reflects inequality in lights per capita across Thiessen polygons.5 The mean size of the Thiessen polygons is14.809km, very similar to the mean size of homelands in theEthnologue (12,964km2).
It is important to realize that both proxies of the overall degree of spatial inequality also reflect inequality across ethnic homelands, since (i) there is clearly some degree of measurement error on the exact boundaries of ethnic regions and (ii) because population mixing is in practice higher than the one we observe in the data. Moreover, in countries with large groups the spatial Gini coefficients may also (partially) capture within-ethnic-group inequality. We thus (almost) always include both the ethnic inequality and the overall spatial inequality index in the empirical specifications.6
2.5 Example
Figures1a−1b provide an illustration of the construction of the ethnic inequality measures for Afghanistan. TheAtlas Narodov Mira maps31ethnicities (Figure1a). The Afghan is the largest group that consists of the Pashtuns and the Pathans residing in the southern and central-southern regions. This group takes up51%of the population in2000. The second largest group is the Tajik, who compose22%of the population and are located in the north-eastern regions and in scattered
5To focus on non-trivial grids in terms of size for both the Thiessen polygons and the2.5by2.5decimal degree
boxes we drop those polygons capturing an area of less than100square kilometers.
6In principle one could generate within-group inequality measures using the finer structure of the luminosity
pockets in the western part of the country. There are 8 territories in which groups overlap. We first estimate for each of the 31 homelands luminosity per capita. For groups appearing in multiple pockets we derive the weighted average of lights per capita using as weights the fraction of each pocket’s surface area to the total area of the group in the country. Figure1bportrays the distribution of lights per capita. Regional development is low in the center of the country, where the Hazara-Berberi reside and in the eastern provinces, where the Nuristani, the Pamir Tajiks, the Pashai, and the Kyrgyz tribes are located. Luminosity is higher in the Pashtun/Pathans homelands and to some lesser extent in the Tajik regions. Second, using lights per capita across all homelands we estimate the Gini coefficient in 1992, in 2000, and in 2009. In 2000 the Gini coefficient estimated from GREG is 0.93 very close to the estimate when we use Ethnologue that maps 39 groups (0.90). We also estimated the ethnic inequality measures excluding the ethnic homeland where the capital, Kabul, falls; and we also estimated Gini coefficients of ethnic inequality excluding groups constituting less than1%of the country’s population.
Figures2a−2billustrate the construction of the overall spatial inequality indicators (Gini coefficients) using the two different methods. When we divide the globe into pixels of2.5 x 2.5 decimal-degree boxes we get24areas in Afghanistan (Figure2a). When we use Thiessen polygons we get 56 pixels in Afghanistan (Figure 2b). After estimating for each pixel, average luminosity per capita, we aggregate at the country level calculating the Gini coefficient across these pixels. The resulting measures, overall spatial inequality Gini index1and2for Afghanistan equal0.722 and 0.827,respectively.
2.6 Descriptive Analysis
2.6.1 Ethnic Inequality around the World
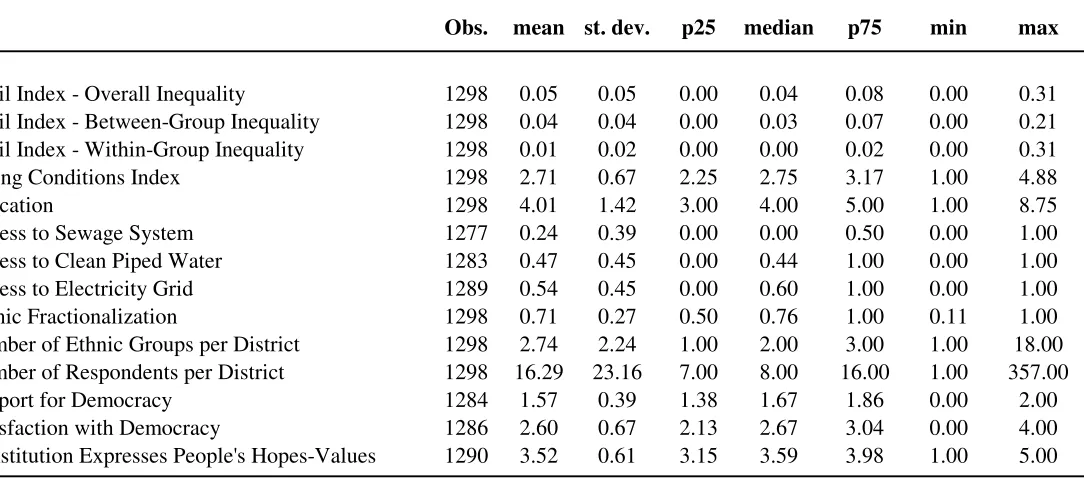
Table 1 - Panel A reports summary statistics, while Appendix Table 1, Panels A and B report the correlation structure of the ethnic Gini coefficients between the two global maps in different points in time. The correlation of the Gini coefficients across the two alternative mappings is strong, around 0.75−0.80. In the relatively short period where luminosity data are available (1992−2009), ethnic inequality appears very persistent, as the correlations of the Gini coefficients over time exceed0.9. Given the high inertia, in our empirical analysis we will exploit the cross-country variation. The correlation between ethnic inequality and the overall spatial inequality indicators is high, but far from perfect; ranging between0.6−0.8.
(Gini index higher than 0.90). According to the Ethnologue’s more detailed mapping of ethnic homelands the countries with the highest cross-ethnic-group inequality (where Gini exceeds0.90) are: Chad, Sudan, Papua New Guinea, Brazil, Ethiopia, Angola, Nigeria, Zimbabwe, Zaire, Cameroon, Laos and Indonesia. The countries with the highest overall spatial inequality in light density according the measure based on Thiessen polygons (spatial Gini 2 is higher than 0.90) are Chad, Papua New Guinea, Zaire, Gabon, Congo, the Central African Republic, and Sudan.
Since we are primarily interested in uncovering the explanatory power of ethnic inequality beyond the overall spatial inequality in most specifications we control for the latter. Figures 3e−3f portray the global distribution of ethnic inequality partialling out the effect of the overall degree of spatial inequality. In Figures4a-4bwe plot ethnic inequality against the overall degree of spatial inequality. A few interesting patterns emerge. On the one hand, Sudan, Afghanistan, and Mongolia have much higher ethnic inequality as compared to the overall spatial inequality (which is also very high). In contrast, USA and Canada score low in ethnic inequality as compared to the overall degree of spatial inequality (which is high). On the other hand, Azerbaijan, Syria, Albania, Tunisia, Haiti, and Rwanda score quite high in ethnic inequality, while in contrast the overall degree of spatial inequality is quite low.
2.6.2 Basic Correlations
Ethnic Diversity Appendix Table 1 - Panel C reports the correlation structure between the
various ethnic inequality and spatial inequality measures with the widely-used ethnolinguistic fragmentation measures. There is a positive correlation between ethnic inequality and linguistic-ethnic fractionalization (0.38−0.45) (data come from Alesina, Devleeschauwer, Easterly, Kurlat, and Wacziarg (2003))). In contrast, there is no systematic association between ethnic inequal-ity and religious fractionalization. Figures 5a− 5b provide a graphical illustration (including continental fixed effects does not change the pattern). The correlation between ethnic inequal-ity and the segregation measures compiled by Alesina and Zhuravskaya (2011) is also positive (0.20−0.45). Ethnic inequality tends to go in tandem with segregation. This is reasonable since more mixing of groups may lead to a reduction of ethnic-based inequality, which instead is more likely to persist when groups are geographically separated. We also examine the association be-tween ethnic inequality and spatial inequality with the ethnic polarization indicators of Montalvo and Reynal-Querol (2005) and Esteban, Mayoral, and Ray (2012), failing to detect a systematic association. These results show that the ethnic inequality measure captures a dimension distinct from already-proposed aspects of a country’s ethnic composition.
Income Inequality We then examined the association between ethnic inequality and
The income Gini coefficient is taken from Easterly (2007) who using survey and census data compiled from the WIDER (UN’s World Institute for Development Economics Research) con-structs adjusted cross-country Gini coefficients for more than a hundred countries over the period 1965−2000. Figures 6aand 6b illustrate this association using the GREG and theEthnologue mapping of ethnic homelands, respectively. The correlation between ethnic inequality and eco-nomic inequality is moderate, around0.25−0.30. Yet this correlation weakens considerably and becomes statistically insignificant once we simply condition on continental constants.
3
Ethnic Inequality and Development
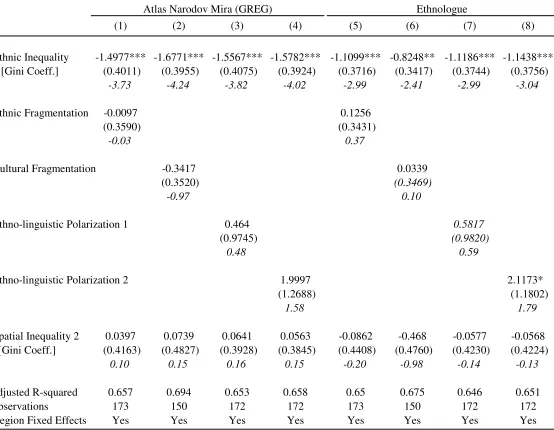
In Table 3 we report cross-country LS estimates associating the log of per capita GDP in 2000, with ethnic inequality (Appendix Table 1 - Panel D reports the unconditional correlation of ethnic inequality with various proxy measures of economic and institutional development). In Panel A we use the ethnic inequality measure using theAtlas Narodov Mira database, while in PanelBwe use the measures derived fromEthnologue’s mapping. In all specifications we include region fixed effects to account for continental differences in the coverage of ethnic groups and the huge variation in economic development.
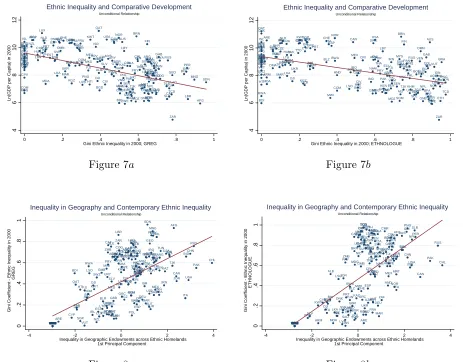
The coefficient of the ethnic inequality index in column (1) is negative and highly significant. Figures7a−7billustrate the unconditional association.7 The estimates in columns (2) and (4) also reveal a negative association between development and the overall degree of spatial inequality, as reflected on the Gini coefficient based on pixels of 2.5 by 2.5 degrees and the Gini coefficient based on Thiessen polygons that have the same centroid as ethnic homelands in theEthnologue. This suggests that underdevelopment goes in tandem with regional inequalities.8 In columns (3) and (5) we include both the ethnic inequality index and the spatial Gini coefficients. The ethnic inequality index continues to enter with a highly significant estimate that falls only slightly in absolute value. In contrast the coefficient on the overall spatial inequality drops considerably in all permutations; moreover the estimate becomes statistically indistinguishable from zero. This suggests that the ethnic component of regional inequality is the relatively stronger correlate of underdevelopment.9
In columns (6)-(9) we add the log number of ethnic/linguistic groups in the empirical model.
7The correlation is somewhat weaker in2009,0.60and0.51with the GREG and the Ethnologue maps,
respec-tively; the correlation is somewhat stronger in1992(0.67and0.60,respectively).
8This -to the best of our knowledge novel- result is interesting by itself and deserves future work in
understand-ing the inter-play between development and regional disparities in income (see Bolton and Roland (1997) for a theoretical exposition).
9There is clearly some degree of measurement error on the exact boundaries of ethnic homelands, while by
In line with previous works, income per capita is significantly lower in countries with many ethnic (Panel A) and linguistic (Panel B) groups (column (6)); yet the estimates in columns (7)-(9) clearly show that it is ethnic inequality rather than ethnolinguistic heterogeneity that correlates with underdevelopment. In columns (10)-(11) we examine whether the significantly negative association between ethnic inequality and income per capita is driven by an unequal clustering of population across ethnic homelands; to do so we construct Gini coefficients of population combining the population estimates in 2000 from the Gridded Population of the World dataset with the mapping of ethnolinguistic groups. The population Gini index enters with a significantly negative estimate, implying that under-development is associated with an unequal clustering of population across ethnic regions. Yet once we include in the specification the ethnic inequality index and the overall spatial inequality indicators (in (11)), the population Gini coefficient index turns insignificant. The same applies with the spatial Gini coefficient. In contrast the ethnic inequality measure retains its economic and statistical significance.
The most conservative estimate on the ethnic inequality index in Panel A (1.08) implies that a reduction in the ethnic Gini coefficient by 0.25 (approximately one standard deviation, from the level of Nigeria where the ethnic Gini is0.76to the level of Namibia where the ethnic Gini is0.50) is associated with a 31%(0.27 log points) increase in per capita GDP. The standardized beta coefficient of the ethnic inequality index is around0.20−0.30, quite similar to the works on the role of institutions on development (e.g., Acemoglu, Johnson, and Robinson (2001)).
3.1 Sensitivity Analysis
Other Aspects of the Ethnic Composition In Table3we investigate whether other
dimensions of the distribution of the population across groups, related to fractionalization and polarization, rather than inequality across ethnic lines affect comparative development. In columns (1) and (5) we augment the specification with a fractionalization index (from Alesina, Devleeschauwer, Easterly, Kurlat, and Wacziarg (2003)) whereas in columns (2) and (6) we exper-iment with Fearon’s (2003) cultural fragmentation index that adjusts the fractionalization index for linguistic distances among ethnic groups. Doing so has no effect on the coefficient on ethnic inequality that retains its economic and statistical significance. Moreover, the fractionalization indicators enter with unstable and statistically insignificant estimates.
both the polarization and the fractionalization indicators; in all perturbations the coefficient on ethnic inequality retains its statistical and economic significance.
Alternative Measures and Geographic Controls In Table 4 we augment the
spec-ification with additional controls and experiment with alternative ethnic inequality proxies. In columns (3), (4), (9), and (10) we use ethnic Gini coefficients that exclude ethnic regions where capitals fall. In columns (5), (6), (11), and (12) we use ethnic Gini indicators that exclude groups that constitute less than1% of a country’s population.10 In all specifications we control for the overall degree of spatial inequality in lights per capita using the spatial Gini index that is based on Thiessen polygons and ethnic fractionalization.
In odd-numbered columns we control for a country’s size with the log of population in2000 and log land area, as ethnic heterogeneity, ethnic inequality, and the overall degree of spatial inequality are likely to be increasing in size. We also control for the absolute value of latitude, because development is on average higher far from the equator (e.g., Hall and Jones (1999)) and because diversity is higher in areas close to the equator (e.g., Michalopoulos (2012)). The ethnic inequality index enters with a negative and significant estimate across all permutations. In even-numbered columns we condition on a rich set of geographic controls; to avoid concerns of self-selecting the conditioning set, we follow the baseline specification of Nunn and Puga (2012) and include (on top of the size controls and latitude) an index of terrain ruggedness, distance to the coast, an index of gem quality, the percentage of each country with fertile soil and the percentage of tropical land (the Data Appendix gives detailed variable definitions). The negative correlation between ethnic inequality and income per capita remains strong. The coefficient on the ethnic inequality measures is quite similar to the more parsimonious specifications with the size controls only. Thus while still an unobserved or omitted country-wide factor may jointly affect development and ethnic inequality, the estimates clearly point out that the correlation does not reflect (observable) mean differences in geographical characteristics or continental disparities.
Other We performed numerous additional sensitivity checks. For example, we dropped
from the estimation (typically small) countries with just one ethnic (or linguistic) group. The results remain stable (see Appendix Table2). We also repeated estimation excluding iteratively observations from each continent or from each income group (following World Bank’s classifica-tion); the results remain intact. We also estimate quantile (and median) regressions to explore potential heterogeneity in the correlation between ethnic inequality and development.11 The
1 0Note that a priori there is no reason in excluding small groups, since ethnic hatred may be directed to tiny
groups that control a significant portion of the economy (Chua (2003)).
1 1For example in the similar to column (3)-Table 2a specification, quantile regression estimates are in the range
coefficient on the ethnic inequality index is quite stable across quantiles.
4
Inequality in Geographic Endowments and Ethnic Inequality
4.1 On the Origins of Ethnic Inequality
Given the strong correlation between ethnic inequality and under-development it is intriguing to examine the roots of ethnic inequality.
We started our exploration of the origins of inequality across ethnic lines by examining the association between the ethnic inequality proxies and commonly-used historical variables that have been found to correlate with contemporary development. There is little evidence linking contemporary differences in ethnic inequality to the legal tradition (La Porta, Lopez-de-Silanes, Shleifer, and Vishny (1998)), the conditions that European settlers faced at the time of coloniza-tion (Acemoglu, Johnson, and Robinson (2001)), the share of Europeans in the populacoloniza-tion (Hall and Jones (1999) and Putterman and Weil (2010)), the inclusiveness of early institutions (Ace-moglu, Johnson, Robinson, and Yared (2008)), state history (Bockstette, Chanda, and Putterman (2002)), and borders’ design (Alesina, Easterly, and Matuszeski (2011)); for brevity we report these results in Appendix Table 3. These insignificant associations suggest that the strong neg-ative correlation between ethnic inequality and development does not reflect the aforementioned aspects of history.
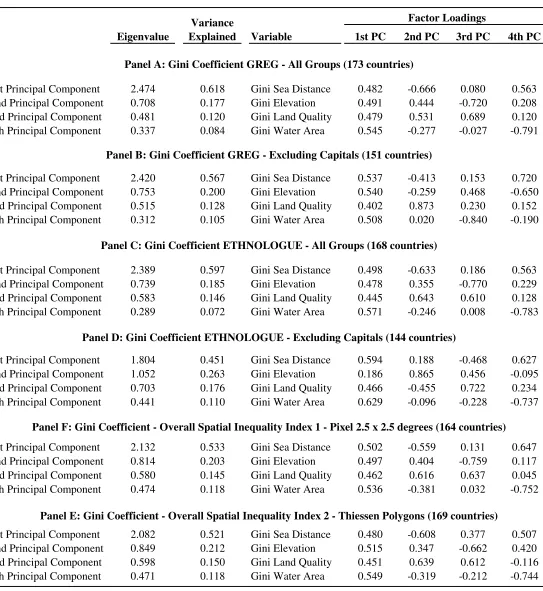
Then, motivated by the findings of Michalopoulos (2012) that ethnolinguistic diversity increases with geographic heterogeneity, we conjecture that geographic and ecological endowments play a role in explaining contemporary differences in income across ethnic lines. To the extent that land endowments affect the diffusion and adoption of technology, then ethnic-specific inequality in the distribution of geographic features would manifest itself in contemporary differences in well-being across groups. To construct proxies of geographic inequality, we first obtain geo-referenced data on elevation, land’s suitability for agriculture, distance to the coast and presence of water bodies (lakes, rivers, and other streams) and construct for each ethnic area the mean value of each of these measures. We then derive Gini coefficients at a country level that reflect group-specific inequality in each of these dimensions. Following the same procedure to the one regarding the construction of spatial inequality in luminosity (see Section2), we estimated measures of the overall degree of inequality in geographic endowments, constructing for each of the four geographic features two spatial Gini coefficients: one based on the2.5 x 2.5 decimal degrees pixels and one based on Thiessen polygons.
ethnic-specific differences in endowments translate into larger contemporary disparities in ethnic development. Depending on the specification details -GREG or Ethnologue mapping, whether we use all homelands or drop ethnic regions where capitals fall or small groups, whether we condition on the level of geography and the overall degree of spatial inequality in each of the four geographic features- different Gini coefficients of geographic inequality enter with significant estimates. Thus while we cannot precisely identify which geographic feature(s) matter most, the message from Table 6 is that differences in geography across ethnic regions translate into differences in contemporary ethnic inequality.
We thus aggregate the four indexes of ethnic inequality in geographic endowments via principal components. The use of factor analysis techniques is appealing because we have many variables (Gini coefficients) that aim at capturing the same concept (with some degree of noise), in our application inequality in geographic endowments. In line with this, there is strong positive correlation between the four Gini coefficients (see Appendix Table4). Table6reports the results of the principal component analysis. The first principal component explains more than half of the common variance of the four measures of inequality in geographic endowments. The second principal component explains around20%of the total variance, while jointly the third and fourth principal components explain a bit less than a fourth of the total variance. Interestingly, all four inequality measures load positively on the first principal component. Moreover, the eigenvalue of the first principal component is close or greater than two (one being the rule of thumb), while the eigenvalues of the other principal components are less than one. We thus focus on the first principal component, which given the significant positive loadings of all Gini coefficients, we label it "inequality in geographic endowments across ethnic homelands".12
In Figures 8a−8b we plot the ethnic inequality in luminosity against the first principal component of inequality in ethnic-specific geographic endowments. There is a strong positive association, suggesting that differences in geography explain a sizable portion of contemporary differences in development across ethnic homelands.
In Table7we formally assess the role of ethnic-specific geographic inequality, as captured by the composite index of inequality in geographic endowments across ethnic-linguistic homelands on contemporary ethnic inequality. Columns (1) and (4) show that the strong correlation illustrated in the figures is not driven by continental differences. In columns (2) and (5) we control for the overall degree of spatial inequality in geographic endowments augmenting the specifications with the first-principal component of the Gini coefficients in geography (using Thiessen polygons with the same centroid as ethnic homelands). This has little effect on the coefficient of the
1 2We also estimated and incorporated in the factor analysis inequality across ethnic homelands on distance to the
ethnic inequality in geographic endowments that retains its economic and statistical significance. In contrast the Gini coefficient based on Thiessen polygons that captures the spatial degree in geographic inequality enters with a small and statistically insignificant estimate. In columns (3) and (6) we control for the level effects of geography, augmenting the specification with mean elevation, land area under water, distance to the coast, and land suitability for agriculture. In all permutations the composite index reflecting differences in geographic endowments across ethnic homelands enters with a positive and highly significant coefficient.13 The estimate in column (3) implies that a one-standard-deviation increase in the inequality in geography across ethnic homelands index (1.56points, say from Mozambique to Malawi) translates into an15percentage points increase in the ethnic inequality index (somewhat more than half a standard deviation; see Table1A).
4.2 Geographic Inequality and Development
Given the strong positive association between ethnic inequality -as reflected in lights per capita across ethnic homelands- and inequality in geographic endowments, it is interesting to examine whether contemporary development is systematically linked to the unequal distribution of geo-graphic endowments across ethnic homelands. We thus estimated LS specifications associating the log of real GDP p.c. in2000with the composite index of ethnic-specific inequality in geography. While omitted-variables concerns cannot be eliminated, examining the role of inequality in geo-graphic endowments across ethnic homelands on comparative development is useful in assuaging concerns that the estimates in Tables2−4are driven by reverse causation. Moreover, geographic inequality can be thought of as an alternative "primitive" measure of economic differences across linguistic homelands (compared to the ethnic inequality index based on luminosity).
Results Table8reports the results. The coefficient on the proxy of ethnic inequality in
geographic endowments in (1) and (4) is negative and highly significant suggesting that countries with sizable inequalities in geographic endowments across ethnic homelands are less developed. In columns (2) and (5) we condition on the overall degree of inequality in geography with the spatial Gini index based on Thiessen polygons, while in (3) and (6) we also control for land quality, elevation, land area under water, and distance to the coast. The coefficient on the inequality in geographic endowments across ethnic homelands index is negative in all permutations. The coefficient is statistically different than zero in all but one specifications. In contrast the estimate on the principal component that reflects the overall spatial inequality in geographic endowments
1 3Appendix Table5shows that the results are similar when we exclude from the estimation ethnic regions where
is quantitatively small, changes sign and is statistically insignificant.14 The estimates in columns (1) and (3) imply that a one-standard-deviation increase in geographic inequality across ethnic homelands (1.5 points) decreases income per capita by approximately 30% (0.27 log points). These results further show that inequality across ethnic regions is a feature of under-development.
Further Evidence We also estimated two-staleast-squares estimates associating
ge-ographic inequality across ethnic homelands to ethnic inequality in lights per capita in the first-stage and the component of ethnic inequality explained by geographic disparities across ethnic regions with log per capita GDP in2000 in the second stage. While the 2SLS estimates do not necessarily identify the causal effect of ethnic inequality on development, they may be useful in accounting for measurement error in the proxy measure of development (lights per capita). The results (reported in Appendix Table 7) show the 2SLS estimate on the ethnic Gini coefficient is highly significant and quite similar in magnitude to the LS estimate.
We also estimated specifications linking development to both the ethnic inequality measure (based on lights per capita) and the composite index capturing inequality in geographic endow-ments across ethnic homelands. The results, shown in Appendix Table 8, show that once we condition on contemporary ethnic inequality differences in endowments across ethnic homelands lose their explanatory power. While some peculiar type of measurement error may explain this finding, this result indicates that inequality in geographic endowments across ethnic homelands affects contemporary development via its role on ethnic inequality.
Discussion The results in this section should not be interpreted as proving that unequal
geography across ethnic lines necessarily "causes" ethnic inequality (and under-development). It is possible that certain groups for a plethora of reasons (e.g., faster early development, superior military technology, or genetic differences) conquered higher quality territories. In this regard the correlation between inequality in geographic endowments across ethnic lines and ethnic inequal-ity in development (captured by lights per capita) indicates the sizable persistence of inequalinequal-ity. Hence, one might view an unequal ethnic geography as a manifestation of deeper ethnic differ-ences. Nevertheless, even in this case, it is the presence of an inherently unequal geography in a country that partially allows these primordial ethnic differences to become salient (otherwise there would be no "better land" for stronger groups to conquer and every group would have the same land endowment).
1 4Appendix Table 6reports otherwise identical specifications using the inequality measures that exclude from
5
Individual-Level Evidence from Sub-Saharan Africa and a Primer
on the Channels
In this section we take a micro approach that explores within-country across-district variation in ethnic inequality and various development outcomes in a sample of 16 Sub-Saharan African countries. The analysis serves two purposes. First, it is quite useful exploring the association be-tween inequality across (and within) ethnic groups and well-being using micro data and exploiting within (rather than across) country variation. Hence, instead of assigning parts of a country to a single (or more) groups with linguistic maps, we use self-reported data on ethnic identity and living conditions minimizing measurement error on the construction of ethnic inequality measures and also accounting for migration (as we observe people from the same ethnic group in many regions). Second, the plethora of questions of the Afrobarometer Surveys allows us to shed light on the channels that link ethnic inequality to well-being.
Our focus on Sub-Saharan Africa is natural, as Africa is by far the most ethnically diverse part of the world, while ethnic inequality is also quite high. Moreover, previous works suggest that a considerable portion of Africa’s growth tragedy may be attributed to its ethnic diversity and patronage politics across ethnic lines (e.g., Easterly and Levine (1997), Franck and Rainer (2012)). In the same vein, the literature on the origins of African political and economic development -mostly in political science- places a key role to ethnic disparities in income (e.g., Robinson (2001)).
5.1 Ethnic Inequality and Well Being
5.1.1 Data
We use individual-level survey data from the 3rd round of the Afrobarometer surveys, that cover 16 Sub-Saharan African in 2005.15 The surveys are based on interviews of a random sample of either1,200or2,400individuals in each country. We consider all individuals that have a clearly identified ethnic identity and answer the questions on individual well-being.16 This is the case for20,617out of 25,200respondents; individuals reside in1,298districts. Overall there are213 ethnic groups across the16countries. In each district there are on average3ethnic groups (range from 1to23ethnicities). A (nice) feature of the data -that we exploit below- is that individuals from the same ethnic group are present in more than one districts.
We construct inequality measures at the district level using individual responses on an ordered (1−5) living conditions index where a score of1indicates very bad conditions;2fairly bad;
1 5These countries are: Benin, Botswana, Ghana, Kenya, Lesotho, Madagascar, Malawi, Mozambique, Mali,
Namibia, Nigeria, Senegal, South Africa, Tanzania, Uganda, and Zambia. The 3rd round of the Surveys was also conducted in Cape Verde and Zimbabwe but in these countries the ethnic identification question was not asked.
1 6We also drop individuals from ethnic groups with less than 10respondents in each country (as in this case
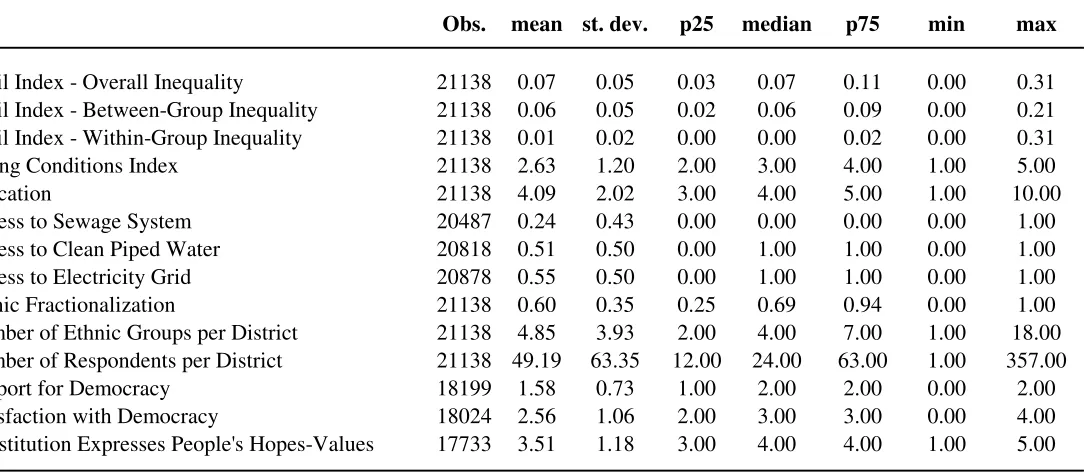
3 neither good nor bad; 4 fairly good, and 5very good. Based on these data we calculate Theil indicators reflecting the between-group and the within-group components of overall inequality (the results are similar with the Gini index; we prefer the Theil index as it can be decomposed to a between ethnic group and a within ethnic group component). Table1-PanelBreports summary statistics of the overall, the between, and the within ethnic group inequality measures as well as the other measures we consider below.
The formulae below describe the between-group and the withgroup components of in-equality in districtd. Namely, for ngroups within a district,yi,j denotes the living conditions of individualjbelonging to groupi;yi reflects the mean living conditions of groupi, andY denotes the total living conditions in a given district; ni is the number of individuals belonging to group iand N is the total number of individuals in the district.
Tbetween =i yi
Y ln(
yi Y ni N
) Twithin=i yi
Y
j yi,j
yi ln( yi,j
yi
1
ni
)
5.1.2 District-Level Estimates
Table 9 reports the results of the within-country analysis that associates ethnic inequality at the district-level with well-being, as reflected in the 1−5 living conditions index (in Panel A) and a0−9education index (in PanelB). We augment the specification with the within-ethnic-group Theil index, so as to jointly examine the role of between and within-within-ethnic-group inequality. In all specifications we control for the log number of ethnicities and the log of the number of respondents in each district (the Data Appendix gives variable definitions and sources for all variables, Table 1-Panels B and C report summary statistics while Appendix Table 9 provides the pairwise correlations). Odd-numbered columns report estimates across all districts, while in even-numbered columns we drop districts with only one ethnicity (as in these cases the between-ethnic-group inequality is zero by construction).
inhabited by more educated respondents are characterized by a lower degree of both between and within-group disparities.
5.1.3 Individual-level Estimates
In columns (4) to (6) we report specifications associating between-group and withgroup in-equality at the district level with living conditions (PanelA) and education at (PanelB) at the individual level. Moving to the individual level allows us to condition on numerous individual characteristics (Table 1C reports summary statistics). Following Nunn and Wantchekon (2011) we control for the respondent’s age and age squared, a gender indicator, a dummy variable indi-cating urban households,22religion fixed effects, and25occupational constants. We also control for the share of the district’s population that is of the same ethnicity as the respondent. The es-timates on the between and the within ethnic inequality measures in columns (3) and (4) suggest that the negative correlations with the development outcomes (living conditions and education) are not driven by (observable) individual characteristics.
Since members of the same ethnic group are present in more than one district, we also explore whether conditional on ethnic-specific (observable and unobservable) characteristics, in-equality across ethnic lines is an important correlate of individual well-being and education. Overall almost all (210out of the 213) ethnic groups in our sample may be found in more than one district. The median ethnicity can be found in 20districts. Conditioning on ethnicity fixed effects seems a priori important, because recent works show that ethnic-specific historical traits, related, for example, to the slave trades (e.g. Nunn (2008)), pre-colonial political centralization (e.g., Gennaioli and Rainer (2007) and Michalopoulos and Papaioannou (2013)), and ethnic par-titioning (e.g., Michalopoulos and Papaioannou (2011)) have long-lasting effects on development. The inclusion of country-ethnicity fixed effects also ensures that the negative association be-tween ethnic inequality and development is not driven by certain ethnic groups -that may either dominate politics in one country or suffer from discrimination.
Sensitivity Analysis We perturbed the empirical model in various ways to explore the robustness of these results. First, rather than conditioning on the log number of ethnicities we constructed a standard fractionalization measure. This has no effect on our main results. Second, we repeated estimation using the mean log deviation index or the Gini coefficient. The results are virtually unchanged. Third, we repeated the analysis restricting estimation to urban districts. This is useful as inequality is higher in urban places and, unlike the cross-country setting, we can properly account for increased population mixing usually associated with urbanization. Across all permutations, the coefficient on the between-ethnic-group Theil index is negative and significant at the 99% confidence level. Fourth, since the living conditions and the education measures take discrete values we estimated ordered probit models with maximum likelihood again finding similar results. To avoid cluttering the exposition the results are available upon request.
Summary To the best of our knowledge the results in Table 9 are the first piece of
evidence showing in a systematic manner with micro level data that inequality, both across ethnic lines and within ethnicities, is inversely related to economic well-being in Sub-Saharan Africa.
5.2 Channels
We now exploit the richness of the questionnaires of the Afrobarometer Surveys to explore several channels linking ethnic inequality and well-being.
5.2.1 Economic Conditions and Political Power
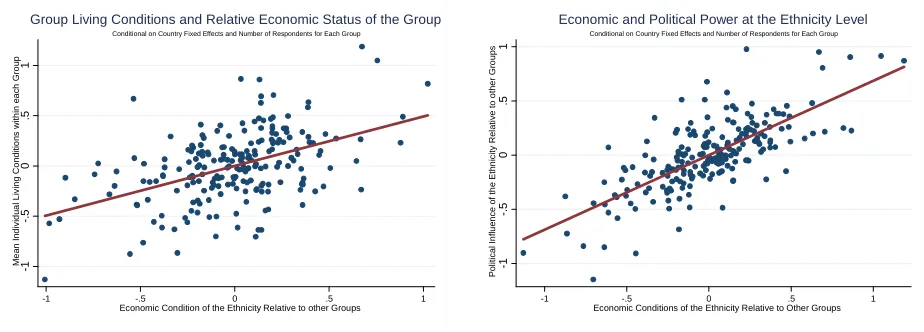
Given the large amount of evidence on ethnic-based patronage politics and discrimination in Africa, we begin our analysis on the mechanisms linking ethnic inequality to under-development examining the link of a group’s well-being and its political power. Economic differences across groups may translate into differences in the influence that ethnicities exert on the political land-scape (and vice versa). We test this conjecture tabulating respondents’ answers to a question aiming to measure the political influence of their group to that of other groups in the same coun-try; the question gauging the political influence of the group reads: "Think about the conditions of [respondent’s identity group]. Do they have less, the same, or more influence in politics than other groups in this country?" Higher values in this index -that ranges from1to5- indicate more influence (see the Data Appendix for details).
mean living conditions (0.36) is quite similar to the (similarly positive) "beta" coefficient of the log number of respondents of the group (0.43), implying that the role of economic well-being on political power is similar to that of group size; the latter is consistent with the recent findings of Francois, Rainer, and Trebbi (2013) who document that a group’s size determines its representation in the government across most Sub-Saharan African countries.
A similar picture emerges when we look at how a group’s living conditions relate to whether the group’s respondents feel discriminated by the government; we derive a proxy of group discrim-ination using the average value to the following question: "How often are [respondent’s identity group] treated unfairly by the government?" The index ranges from 0 to 3 with higher values indicating a higher frequency of unfair treatment. Figure 9bshows a strong association between group-specific living conditions and group’s unfair treatment by the central government.
We also experimented with alternative measures of a group’s economic conditions. Specif-ically, instead of measuring group’s economic status by taking the average of living conditions across individuals, we use information from another question that reflects perceptions of group members regarding the economic power of their own group relative to other groups in the country. The question reads: "Think about the condition of [respondent’s identity group]. Are their eco-nomic conditions worse, the same as, or better than other groups in this country?" Higher values (range 1to5) indicate higher economic prosperity. There is a strong link between group-specific economic conditions (versus other groups) and political influence or (lack thereof) discrimination by the government. Please see Figures10a,10b,10c, respectively.
5.2.2 Public Goods Provision
The Argument A large literature provides compelling evidence that public goods
pro-vision, redistributive policies, and effective governance are less prevalent in ethnically/racially di-verse communities (e.g., Alesina, Glaeser, and Sacerdotte (2001)) and countries (Desmet, Ortuño-Ortín, and Wacziarg (2012)). The more dispersed preferences are across groups then the desired public goods will be more distant to the chosen one (see Luttmer (2001) for evidence). Hence, if the level of income shapes preferences for public goods then group differences in economic condi-tions will make group preferences diverge leading to lower public goods provision and increased political tensions.17 In the same vein, one of the main empirical patterns of urban economics is that the rich quite often want to "isolate"; since this desire may be especially strong when wealth
1 7Baldwin and Huber (2010) provide empirical evidence in line with this idea for 46 democracies. Similarly,
is correlated with group identity, ethnic inequality may lead to segregation.18 The link between political inequality and economic inequality (shown above) may limit the supply of public goods to geographically isolated minorities, with an insufficient supply to poorer and less powerful groups. In contrast to the least well-off, the "rich" may get the desired services (of public goods) by directly purchasing the respective private goods; obtaining, for example, a private electricity generator instead of contributing to the extension of the public grid. This phenomenon would exacerbate the under-provision of public goods.
Results Table10apresents results relating inequality to access to various type of public
goods, namely piped water, sewage systems and electrification at the enumeration area. The unit of analysis in columns (1), (4) and (7) is the district, while in the other columns the unit of analysis is the individual. To further account for individual features, following Nunn and Wantchekon (2011) in these specifications we also include as additional controls five dummies for household’s living conditions and nine indicators for education. To economize on space we focus on districts with more than one ethnic group (the pattern is the same for the full sample as already shown in Table9). In all specifications the between-group inequality measure enters with a significantly negative sign. On the contrary, the explanatory power of within-group inequality index is small and the coefficient is often statistically indistinguishable from zero. For example, in column (5) the beta coefficients for the between and within-group inequality are0.049and0.006, respectively. The results in Table10athus show that in districts marked by sizable inequalities across ethnic lines, there is under-provision of public goods. Since we do not have random assignment on ethnic inequality, these estimates do not necessarily identify causal effects; yet it is important to note that we control for numerous individual level characteristics, including education, living conditions, occupation, and in many specifications even for ethnicity fixed factors.
In Table10bwe report otherwise identical to Table10aspecifications but we now include as an additional regressor the mean value of the living conditions index in each district. (Note that in the individual-level regressions we continue controlling for individual level living conditions and education). Access to public goods is negatively related to between-group inequality; in contrast the correlation between public goods provision and within-group inequality is weak. This suggests that the effect of access to public goods goes above and beyond the effect of ethnic inequality on average well being, since we are controlling for it in these regressions.
Examples A few examples are useful to illustrate the pattern. We focus on the most
restrictive specifications that include ethnicity fixed-effects. The Pular in Senegal are found in28
1 8Alesina and Zhuravskaya (2011) show that ethnic and linguistic segregation correlate negatively with proxies
of the31country’s districts. In the district of Matam, where the Pular coexist with the Soninke, the Wolof and the Mandinka, between-group inequality is minimal (0.0005) whereas in the district of Sedhiou, where the Pular coexist with the Wolof, the Mandinka, the Manjack, the English, the Diola, and the Bambara, between-group inequality is 0.0145. In the Sedhiou district all Pular report having no access to electricity, piped water and sewage system, whereas in Matam 72% of the Pular have access to an electricity grid and access to clean water. Another example is the Herero that are found in 32 of the 87 districts in Namibia. In the district of Otjiwarongo, where we observe respondents from 5 groups, between-group inequality is minimal, 0.0038. In this region all Herero reply having access to electricity, sewage system, and clean water. On the contrary, in the district of Otjinene where between-group inequality is more than10times larger, 0.0408, only 43% of Herero reply having access to either an electricity grid or a sewage system (in both regions within-group inequality is quite similar).
5.2.3 Fairness, Markets and Democracy
The argument In an influential work, Chua (2003) notes cases in which the spread of
democracy and free market institutions in the 1990s has led to animosity and institutional capture by amplifying pre-existing ethnic tensions. Her thesis is that in the presence of ethnic inequality (and especially when a small fraction of the population controls most wealth in the economy), then democratization may result in a backlash, as most individuals perceive representative and capitalist institutions as unfair, captured, and corrupt. 19
When the less-privileged, but more populous groups, come to power they may want to turn the cards around, pursuing ethnic politics aiming to compensate their group for the perceived injustice. The resulting belief that markets are unfair may also lead to under-supply of effort (as in model by Alesina and Angeletos (2005) and Benabou and Tirole (2006)). The strong correlation documented above between well being and political influence goes in the same direction. It undermines the perception of "equity" in the society.
Results Tables 11a and 11b report the results of our analysis examining the link
be-tween ethnic inequality (and within-ethnic-group) inequality and perceptions on the functioning of democratic institutions. In columns (1)-(3) the dependent variable captures whether the re-spondent feels that in some instances a non-democratic government is preferable to a democratic one. In columns (4)-(6) the dependent variable is a0−4range index reflecting the degree of sat-isfaction with the way democracy works in the respondent’s country, whereas in columns (7)-(9)
1 9Chua (2003) presents case-study evidence supporting her thesis. She discusses, among others, the influence
the dependent variable is an ordered variable (range from 1 to5) where reflecting respondents’ belief on whether the constitution expresses the values and hopes of people. (So in all spec-ifications higher values in the dependent variable reflect greater support/satisfaction with the democracy/constitution). To get an idea of the overall variation in the outcome of interest23% of the respondents either (strongly) believe that the constitution does not reflect the values of the people of the country with a similar19% answering the opposite.
The evidence in Table 11a reveals that support and especially satisfaction with democ-racy is overall negatively related to across-group inequality and to some extent to within-group inequality. It is worthwhile to note that amongst the individual controls we always include the living conditions and education level of the respondent, hence the negative association between ethnic inequality and support for democracy operates beyond the influence of the former on the well-being of the respondent. In Table 11b we also control for the overall level of well being of the district as a whole. Doing so weakens considerably the role of cross-group inequality and eliminates any influence of the within-group component. This finding suggests that the link between ethnic inequality and disaffection with democratic institutions works primarily (though not entirely) through the relationship of ethnic inequality and district-level wellbeing documented above.
5.2.4 Other Channels
We also examined the link between ethnic inequality and proxies of social-civic capital investi-gating whether ethnic inequality is related to trust. The results are inconclusive. It seems that in Africa at least ethnic inequality and trust are not systematically linked.
Finally, we correlated inequality across and within ethnic groups with proxies of conflict at the regional level, using geo-referenced data on conflict from the ACLED database. While many have linked (ethnic and overall) inequality with conflict (see Horowitz (1985) for an overview), as shown theoretically by Esteban and Ray (2011) and Esteban, Mayoral, and Ray (2012) the relationship is not straightforward; for instance, a very rich and powerful group may be so strong that any insurrection from (much) weaker groups is unthinkable. Likewise, a change in ethnic in-equality starting from a relatively equal equilibrium may generate violence. Given the theoretical ambiguities, perhaps it comes at no surprise that we could not detect a systematic relationship between ethnic (or within group) inequality and conflict.20
6
Conclusion
This study shows that ethnic differences in economic performance rather than the degree of diversity or the overall level of inequality are negatively correlated with economic development. While a large literature has examined (a) the interplay between inequality and development and (b) the effects of various aspects of the ethnic composition (such as fragmentation, polarization, segregation) on economic performance, there is little -if any- work studying the linkages between ethnicity, inequality, and comparative development. This paper is a first effort to fill this gap.
In the first part of the paper we examine the role of ethnic inequality on development using cross-country data. First, combining linguistic maps on the spatial distribution of ethnic groups within countries with satellite images of light density at night we construct Gini coefficients reflecting inequality in well-being across ethnic lines for a large number of countries. Ethnic inequality is weakly correlated with the standard measures of income inequality and only modestly correlated with ethnolinguistic fractionalization, polarization, and segregation. Second, we show that the newly constructed proxy of ethnic inequality is strongly negatively correlated with per capita GDP across countries. The correlation retains its significance when we condition on the overall degree of spatial inequality in development, which is also negatively associated with economic development (a new finding by itself). Including in the empirical specification both the ethnic inequality index and the widely-used ethnolinguistic fragmentation indicators, the latter loses significance, suggesting that it is inequality across ethnic lines that is correlated with poor economic performance rather than fractionalization. Third, we conduct an initial step exploring the roots of contemporary differences in well-being across ethnic groups within countries. In this regard, we construct indicators of ethnic inequality in geographic endowments and show that contemporary differences in development across ethnic homelands have a significant geographic component. The latter is also inversely related to contemporary development.
In the second part of the paper we take a micro approach exploiting within-country differ-ences in ethnic inequality for 16 Sub-Saharan countries covered by the Afrobarometer Surveys. First, using individual-level data on ethnic self-identification and well-being we find a negative association between ethnic inequality and regional development. The negative correlation be-tween ethnic inequality and well-being retains significance even when we control for numerous individual characteristics and account for unobserved ethnic-specific traits. Second, we explore the mechanisms linking ethnic inequality to regional development. We show that economic in-equality goes in tandem with political inin-equality. Our analysis further establishes that ethnic inequality is closely linked to the under-provision of basic public goods and to some extent to the lack of confidence in democratic institutions.