PREDICTIVE CHEMINFORMATICS ANALYSIS OF DIVERSE CHEMOGENOMICS DATA SOURCES: APPLICATIONS TO DRUG DISCOVERY, ASSAY INTERFERENCE,
AND TEXT MINING
Stephen Joseph Capuzzi
A dissertation submitted to the faculty at the University of North Carolina at Chapel Hill in partial fulfillment of the requirements for the degree of Doctor of Philosophy in the Division of Chemical Biology and Medicinal Chemistry in the Pharmaceutical Sciences Department in
the Eshelman School of Pharmacy
Chapel Hill 2018
Approved by: Alexander Tropsha Stephen V. Frye Albert A. Bowers Nikolay Dokholyan
ii © 2018
iii ABSTRACT
Stephen Joseph Capuzzi: Predictive Cheminformatics Analysis of Diverse Chemogenomics Data Sources: Applications to drug discovery, assay interference, and text mining.
(Under the direction of Alexander Tropsha)
iv
v
ACKNOWLEDGEMENTS
I would like to thank my advisor, Dr. Alexander Tropsha. As Markovnikov wrote to Butlerov: “Считаю приличным посвятить небольшой труд свой Вам, многоуважаемый наставник, поскольку проводимые в нём мысли есть дальнейшее развитие установленного Вами….Если в нём и заключается что-нибудь новое, то рождение этого невозможно было бы без исходных положений, заложенных Вами.”
I would also like to thank the various members of the Molecular Modeling Laboratory, especially Dr. Eugene Muratov.
To my committee members, thank you all for your guidance, support and insights. I would also like to thank my friends and family – too many to name.
vi
TABLE OF CONTENTS
ABSTRACT ... iii
LIST OF ABBREVIATIONS ... xi
CHAPTER 1: COMPUTER-AIDED DISCOVERY AND CHARACTERIZATION OF NOVEL EBOLA VIRUS INHIBITORS ... 13
1.2 INTRODUCTION ... 13
1.3 RESULTS ... 15
1.3.1 Model Performance ... 15
1.3.2 QSAR-Based Virtual Screening ... 17
1.3.3 Experimental Evaluation ... 18
1.3.3.a Experimental confirmation of Anti-EBOV activity of 14 compounds ... 18
1.3.3.b Mechanisms of action against EBOV entry ... 21
1.3.4 Cheminformatics Analysis ... 25
1.3.4.a Assay Liabilities ... 25
1.3.4.b Chemical Similarity to Training Set Compounds ... 26
1.3.4.c Comparison to Previously Reported EBOV Inhibitors ... 27
1.4 DISCUSSION ... 34
1.5 CONCLUSIONS ... 36
1.6 EXPERIMENTAL SECTION... 37
vii
1.6.1.a Antiviral Data ... 37
1.6.1.b Cytotoxicity Data ... 38
1.6.1.c Determination of Antiviral Activity ... 39
1.6.1.d Determination of Cytotoxicity ... 40
1.6.1.e Antiviral Training Set Balancing ... 40
1.6.1.f Cytotoxicity Training Set Balancing ... 40
1.6.1.g Modelability Index (MODI) ... 41
1.6.2 Computational Methods ... 41
1.6.2.a QSAR Model Generation and Validation ... 41
1.6.2.b Virtual Screening ... 42
1.6.3 Experimental Methods ... 43
1.6.3.a Materials ... 43
1.6.3.b Cell culture methods ... 51
1.6.3.c Ebola VLP beta-lactamase assay for HTS in 1536-well plates ... 51
1.6.3.d Cell viability assay with the ATP content assay kit ... 52
1.6.3.e Ebola live virus assays ... 52
1.6.3.f Filipin staining and LysoTracker-red staining ... 52
1.6.3.g Cathepsin B/L assay ... 53
1.6.3.h Thermal shift binding assay with Ebola VLP... 53
viii
1.7 ASSOCIATED CONTENT... 54
CHAPTER 2: COMPUTATIONAL DISCOVERY AND EXPERIMENTAL VALIDATION OF POTENT INHIBITORS OF THE UNDERSTUDIED KINASE DCLK1 ... 55
2.2 INTRODUCTION ... 55
2.3 RESULTS ... 57
2.3.1 QSAR Model Development ... 57
2.3.2 QSAR-Based Virtual screening ... 59
2.3.3 Experimental Validation ... 60
2.3.4 SAR Analysis and Implications for Future Design ... 62
2.3.4.a Matched Molecular Pair Analysis and Model Interpretation ... 62
2.3.4.b Molecular Docking ... 63
2.4 DISCUSSION ... 64
2.5 CONCLUSIONS ... 69
2.6 METHODS ... 70
2.6.1 Data Production, Collection, Curation, and Classification ... 70
2.6.2 Computational Methods ... 71
2.6.2.a Molecular descriptors ... 71
2.6.2.b RBF-SCR algorithm ... 72
2.6.2.c Modelability Index (MODI) ... 72
2.6.2.d QSAR modeling ... 72
ix
2.6.2.f Matched Molecular Pair Analysis ... 73
2.6.2.g Molecular Docking ... 74
2.6.3 Experimental Methods ... 74
2.6.3a DCLK1 Plasmid Construction ... 74
2.6.3b DCLK1 Protein Purification ... 75
2.6.3c DCLK1 Mobility Shift Assay ... 75
2.6.4 Kinase Selectivity ... 76
2.7 ASSOCIATED CONTENT... 77
CHAPTER 3: PHANTOM PAINS: A PUBCHEM-WIDE ANALYSIS OF PAN-ASSAY INTERFERENCE COMPOUNDS ... 78
3.2 INTRODUCTION ... 78
3.3 RESULTS AND DISCUSSION ... 83
3.3.1 Detection of PAINS in chemical libraries tested with the AlphaScreenTM Technology .. 83
3.3.2 Analysis of PAINS alerts in chemical libraries tested with the AlphaScreenTM Technology ... 88
3.3.3 Random PAINS in PubChem ... 94
3.3.4 Analysis of PAINS Alerts in Dark Chemical Matter ... 95
3.3.5 Global Analysis of PAINS Alerts ... 99
3.3.6 PAINS Alerts in Drugs ... 101
3.3.7 Beyond PAINS Substructures ... 102
x
3.5 ASSOCIATED CONTENT... 105
CHAPTER 4: CHEMOTEXT: A PUBLICLY-AVAILABLE WEB SERVER FOR MINING DRUG-TARGET-DISEASE RELATIONSHIPS IN PUBMED ... 106
4.2 INTRODUCTION ... 106
4.3 METHODS ... 108
4.4 CHEMOTEXT ENVIRONMENT ... 109
4.4.1 Find Connected Terms ... 109
4.4.2 Find Shared Terms ... 112
4.4.3 Path Search ... 114
4.4.4 Find Articles ... 117
4.5.1 CASE STUDIES ... 117
4.5.1.a Construction of a Clinical Outcome Pathway (COP) for a Drug-Disease Pair ... 117
4.5.2.b Drug Repurposing for Human Cytomegalovirus ... 120
4.6 CONCLUSIONS ... 121
4.7 ASSOCIATED CONTENT... 124
xi
LIST OF ABBREVIATIONS
AD APPLICABILITY DOMAIN
AJAX ASYNCHRONOUS JAVASCRIPT AND XML
Bla BETA-LACTAMASE
BSL BIOSAFETY LEVEL
CADD COMPUTER-AIDED DRUG DESIGN
CCR CORRECT CLASSIFICATION RATE
COP CLINICAL OUTCOME PATHWAYS
DCLK1 DOUBLECORTIN-LIKE KINASE 1
DCM DARK CHEMICAL MATTER
DTD DRUG-TARGET-DISEASE
EBOV EBOLA VIRUS
EV ENRICHMENT VALUE
FDA FOOD AND DRUG ADMINISTRATION
FH-NoPAINS FREQUENT HITTERS – NO PAINS
FH-PAINS FREQUENT HITTERS - PAINS
FN FALSE NEGATIVES
FP FALSE POSITIVES
HCMV HUMAN CYTOMEGALOVIRUS
HTS HIGH-THROUGHPUT SCREENING
IH-NoPAINS INFREQUENT HITTERS- NO PAINS
IH-PAINS INFREQUENT HITTERS - PAINS
MeSH terms MEDLINE SUBJECT HEADING
MLT MACHINE LEARNING TECHNIQUE
MML MOLECULAR MODELING LABORATORY
xii
MOA MECHANISM OF ACTION
MODI MODELABILITY INDEX
NIH NATIONAL INSTITUTES OF HEALTH
NIH NATIONAL INSTITUTES OF HEALTH
NLM NATIONAL LIBRARY OF MEDICINE
NPC1 NIEMANN PICK C1
NPV NEGATIVE PREDICTIVE VALUE
PAINS PAN-ASSAY INTERFERENCE COMPOUNDS
PMID PUBMED IDENTIFICATION
PPV POSITIVE PREDICTIVE VALUE
RF RANDOM FOREST QSAR
RTK RECEPTOR TYROSINE KINASE
SE SENSITIVITY
SI SELECTIVITY INDEX
SI(65) SELECTIVITY INDEX AT 65%
SI(90) SELECTIVITY INDEX AT 90%
SLN SYBYL LINE NOTATION
SP SPECIFICITY
Tc TANIMOTO COEFFICIENT
TN TRUE NEGATIVES
TP TRUE POSITIVES
TSC TUMOR STEM CELL
VLP VIRUS-LIKE PARTICLE
13
CHAPTER 1: COMPUTER-AIDED DISCOVERY AND CHARACTERIZATION OF NOVEL EBOLA VIRUS INHIBITORS1
1.2 INTRODUCTION
The 2014 Ebola outbreak was the largest and most persistent since the discovery of the Ebola virus (EBOV) in 1976. Alarmingly, a new EBOV outbreak was confirmed in the Democratic Republic of Congo in May 2017.1 Though advances in the research and development of Ebola therapeutics have been made,2–4 Ebola drug discovery endeavors are hindered due to the high virulence of the EBOV and its biosafety level 4 (BSL-4) classification.5 Recently, a biosafety level 2 (BSL-2) Ebola virus-like particle (VLP) entry assay was developed and utilized for a drug
repurposing screen of Food and Drug Administration (FDA)-approved drugs.6–8 The Ebola VLP
contains glycoprotein (GP) and the matrix protein VP40 fused to a beta-lactamase reporter for monitoring of VLP entry into cells. Although this BSL-2 Ebola VLP assay enables rapid compound screening, it requires a centrifugation step for assay plates at 1,500 g for 45 minutes at 4 °C that limits its screening throughput. Computational approaches that leverage generated data can be used to design or select small sets of compounds for lead identification in order to reduce the time and costs of high throughput screening. Using the existing data from the Ebola VLP entry assay as well as cytotoxicity data, QSAR models9 can be built and then employed for virtual screening of large chemical libraries to predict activeompounds against EBOV infection with low
1 This chapter previously appeared as an article in the Journal of Medicinal Chemistry. The original citation is as follows: Capuzzi, SJ, et. al. “Computer-aided discovery and characterization of novel Ebola virus inhibitors”. Journal
14
expected toxicity. Indeed, QSAR modeling approaches have been previously employed for identification of compounds with efficacy against EBOV.10,11 Herein, we describe a study that relied on synergistic combination of statistical data modeling and experimental testing for both antiviral inhibitor potency and host cell cytotoxicity (Figure 1.1). Our study utilized both BSL-2 and BSL-4 assays to experimentally validate hits identified computationally.
Figure 1.1. Overall study design. The present study synergistically incorporates computational modeling and experimentation.
15
activity for confirmed hits were identified. Ultimately, 14 potent hits with activity ranging between 0.272 μM and 9.65 μM as well as more than 10-fold selectivity over compound cytotoxicity in host cells were confirmed. Next, five selected hits were shown to inhibit BSL-4 live-EBOV infection in a dose-dependent manner. Two of these hits possessed novel scaffolds, making them candidates for further medicinal chemistry optimization as potential anti-EBOV agents. This study presents the first example of computationally-driven prioritization and experimental discovery of novel potent anti-Ebola compounds with high therapeutic windows in the published literature.
1.3 RESULTS
1.3.1 Model Performance
Prior to the modeling, MODIs of 0.69 and 0.68 were calculated for the P1 and P2 datasets, respectively. For each protocol, three separate software packages (Chembench, HiT QSAR, and GUSAR) employing different descriptors and different machine learning techniques (MLTs) were utilized for model building. In total, six individual models were built and rigorously validated. Results of 5-fold external cross-validation are presented in Table 1.1. In order to demonstrate that the predictive power of the models was not due to random correlation between bioactivity and chemical descriptors, 1000 rounds of Y-randomization was performed. No Y-randomized models had a CCR above 0.60.
16
For HeLa and HEK cell lines, MODI of 0.65 and 0.70 were obtained, respectively. For HeLa cytotoxicity, GUSAR yielded the best overall model. Chembench and GUSAR had inverse sensitivity and specificity profiles, indicating that Chembench could better identify toxic compounds, while GUSAR could better identity non-toxic compound. This observation highlights
Model Name Descriptors MLT CCR SE SP PPV NPV
Chembench – P1 Dragon 6.0 RF 0.67 0.69 0.68 0.66 0.68
HiT QSAR – P1 SiRMS RF 0.72 0.73 0.71 0.72 0.73
GUSAR – P1 MNA and QNA SCR-RBF 0.72 0.73 0.71 0.72 0.73
Chembench – P2 Dragon 6.0 RF 0.72 0.72 0.72 0.72 0.72
HiT QSAR – P2 SiRMS RF 0.75 0.75 0.75 0.75 0.75
GUSAR – P2 MNA and QNA SCR-RBF 0.72 0.69 0.75 0.73 0.71
Chembench – HeLa Dragon 6.0 RF 0.73 0.77 0.68 0.73 0.72
HiT QSAR – HeLa SiRMS RF 0.64 0.68 0.60 0.66 0.62
GUSAR – HeLa MNA and QNA SCR-RBF 0.75 0.67 0.84 0.82 0.69
Chembench – HEK Dragon 6.0 RF 0.62 0.67 0.57 0.64 0.60
HiT QSAR – HEK SiRMS RF 0.53 0.55 0.50 0.56 0.49
GUSAR – HEK MNA and QNA SCR-RBF 0.72 0.78 0.71 0.73 0.76
17
the reciprocal benefit of consensus modeling, i.e., utilizing all the models for VS. No Y-randomized models had a CCR in access of 0.60. All models were deemed robust and statistically valid. For HEK cytotoxicity, GUSAR again proved to be the best overall model. On the other hand, Chembench and HiT QSAR were not statistically validated, as several metrics fell below the 0.60 threshold. Thus, only GUSAR was used for prediction of HEK cytotoxicity. Y-randomized models for GUSAR did not exceeded a CCR of 0.60. A summary of all model performance can be found in Table 1.1.
1.3.2 QSAR-Based Virtual Screening
QSAR-based virtual screening (VS) was carried out according to the workflow presented in Figure 1.2. Initially, ~17 million compounds (see Methods) were downloaded, prepared, and screened. As previously stated, “hits” were those compounds that were within the AD of the respective model and predicted by all models to have high antiviral activity and limited host cytotoxicity. In total, 102 VS hits were selected for experimental validation in the Ebola-VLP entry assay.
18 1.3.3 Experimental Evaluation
1.3.3.a Experimental confirmation of Anti-EBOV activity of 14 compounds
Based on the virtual screening results, 102 compounds were purchased and experimentally screened in the Ebola-VLP entry assay in parallel with an ATP content assay to determine compound cytotoxicity in host cells. All compounds were screened at 11 concentration dilutions ranging from 0.001 to 57 µM.12 Out of 102 compounds tested, 51 showed greater than 50% inhibition, indicating that half of compounds had confirmed anti-EBOV activity. Next, 20 of these 51 compounds exhibited the IC50 values under 10 μM. Because the compound cytotoxicity at higher compound concentrations might reduce the Ebola VLP entry in cells, these potential false positive compounds should be deprioritized. After comparing to the compound cytotoxicity data, 14 of these confirmed compounds showed a greater than 10-fold selectivity index (SI) of anti-Ebola VLP entry over compound cytotoxicity. Vindesine and BIX-01294 inhibited the virus in the nanomolar range (Figure 1.3).
19
Moreover, these 14 confirmed compounds, except for ZINC91973695 and ZINC67869167, have known mechanisms of action (MOAs) and therapeutic indications (Table 1.2), including eight anti-cancer, two antihistamines, and two anti-psychotic and anti-inflammatory agents (Table 1.2).
Table 1.2. Experimental results for the top 14 hits. Most experimentally confirmed hits have known MOAs and therapeutic use indications.
Name Potency, μM
Selectivity Index
Indication MOA
Vindesine 0.272 1837 Anticancer Microtubule Inhibitor
BIX-01294 0.966 45 Anticancer HMTase Inhibitor
Afimoxifene 1.96 123 Anticancer
Estrogen Receptor Modulator
Tetrandrine 2.16 22
Anti-inflammation
Calcium Channel Blocker
NVP-ADW742 3.05 13 Anticancer Tyrosine Kinase Inhibitor
Endoxifen 3.05 164 Anticancer
Estrogen Receptor Modulator
ZINC91973695 6.09 82 N/A N/A
Deptropine 6.58 76 Antihistamine Anticholinergic
20
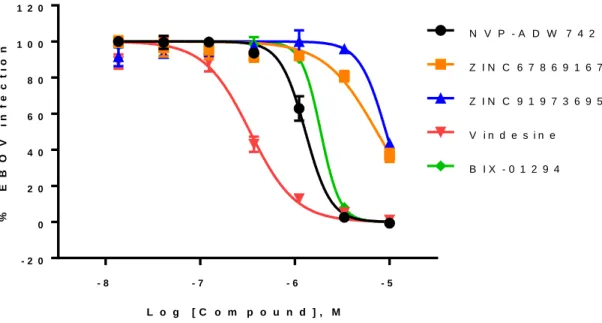
The remaining two compounds obtained from the ZINC database (ZINC91973695 and ZINC67869167) have no previously reported bioactivities, anti-Ebola or otherwise. Five hits were further validated in a live EBOV infection assay at bio-safety level-4 (BSL-4). All five hits showed dose-response inhibition against EBOV infection (Figure 1.4). Vindesine was the most potent compounds with an IC50 of 0.34 µM. The IC50 values of NVP-ADW742, BIX-01294, ZINC67869167, and ZINC91973695 were between 1 µM to 10 µM in the live EBOV infection assays.
ZINC67869167 6.83 73 N/A N/A
Hh-Ag1.5 7.67 65 Anticancer Hedgehog Agonist
Cediranib 7.67 65 Anticancer Tyrosine Kinase Inhibitor
Ebastine 9.56 51 Antihistamine Histamine H1 Antagonist
Osanetant 9.65 52 Antipsychotic
21
Figure 1.4. Dose-response behavior against BSL-4 live-EBOV infection. Five hits were selected for screening in live-EBOV infection in a BSL-4 assay. Vindesine (red) was the most potent compounds with an IC50 of 0.34 µM. The IC50 values of NVP-ADW742 (black), BIX-01294 (green), ZINC67869167 (orange), and ZINC91973695 (blue) were between 1 µM to 10 µM.
1.3.3.b Mechanisms of action against EBOV entry
We probed the chemical biology of these hit compounds in both viral and host systems in order to uncover the mechanisms of anti-EBOV action. We examined the potential sites for drug interaction including Niemann Pick C1 (NPC1) protein, lysosomal function, cathepsin B, and cathepsin L,13–15 as well as the direct binding of these compounds to the Ebola VLP proteins using thermal shift binding assays.16 The results of chemical biology studies revealed that these compounds may act via one or more these targets/mechanisms.
The process of EBOV entry into cells involves binding of viral envelop protein(s) to the cell membrane receptor protein/molecule, endocytosis, movement of endocytic vesicles to early/late endosomes and lysosomes, and ejection of viral RNA into the cytosol.17 Therefore,
- 8 - 7 - 6 - 5
- 2 0 0 2 0 4 0 6 0 8 0 1 0 0 1 2 0
L o g [ C o m p o u n d ] , M
% E B O V i n f e c t i o n
N V P - A D W 7 4 2
Z I N C 6 7 8 6 9 1 6 7
Z I N C 9 1 9 7 3 6 9 5
V i n d e s i n e
22
inhibition of viral protein binding to cell membrane proteins/binding partners can effectively reduce viral entry and subsequent viral replication in cells. Because the cell surface binding protein/molecule for Ebola viral proteins is still unclear, we determined direct binding of these compounds to recombinant Ebola protein. To examine whether these compounds directly interact with the EBOV, their ability of stabilizing Ebola protein was tested in a thermal shift assay using recombinant Ebola VLP. None of the compounds at 50 μM were able to protect Ebola VLP from thermal denaturation. (Figure 1.5).
23
Cathepsin B and L are lysosomal endopeptidases that had been reported to prime EBOV proteins in lysosomes before the viral RNAs are injected into the cytosol for virus replication. Inhibition of cathepsin B or L significantly reduces EBOV infection.13 GANT61 (an inhibitor of GLI1 and GLI2-induced transcription), deptropine (an antihistamine), and ebastine (an antihistamine) inhibited the enzymatic activity of cathepsin L (Figure 1.6a and 1.6b). Only GANT61 inhibited enzymatic activity of cathepsin B (Figure 1.6c and 1.6d).
24
L assay. d. Dose-response studies of GANT61 in cathepsin B assay. All experiments were performed in triplicate and data are representative of at least two independent experiments. Data are represented as mean ± SEM.
The NPC1 protein has been reported as an intracellular receptor for EBOV.14,15,18 Significant reduction of EBOV entry and infection were observed in the NPC1-deficient cells and mouse models.14,19 Ebastine increased cholesterol accumulation in cells determined by the filipin staining assay, which indicated a functional impairment of NPC1 protein; whereas, the other eight evaluated hits did not impair NPC1 protein function (Figure 1.7a).
25
Figure 1.7. Cholesterol accumulation (NPC1 inhibition) and enlargement of lysosome induced by Ebola entry inhibitors. a. U18666A and ebastine increased filipin staining in fibroblasts (green: filipin; blue: nuclei). b. U1866A, GANT61, ZINC67869167, ZINC91973695, tetrandrine, deptropine, osanetant, BIX-01294, cediranib, and ebastine increased LysoTracker staining in fibroblasts (orange: LysoTracker red; blue: nuclei). All experiments were performed in triplicate and data are representative of at least two independent experiments. Data are represented as mean ± SEM.
1.3.4 Cheminformatics Analysis
1.3.4.a Assay Liabilities
26
*
Promiscuity.25 No heightened beta-lactamase assay activity trends were observed, indicating that these hits are not assay artifacts (Supplementary File 14).
1.3.4.b Chemical Similarity to Training Set Compounds
Hierarchical clustering analysis revealed that majority of the hits are structurally dissimilar from each other, aside from afimoxifene and endoxifen (Figure 1.8).
Figure 1.8. Hierarchical clustering of experimental hits. High Tanimoto similarity of afimoxifene and endoxifen is highlighted by an asterisk.
27
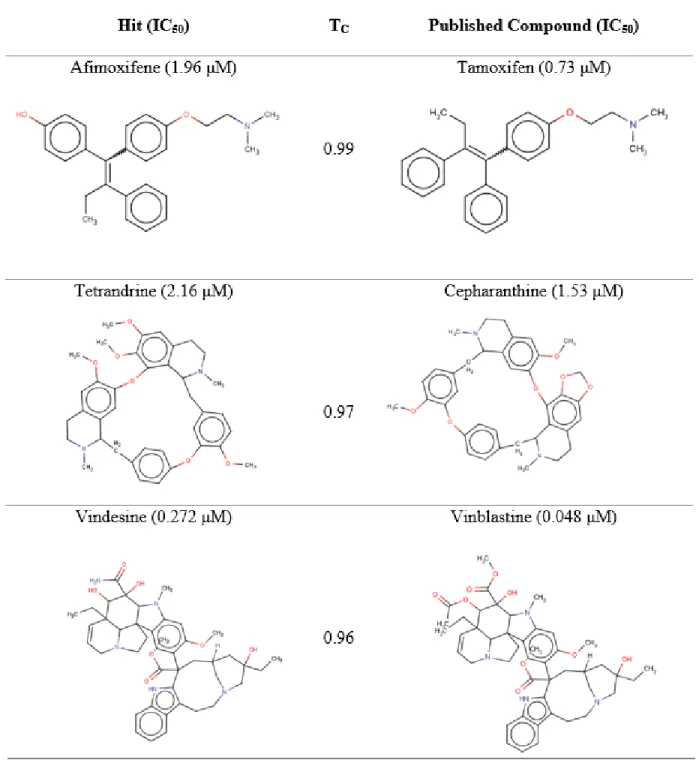
Clustering thus indicates the hits discovered in this study access a wide range of chemical space across several unique chemotypes. The structural similarity based on the Tanimoto coefficient (Tc) of the 14 hits were then compared with compounds in the antiviral training sets (Table 1.3) in order to assess the uniqueness of hits. In addition to being highly structurally similar to each other, afimoxifene and endoxifen both have Tc above 0.90 to tamoxifen, which was a previously reported anti-Ebola inhibitor.26 Likewise, tetrandrine is highly structurally similar (Tc=0.97) to cepharanthine, a training set active compound. The most potent hit in this study, vindesine, had a Tc of 0.96 to vinblastine, which was the most potent hit in the original screen.26 These hits, while not entirely unique from a chemical perspective, illustrate that the developed QSAR models are robust and that the experimental assays are reproducible. The remaining 10 hits were considerably dissimilar from any training set compounds (Tc = 0.63-0.89), thereby constituting novel anti-Ebola chemotypes as compared to the training set compounds.
1.3.4.c Comparison to Previously Reported EBOV Inhibitors
The potencies and structures of the 14 hits identified in this study were compared to a compiled set of 60 previously published compounds with either in vitro or in vivo anti-Ebola activity.2,7,27,28 The full list of previously known published compounds and their potencies can be found in the Supplementary File 15.
28
vindesine as one of the most potent hits identified to date highlights the robustness of the developed QSAR models, as well as the efficacy of this class of compounds and compounds with the same associated MOA as viable anti-Ebola compounds.
The second most potent hit identified from the virtual screen was BIX-01294 (0.97 μM). This compound is among most potent reported anti-Ebola compounds. Moreover, BIX-01294 is structurally dissimilar from other previously reported compounds (Table 1.4) and has a unique primary MOA (G9a histone methyltransferase inhibition).29 In contrast to vindesine, the identification of BIX-01294 demonstrates the ability to QSAR-based virtual screening to retrieve structurally novel chemotypes.
The next most potent series of hits includes afimoxifene (1.36 μM), tetrandrine (2.16 μM), NVP-ADW742 (3.05 μM), and endoxifen (3.05 μM). Afimoxifene and endoxifen are metabolites of tamoxifen (Table 1.4), which was previously reported as a sub-micromolar Ebola inhibitor 7. Likewise, tetrandrine is structurally similar to cepharanthine (Table 1.4),7 as both are isolated from the same plant genus. NVP-ADW742, on the other hand, is structurally dissimilar from any previously reported compound (Table 1.4). However, additional tyrosine kinase inhibitors have shown efficacy against the EBOV with a range of potencies in vitro, such as sunitinib (1.91 μM) and nilotinib (24.3 μM).7
29
34 1.4 DISCUSSION
The power of virtual screening is its ability to quickly process millions of compounds and prioritize a small set of highly confident predictions for experimental confirmation. This approach not only saves time and cost as compared to the experimental high throughput screening, but also may lead to the evaluation of additional approved drugs that could be missed in the physical compound screening library. A combination of virtual screening with experimental confirmation is especially useful for challenging assays due to high biosafety requirements, limited patient samples, expensive reagents, or difficult formats (small animal or 3D cell culture). In this study, we prioritized 102 compounds from an in silico library of ~17 million compounds for testing in
the EBOV entry assay using QSAR modeling and virtual screening.Fourteen of these hits were
experimentally confirmed, including 5 selected hits against live-EBOV infections, and their anti-Ebola mechanisms of action were determined using.
The EBOV entry process has been extensively studied. Viral envelope glycoproteins attach to the surface of host cell, and the virus enters through micropinocytosis and endocytosis. Although a cell surface receptor and a few other components are still not clear, several key host factors including cathepsin B/L in the endosome13 and Niemann Pick C1 protein (NPC1) in the lysosome have been reported as regulators of EBOV entry.14,15 The chemical biology and anti-Ebola MOAs of the 14 experimentally validated hits were evaluated for interactions with both host and viral targets.
35
activity. We also found that osanetant, an anti-psychotic, induces the enlargement of lysosomes and impairs lysosomal function. Additionally, BIX-01294 showed sub-micromolar activity to inhibit EBOV entry. Our LysoTracker dye staining data indicated that BIX-01294 may block EBOV entry through a blockade of lysosome function in host cells. BIX-01294 is a G9a histone methyltransferase (HMTase) inhibitor.29 HMTases have not been implicated in EBOV entry or replication. Additional chemical biology experiments to test the importance of HMTases in EBOV entry should be performed. Two hedgehog-signaling pathway modulators, Hh-Ag1.5 and GANT61,30 showed moderate anti-Ebola activity. Our results revealed multiple mechanisms of action involved in the inhibition of EBOV entry by GANT61. GANT61 caused enlargement of lysosomes and inhibited both cathepsin L and cathepsin B, which are known to impair EBOV entry. Two hits from the QSAR-based screen, ZINC91973695 and ZINC67869167, have no previously reported bioactivities. Results of our chemical biology evaluations showed that both compounds induced enlargement of lysosomes, which may implicate the blockage of lysosomal function as a mechanism of action for these two compounds with novel anti-Ebola scaffolds.
36
inhibitor during the course of our study. Thus, these results demonstrate the ability of our QSAR models to reliably retrieve compounds with anti-Ebola activities and confirm the reproducibility of the VLP-assay.
1.5 CONCLUSIONS
Our study is the first case of QSAR-driven experimental discovery of novel anti-Ebola agents with limited host cell toxicity. Robust and predictive QSAR models for both anti-Ebola activity and host cytotoxicity were developed and used for virtual screening of ~17 million compounds in order to identify Ebola inhibitors with high therapeutic windows (selectivity indices). Ultimately, 102 VS hits were tested in both Ebola VLP and ATP content cytotoxicity assays; 14 of these hits had IC50 < 10 μM and SI > 10, which is comparable to the measured
potencies of several previously reported compounds. The two most potent hits in the screen were vindesine, a vinca alkaloid microtubule inhibitor, and BIX-01294, an HMTase inhibitor (Table 1.2). In a live-EBOV assay, vindesine had an IC50 of 0.34 µM. Several of the hits were SERMs and RTKs, which have MOAs known to be related to anti-Ebola activity. We investigated the previously uncharacterized MOAs for anti-Ebola activity of several hits, including both host factors and direct Ebola VLP interactions. Two compounds, ZINC91973695 and ZINC67869167, represent novel chemotypes and can be considered as leads for future anti-Ebola chemical optimization.
37
granted orphan drug status in the United States for EBOV disease. The integrated computational
and experimental strategy employed in this study represents an advancement for the rapid
discovery of Ebola therapeutics.
1.6 EXPERIMENTAL SECTION
1.6.1 Data Collection, Curation, and Classification
1.6.1.a Antiviral Data
Prior to this work, the Ebola VLP was prepared at the Icahn School of Medicine at Mount Sinai, and VLP-based qHTS screening campaigns were performed at the National Center for Advancing Translational Sciences (NCATS) at the National Institutes of Health (NIH).26 The results of 4 qHTS screening campaigns (2 primary and 2 confirmatory) were extracted from PubChem (AIDs 1117318, 1117313, 1117312, and 1117308).34,35 These data are available in Supplementary Files 1-4.
Each of the four screens has three readouts, including a blue, green, and ratio (blue/green) channel. The blue channel analyzes the efficacy of the compound at inhibiting VLP entry activity in the host cell. The green channel indicates the healthy and viable cells that loaded with CCF2-AM. The ratio channel screen measures the ratio of blue/green spectra. The beta-lactamase in the VLP hydrolyzes the CCF2-AM dye used in the assay to give a blue fluorescence spectrum. An effective inhibitor will prohibit the beta-lactamase in the VLP from hydrolyzing CCF2-AM, resulting in reduction of the intensity of the blue fluorescence spectrum. A low blue emission spectrum indicates that the compound is inhibitory, while a high green emission spectrum reflects the absence of host cytotoxicity. A simplified schema of the assay is depicted in Figure 1.9.
38
Additionally, replicate compounds were identified and sets were removed if screening results conflicted; if the results were concordant, then one representative compound was selected. After curation, 3104 unique compounds remained.
Figure 1.9. Simplified schema of Ebola VLP assay. Ebola VLPs contain Ebola GP and the VP40 protein fused to a beta-lactamase (Bla) reporter. HeLa cells are loaded with the beta-lactamase substrate CCF2-AM. If the VLP enters into the cell, Bla hydrolyzes the substrate CCF2-AM, disrupting the fluorescence resonance energy transfer (FRET) in the substrate, thus causing blue fluorescence. Inhibition of the VLP by a chemical will preserve the substrate FRET, maintaining a green fluorescence. The ratio of blue/green fluorescence intensities represents the VLP activity of inside cells.
1.6.1.b Cytotoxicity Data
39
line, and 156 unique compounds were tested in HEK cell line. All 156 compounds tested in the HEK cell line were also tested in the HeLa cell line. Data curation was performed as above, and one organometallic was removed, leaving 170 and 155 compounds for consideration from the HeLa and HEK cell lines, respectively. These data are available in Supplementary Files 5-6.
1.6.1.c Determination of Antiviral Activity
Only compounds with dose-response curve classes39 of 1.1, 1.2, 2.1, 2.2, and 4 were considered for potential inclusion into the QSAR model training set. In order to comprehensively characterize the results of the screens, two separate protocols were used to classify “active” and “inactive” compounds for subsequent QSAR modeling. In the first protocol (P1), a compound was classified as “active” if and only if the compound had an AC50 < 10 μM and Maximum Inhibition ≥ 70% in both a primary and confirmatory screen. Similarly, an “inactive” compound had an AC50 ≥ 10 μM and Maximum Inhibition < 70% in both a primary and confirmatory screen.
In the second protocol (P2), an “activity” score was calculated for each compound, j, according to the following equation
40
“active”. Similarly, if a compound had an activity score < 70 in either a primary or confirmatory screen, the compound was classified as “inactive”.
1.6.1.d Determination of Cytotoxicity
For both the HeLa and HEK cell lines, a compound was considered “toxic” if the associated pAC50> 4.0 (AC50 < 100 μM); whereas, a compound was considered “non-toxic” if the pAC50≤ 4.0 (AC50 ≥ 100 μM) or the curve class was 4, indicating no response. Only compounds with dose-response curve classes39 of 1.1, 1.2, 2.1, 2.2, and 4 were considered.
1.6.1.e Antiviral Training Set Balancing
In both protocols (P1 and P2), the data were imbalanced towards the inactive class. Thus, in order to balance the active and inactive classes in a 1:1 ratio, the inactive class was down-sampled.40 Fifty percent of the corresponding inactives with the highest Tanimoto similarity41, i.e., the most similar inactives to the compounds from active class based on MACCS keys fingerprint,42 were chosen, and the remaining 50% of the corresponding inactives were randomly selected. Important to note that all rationally chosen inactives had different nearest neighbors among actives.43 For P1 and P2, a total of 166 compounds (83 active and 83 inactive) and 1224 compounds (612 active and 612 inactive) formed the respective training sets. These compounds are available in Supplementary Files 7-8.
1.6.1.f Cytotoxicity Training Set Balancing
41 1.6.1.g Modelability Index (MODI)
The MODelability Index (MODI) estimates the likelihood of obtaining predictive QSAR models for a binary data set of compounds.44 MODI is defined as a weighted ratio of the number of nearest-neighbor pairs of compounds in descriptor space with the same activity class versus the total number of pairs. MODI threshold of 0.65 was previously found to separate the modelable from non-modelable data sets.44 MODI was calculated for all antiviral and cytotoxicity datasets prior to QSAR modeling in the present study as described earlier.44
1.6.2 Computational Methods
1.6.2.a QSAR Model Generation and Validation
42
SE = TP
TP+FN (1)
SP = TN
TN+FP (2)
CCR = SE+SP
2 (3)
PPV = TP
TP+FP (4)
NPV = TN
TN+FN (5)
Here, TP and TN represent the number of true positives (correct classifications of actives), and true negatives (correct classifications of inactives), respectively; whereas, FP and FN represent the number of false positives (incorrect classifications of actives) and false negatives (incorrect classifications of inactives), respectively.
1.6.2.b Virtual Screening
43
validated, the Sequential Agglomerative Hierarchical Nonoverlapping (SAHN) method implemented in the ISIDA/Cluster program53 was used to probe the uniqueness of hit chemotypes and to identify the most structurally similar compounds in the training set and in the published literature.
1.6.3 Experimental Methods
Ebola VLPs containing a beta-lactamase-fused VP40 and GP were prepared in Dr. García-Sastre's lab, as previously described.6 LiveBLAzer FRET–B/G Loading Kit and CCF2-AM, Dulbecco's modified Eagle's medium (DMEM), and Opti-MEM reduced serum medium were purchased from Life Technologies (Carlsbad, CA, USA). An ATP content cell viability assay kit was purchased from Promega (Madison, WI, USA). 1536-well polystyrene plates were purchased from Greiner Bio-One (Monroe, NC, USA). Compounds were purchased from Sigma-Aldrich (St. Louis, MO, USA), Santa Cruz (Dallas, TX, USA), ChemBridge Corporation (San Diego, CA, USA), Enamine Ltd (Kiev, Ukraine), Maybridge Chemical Company (Altrincham, United Kingdom), Vitas-M Laboratory (Champaign, IL, USA), Ambinter (Orléans, France) and AKos Consulting & Solutions Deutschland GmbH (Steinen-Schlächtenhaus, Germany) at the highest available purity. All of the compounds were dissolved as a 10 mM stock solution in dimethyl sulfoxide (DMSO) and diluted in DMSO at a 1∶3 dilution to generate eleven concentrations in 384-well plates, followed by reformatting into one 1536-384-well compound plate for high throughput screening.
1.6.3.a Materials
44
on a Waters semi-preparative HPLC. The column used was a Phenomenex Luna C18 (5 micron, 30 × 75 mm) at a flow rate of 45 mL/min. The mobile phase consisted of acetonitrile and water (each containing 0.1% trifluoroacetic acid). A gradient of 10% to 50% acetonitrile over 8
minutes was used during the purification. Fraction collection was triggered by UV detection (220 nm).
1H spectra were recorded using an INOVA 400 MHz spectrometer (Varian). Samples were analyzed on an Agilent 1200 series LC/MS using a Zorbax Eclipse XDB-C18 reverse phase (5 micron, 4.6 x 150 mm) column and a flow rate of 1.1 mL/min. The mobile phase was a mixture of acetonitrile and H2O each containing 0.05% trifluoroacetic acid. LC Method A: a gradient of 4% to 100% acetonitrile over 7 minutes was used during analytical analysis. LC Method B: a gradient of 4% to 100% acetonitrile over 3 minutes was used during analytical analysis. High resolution mass spectrometry was recorded on Agilent 6210 Time-of-Flight LC/MS system.
2,2'-((2-(pyridin-4-yl)dihydropyrimidine-1,3(2H,4H)-diyl)bis(methylene))bis(N,N-dimethylaniline) (GANT61)
1H NMR (400 MHz, DMSO-d
45
(1R,3R,5S)-3-((10,11-dihydro-5H-dibenzo[a,d][7]annulen-5-yl)oxy)-8-methyl-8-azabicyclo[3.2.1]octane 2-hydroxypropane-1,2,3-tricarboxylate (Deptropine citrate)
HRMS calculated for : C23H28NO [M + H]+ 334.2165, found 334.2150. LC/MS (Method A): (electrospray +ve), m/z 334.1 (MH)+, t
R = 5.000, UV254 > 98%.
(11S,31S)-16,36,37,54-tetramethoxy-12,32-dimethyl-11,12,13,14,31,32,33,34-octahydro-2,6-dioxa-1(7,1),3(8,1)-diisoquinolina-5(1,3),7(1,4)-dibenzenacyclooctaphane (Tetrandrine)
1H NMR (400 MHz, DMSO-d
46
= 16.0 Hz, 1H), 2.28 (d, J = 13.5 Hz, 1H), 2.18 (s, 3H). HRMS calculated for C38H44N2O6 [M + 2H]2+ 312.1594, found 312.1602. LC/MS (Method A): (electrospray +ve), m/z 623.2 (MH)+, t
R = 3.866, UV254 > 98%.
(Z)-4-(1-(4-(2-(dimethylamino)ethoxy)phenyl)-2-phenylbut-1-en-1-yl)phenol (Afimoxifene)
1H NMR (400 MHz, DMSO-d
6) δ 9.40 (s, 1H), 7.22 – 7.13 (m, 2H), 7.09 (ddd, J = 6.8, 4.0, 1.3 Hz, 4H), 7.01 – 6.94 (m, 2H), 6.78 – 6.72 (m, 2H), 6.72 – 6.66 (m, 2H), 6.61 – 6.54 (m, 2H), 3.88 (t, J = 5.9 Hz, 2H), 2.52 (m, 2H), 2.40 (d, J = 7.3 Hz, 2H), 2.15 (s, 5H), 0.84 (t, J = 7.4 Hz, 3H). HRMS calculated for C26H30NO2 [M + H]+ 388.2271, found 388.2288. LC/MS (Method A): (electrospray +ve), m/z 388.1 (MH)+, tR = 5.056, UV254 > 98%.
4-(4-(benzhydryloxy)piperidin-1-yl)-1-(4-(tert-butyl)phenyl)butan-1-one (Ebastine)
47
methyl (3S,5S,7S,9S)-9-((3aR,3a1R,4R,5S,5aR,10bR)-5-carbamoyl-3a-ethyl-4,5-dihydroxy- 8-methoxy-6-methyl-3a,3a1,4,5,5a,6,11,12-octahydro-1H-indolizino[8,1-cd]carbazol-9-yl)-5-
ethyl-5-hydroxy-1,4,5,6,7,8,9,10-octahydro-2H-3,7-methano[1]azacycloundecino[5,4-b]indole-9-carboxylate sulfate (Vindesine)
1H NMR (400 MHz, DMSO-d
6) δ 9.67 (s, 1H), 7.52 (d, J = 7.9 Hz, 1H), 7.34 (d, J = 8.1 Hz, 1H), 7.26 (s, 1H), 7.17 (d, J = 3.1 Hz, 1H), 7.08 (t, J = 7.5 Hz, 1H), 7.00 (t, J = 7.5 Hz, 1H), 6.43 (s, 1H), 6.25 (s, 1H), 5.72 (dd, J = 10.7, 4.8 Hz, 1H), 5.61 (d, J = 10.6 Hz, 1H), 5.07 (s, 1H), 4.34 (s, 1H), 3.75 (s, 5H), 3.58 (s, 3H), 3.45 (s, 6H), 3.16 (s, 1H), 3.05 (s, 2H), 2.81 (s, 3H), 2.72 (s, 3H), 2.19 (d, J = 15.3 Hz, 1H), 1.97 (s, 1H), 1.65 – 1.53 (m, 3H), 1.49 – 1.23 (m, 4H), 0.86 (t, J = 7.4 Hz, 3H), 0.73 (t, J = 7.3 Hz, 3H). HRMS calculated for C43H57N5O7 [M + 2H]2+ 377.7124, found 377.7140. LC/MS (Method A): (electrospray +ve), m/z 754.3 (MH)+, t
48
N-(1-benzylpiperidin-4-yl)-6,7-dimethoxy-2-(4-methyl-1,4-diazepan-1-yl)quinazolin-4-amine (BIX-01294)
HRMS calculated for C28H39N6O2 [M + H]+ 491.3129, found 491.3119. LC/MS (Method A): (electrospray +ve), m/z 491.3 (MH)+, tR = 3.199, UV254 > 98%.
(R)-N-(1-(3-(1-benzoyl-3-(3,4-dichlorophenyl)piperidin-3-yl)propyl)-4-phenylpiperidin-4-yl)-N-methylacetamide (Hh-Ag1.5)
49
4-((4-fluoro-2-methyl-1H-indol-5-yl)oxy)-6-methoxy-7-(3-(pyrrolidin-1-yl)propoxy)quinazoline (Cediranib)
1H NMR (400 MHz, DMSO-d
6) δ 11.34 (d, J = 2.4 Hz, 1H), 8.49 (s, 1H), 7.60 (s, 1H), 7.38 (s, 1H), 7.16 (d, J = 8.6 Hz, 1H), 6.98 (dd, J = 8.6, 7.4 Hz, 1H), 6.24 (d, J = 2.0 Hz, 1H), 4.25 (t, J = 6.4 Hz, 2H), 3.99 (s, 3H), 2.58 (t, J = 7.1 Hz, 2H), 2.46 (m, 5H), 2.41 (s, 3H), 1.99 (dd, J = 7.9, 5.7 Hz, 2H), 1.70 (s, 3H). HRMS calculated for C25H28FN4O3 [M + H]+ 451.2140, found 451.2130. LC/MS (Method A): (electrospray +ve), m/z 451.1 (MH)+, t
R = 4.353, UV254 > 98%.
(R)-N-(1-(3-(1-benzoyl-3-(3,4-dichlorophenyl)piperidin-3-yl)propyl)-4-phenylpiperidin-4-yl)-N-methylacetamide (Osanetant)
50
5-(3-(benzyloxy)phenyl)-7-(3-(pyrrolidin-1-ylmethyl)cyclobutyl)-7H-pyrrolo[2,3-d]pyrimidin-4-amine (NVP-ADW742)
1H NMR (400 MHz, DMSO-d
6) δ 8.12 (s, 1H), 7.65 (s, 1H), 7.51 – 7.44 (m, 2H), 7.45 – 7.29 (m, 4H), 7.15 (t, J = 2.0 Hz, 1H), 7.11 – 7.04 (m, 1H), 7.04 – 6.96 (m, 1H), 6.10 (s, 2H), 5.31 (p, J = 8.3 Hz, 1H), 5.17 (s, 2H), 2.72 – 2.58 (m, 4H), 2.47-2.44 (m, 5H), 2.25 (ddd, J = 12.1, 8.5, 2.9
Hz, 2H), 1.74 – 1.62 (m, 4H). HRMS calculated for C28H32N5O [M + H]+ 454.2601, found
454.2615. LC/MS (Method A): (electrospray +ve), m/z 454.2 (MH)+, tR = 4.106, UV254 > 98%.
(E)-4-(1-(4-(2-(methylamino)ethoxy)phenyl)-2-phenylbut-1-en-1-yl)phenol (Endoxifen)
1H NMR (400 MHz, DMSO-d
51
11-(3,4-dimethylbenzyl)-3,7-dimethyl-3,7,11-triazaspiro[5.6]dodecane (ZINC67869167)
HRMS calculated for C20H34N3 [M + H]+ 316.2747, found 316.2757.
((3R,4R)-1-((2,3-dimethyl-1H-indol-7-yl)methyl)-4-(pyrrolidin-1-ylmethyl)pyrrolidin-3-yl)methanol (ZINC91973695)
HRMS calculated for C21H32N3O [M + H]+ 342.254, found 342.2532.
1.6.3.b Cell culture methods
HeLa and HEK293 cells were purchased from the American Type Culture Collection (ATCC, Manassas, VA, USA). The cells were cultured in DMEM supplemented with 10% fetal bovine serum (FBS, GE healthcare, Piscataway, NJ, USA) and 100 U/mL of penicillin and 100 µg/mL of streptomycin (Life Technologies, Carlsbad, CA, USA) at 37 °C in a humidified atmosphere with 5% CO2. Cells were passaged at 90% confluency.
1.6.3.c Ebola VLP beta-lactamase assay for HTS in 1536-well plates
52
compound plate, and 23 nL of each compound was transferred into 1536-well assay plate using an NX-TR pintool station (WAKO Scientific Solutions, San Diego, CA, USA). After 1 h incubation at 37 °C with 5% CO2, 1 µL/well of VLP solution was added to the assay plates using a BioRapTR FRD dispenser. The plates were then spinoculated, followed by incubation at 37 °C with 5% CO2 for 4.5 h. 1 µL CCF2-AM beta-lactamase substrate was added in to each well, and the plates were incubated for 2 h at room temperature. The assay was detected at dual fluorescence intensities (Ex1= 405±20, Em1= 460±20, and Ex2= 405±20, Em2= 530±20 nm) using EnVision plate reader (PerkinElmer, Boston, MA, USA).
1.6.3.d Cell viability assay with the ATP content assay kit
The cell viability assay was performed as previously described.7 Briefly, HeLa and HEK293 cells were plated at 750 cells/well in 3 µL in 1536-well assay plates, followed by the addition of tested compounds at 23 nL/well. After a 4.5 h incubation at 37 °C and 5% CO2, cell viability was measured by adding 3 µL of ATP content assay mixture to each well. Luminescence values were obtained using a ViewLux plate reader (PerkinElmer, Boston, MA, USA).
1.6.3.e Ebola live virus assays
Vero E6 cells were plated in the 96-well plate (black with optical bottom). Briefly, serial dilutions of 5 drugs (diluted in DMEM 2% FBS starting at 10 µM) and DMSO as control, were added to the wells, and incubated for 1 h at 37 °C with 5% CO2. The cells were infected with EBOV/Mayinga-eGFP at a MOI of 0.1 TCID50/cell. The assay was run in triplicate at a biosafety level-4 (BSL-4) facility. The fluorescence was read 72 h after infection using a BioTek Synergy HT.
1.6.3.f Filipin staining and LysoTracker-red staining
53
overnight at 37 °C and 5% CO2. Compounds were added to the assay plate at 23 nL/well. After 24 h incubation at 37 °C and 5% CO2, 2 µl/well of 50 ng/ml filipin or 0.5 µM LysoTracker Red DND-99 was added to the plate. After 1 hr. incubation at 37 °C and 5% CO2, the plates were washed twice. The fluorescence intensities were then read with a fluorescence plate reader (GE Healthcare,
Chicago, Illinois, USA). U18666A [3-β-(2-[diethylamino]ethoxy)-androst-5-en-17-one,
monohydrochloride] was used as the positive control.55
1.6.3.g Cathepsin B/L assay
Cathepsin B/L assays were performed as previously described.8 Briefly, recombinant 5 ng of cathepsin B, or cathepsin L were added into each well in 384-well plate. Indicated drugs were added into the recombinant enzymes, followed by initiation of the reaction by addition of fluorescent substrate. The activity measurements were done using Tecan plate reader (Tecan US, Inc., Morrisville, NC, USA). Cathepsin L inhibitor and ED64 were used as positive controls.8
1.6.3.h Thermal shift binding assay with Ebola VLP
The thermal shift binding assay was performed as previously described.16 Ebola VLPs were pre-incubated with indicated drugs for 10 min at room temperature. The mixture was then subsequently heated at 49 °C for 3 min, followed by centrifugation at 13, 000 x g at 4 °C for 20 min. The supernatant was collected and denatured by heating at 75 °C for 10 min in the presence of SDS loading buffer (Life Technologies, Carlsbad, California, United States). The samples were separated by SDS-PAGE gel electrophoresis and detected by anti-beta-lactamase antibodies (Life Technologies, Carlsbad, California, United States).
1.6.3.i Data analysis and statistics
54 1.7 ASSOCIATED CONTENT
Supporting Information. Supplementary Files 1-15 are available at
https://scapuzzi.web.unc.edu/free-downloads/
Additionally, all the datasets and Chembench models are provided in and on the Chembench Web-Portal (https://chembench.mml.unc.edu/), which provides public access and use of data and models used in this study. The P1, P2, HEK, and HeLa training sets are publicly indexed as “Ebola_SM1” and “Ebola_PCM4”, “151105_Ebola_Toxicity_HEK”, and “151105_Ebola_Toxicity_HELA”, respectively. The Chembench P1, P2, and HeLa models are
publicly indexed as “153004_ebola_Strict_Model1_166_DragonH”,
55
CHAPTER 2: COMPUTATIONAL DISCOVERY AND EXPERIMENTAL
VALIDATION OF POTENT INHIBITORS OF THE UNDERSTUDIED KINASE DCLK1 2.2 INTRODUCTION
Doublecortin-like kinase 1 (DCLK1) has been implicated in the development and progression of several cancers.56,57 Recent studies have shown that DCLK1, which is also referred to as DCAMKL-1, drives tumorigenesis in colon and pancreatic cancer58,59, is overexpressed in cancers of the liver and esophagus60,61, and such overexpression is an adverse prognosis factor in bladder and non-small cell lung cancer62,63. Notably, in 2013, Nakanishi et al. showed that DCLK1 expression uniquely distinguished tumor stem cells (TSCs) in colorectal cancer from healthy stem cells and demonstrated that specific ablation of DCLK1-positive TSCs reduced tumor size without damaging healthy tissue.64 Given these observations, DCLK1 represents an emergent therapeutic target in oncology, especially, for colorectal cancer.
56
The development of a chemical probe is dependent upon the identification of high quality chemical starting points for potency and selectivity optimization.66 This process is particularly challenging for dark kinases like DCLK1, where chemogenomics data and SAR studies are limited and often the unintended consequence of screening campaigns for other kinases. Indeed, the handful of compounds in the literature that target DCLK1 have come mainly from a kinome-wide screen of inhibitors bearing pyrimido-diazepine scaffolds69 or have been reported as an off-target effect during probe development for other kinases such as, ACK1, ERK5, and LRRK2.69–71 The development of novel DCLK1 inhibitors is critical to progress probe development for this biomedically-relevant, but, so far, dark kinase.
57
In order to accomplish this goal, we executed the following steps: (i) the development of QSAR models of DCLK1 inhibition from prior screening data; (ii) virtual screening of focused chemical libraries to identify putative DCLK1 inhibitors; (iii) experimental validation of selected compounds; and (iv) off-target selectivity analyses for experimentally confirmed hits.
Once several high-quality DCLK1 inhibitors were identified, we then (v) derived structural rules and key molecular interactions to guide future design and optimization efforts of these compounds using the cheminformatics techniques of matched molecular pair analysis, QSAR model interpretation, and molecular docking. This joint modeling and experimental effort (Figure 2.1) resulted in the discovery of some of the most potent DCLK1 inhibitors to-date. These
compounds constitute leads for the development of a chemical probe for this dark kinase.
2.3 RESULTS
2.3.1 QSAR Model Development
Modelability Index (MODI),44 which affords rapid estimation of the feasibility of obtaining predictive QSAR models, was calculated for both training sets. MODI values of 0.79 and 0.89 were obtained for the KINOMEscan and KiNativ training set, respectively. These MODI values were well-above the recommended threshold of 0.65, indicating that despite a high degree of Figure 2. 1. Overall study design. The workflow combines computational and experimental medicinal chemistry approaches for the discovery for novel potent DCLK1 compounds.
Table 2.1.Statistical characteristics obtained on 5-fold external CV of all models developed in this study.Figure 2. 2. Overall study design. The workflow combines computational and experimental medicinal chemistry approaches for the discovery for novel potent DCLK1 compounds.
Table 2.2.Statistical characteristics obtained on 5-fold external CV of all models developed in this study.
Figure 2. 3. Four scaffolds (A-D) based on the pyrimido-diazepine core (purple) possessed by compounds in the modeling datasets. Note A-C are 1,4-diazepines, while D is a 1,3-diazepine.Table 2.3.Statistical characteristics obtained on 5-fold external CV of all models developed in this study.Figure 2. 4. Overall study design. The workflow combines
computational and experimental medicinal chemistry approaches for the discovery for novel potent DCLK1 compounds.
Table 2.4.Statistical characteristics obtained on 5-fold external CV of all models developed in this study.Figure 2. 5. Overall study design. The workflow combines computational and experimental medicinal chemistry approaches for the discovery for novel potent DCLK1 compounds.
58
imbalance towards inactive compounds and limited chemical diversity there was meaningful SAR that separates actives from inactives.
Next, we moved to model development and succeeded in developing robust and externally predictive QSAR models. Results of 5-fold external cross-validation are presented in Table 2.1. All metrics used to evaluate model performance were above the recommended threshold of 0.60. As such, these metrics demonstrated that active and inactive DCLK1 compounds can be correctly classified through statistically meaningful SAR.
Since externally-validated and predictive QSAR models were developed using all available data, the applicability domain (AD) of the models was maximized, as the imbalanced datasets did
not need to be down-sampled.40 Both the KINOMEscan and KiNativ models were predictive and
useful for virtually screening new compounds in so far as these compounds fell within the AD that has been maximized by using all available data. In order to demonstrate that the models were not
Model Name Actives Inactives Total CCR SE SP PPV NPV
KINOMEscan 8 45 53 0.84 0.75 0.92 0.62 0.95
KiNativ 5 42 47 0.73 0.70 0.75 0.61 0.96
Table 2.33.Statistical characteristics obtained on 5-fold external CV of all models developed in this study.
Figure 2. 41. Four scaffolds (A-D) based on the pyrimido-diazepine core (purple) possessed by compounds in the modeling datasets. Note A-C are 1,4-diazepines, while D is a 1,3-diazepine.Table 2.34.Statistical characteristics obtained on 5-fold external CV of all models developed in this study.
Figure 2. 42. Four scaffolds (A-D) based on the pyrimido-diazepine core (purple) possessed by compounds in the modeling datasets. Note A-C are 1,4-diazepines, while D is a 1,3-diazepine.
Figure 2. 43. Four scaffolds (A-D) based on the pyrimido-diazepine core (purple) possessed by compounds in the modeling datasets. Note A-C are 1,4-diazepines, while D is a 1,3-diazepine.Table 2.35.Statistical characteristics obtained on 5-fold external CV of all models developed in this study.
Figure 2. 44. Four scaffolds (A-D) based on the pyrimido-diazepine core (purple) possessed by compounds in the modeling datasets. Note A-C are 1,4-diazepines, while D is a 1,3-diazepine.Table 2.36.Statistical characteristics obtained on 5-fold external CV of all models developed in this study.
59
obtained because of random SAR correlation between bioactivity and chemical descriptors, 1000 rounds of Y-randomization was performed. All Y-randomized models showed a CCR below 0.60.
2.3.2 QSAR-Based Virtual screening
A set of 169 designed compounds possessing the same scaffolds as in Figure 2.2 was virtually screened with both QSAR models (See Methods). Although all 169 compounds were within the AD of both models, only seven compounds were predicted as active by both models. All seven compounds possessed the 5,11-dihydro-6H-benzo[e]pyrimido[5,4-b][1,4]diazepin-6-one scaffold (Figure 2.2B). The remaining compounds were either predicted active only by the KINOMEscan model (29 compounds) or the KiNativ model (two compounds); 131 compounds were predicted inactive by both models. These results are consistent with the distribution between actives and inactives in the training sets, supporting the notion that DCLK1 has highly specific requirements to compound structure to make it active. From the compounds that did not meet the “hit” criteria, four were selected as negative controls for the model validation. Ultimately, 11 compounds, seven putatively active and four predicted inactive, were selected for experimental studies. Virtual screening results for all compounds are provided in the Supporting Information (Supplementary Table 1).
60 2.3.3 Experimental Validation
61
μM for DCLK1. Full dose-response curves are available in Figure 2.3.
Figure 2. 73. Dose-response curves for the eleven virtual screening hits.
Figure 2. 74. Dose-response curves for the eleven virtual screening hits.
62
The selectivity profiles of the eight compounds with IC50 < 10 μM for DCLK1 were determined using a KiNativ screen (Table 2.3). The compounds were evaluated both by the selectivity index (SI) at 65% and 90% inhibition at 10 μM, i.e., SI(65) and SI(90), respectively. The Structural Genomics Consortium (SGC) has previously defined SI(65) < 4.0% and SI(90) < 2.0% as acceptable selectivity profiles for a tool compound to be considered for inclusion into their
comprehensive kinase chemogenomics set (KCGS).66 Only XMD13-37 inhibited more than 4% of
kinases screened according to SI(65). On the other hand, all eight compounds had acceptable SI(90) profiles. KiNativ screen data are provided for the eight compounds in the Supporting Information (Supplementary Table 2).
2.3.4 SAR Analysis and Implications for Future Design
All of the experimentally validated hits possessed the
5,11-dihydro-6H-benzo[e]pyrimido[5,4-b][1,4]diazepin-6-one scaffold, and the four most potent hits shared common structural moieties (Table 2). In order to gain insights about structural aspects and key molecular interactions associated with DCLK1 inhibition among these compounds, as well as to guide future design and optimization efforts, SAR analysis was performed using several cheminformatics techniques.
2.3.4.a Matched Molecular Pair Analysis and Model Interpretation
63
activity cliffs. This analysis revealed that the presence of a methoxy substituent at R1 and a co-occurring methyl substituent at R2 correlated with increased DCLK1 inhibition.
On the other hand, the influence of the R3 substituent was unclear, as active compounds XMD8-85 and XMD8-87 are MMPs differing only at this position. Fragment descriptor interpretation (Figure 2.5) from the KINOMEscan QSAR model, however, showed that the methyl addition at R3 increased the overall active (inhibitory) character of 85 relative to XMD8-87. The SAR elucidated by the MMP analysis was also reflected by the model interpretation, as methoxy substituents at R1 and methyl substituents at R2 increased the activity profile in descriptor space.
2.3.4.b Molecular Docking
Training set compounds were docked into the crystal structure of DCLK1 (PDB:5JZN)57
64 2.4 DISCUSSION
Despite small dataset sizes with limited chemical diversity and a small number of active compounds, robust and predictive QSAR models of DCLK1 inhibition were developed from the results of KINOMEscan and KiNativ assays (Table 2.1). On further inspection, these training set characteristics were, in fact, crucial for successful QSAR model development. The limited chemical diversity in terms of scaffolds (Figure 2.2) among the training sets meant that large changes in DCLK1 bioactivity were caused by slight modifications in a small number of substituents. This observation was supported by the high MODIs of the training sets, which indicated that there was statistically meaningful SAR separating active compounds from inactive compounds. Both the MMP and model interpretation analyses also reflected this observation (Figures 2.3 and 2.4), as both showed that the activity profile was modulated by a few substituents at key sites. The successful development of QSAR models for DCLK1 inhibition from small and highly congeneric compounds harkens back to the early days of QSAR modeling and underscores the continuing need to carefully inspect modeling datasets, through methods like MODI, prior to modeling.
65
Overall, eight compounds from the virtual screen, all of which possessed the 5,11-dihydro-6H-benzo[e]pyrimido[5,4-b][1,4]diazepin-6-one scaffold, had IC50 < 10 μM, including five sub-micromolar inhibitors (see Table 2.2). XMD13-44, a 52 nM inhibitor, was the most potent compound identified through virtual screening, which highlights that these models are capable of not only classifying inhibitors (actives) from non-inhibitors (inactives), but also of identifying highly potent compounds within the same chemical series. By any measure, the hit-rate from QSAR-based virtual screening of compounds (~73%) is enriched in comparison to the ~13% active-calls from the preliminary kinome screens of these same scaffolds (Table 2.1).
66
(Supplementary Table 2). Optimizing DCLK1-selective compounds from this scaffold is, therefore, an on-going effort.70,80,81
To this end, SAR analyses were performed to inform optimization efforts through the identification of chemical structures and key protein-ligand interactions that drive DCLK1 inhibition. Cheminformatics approaches, i.e., MMP analysis, QSAR model interpretation, and molecular docking, provided hypotheses about the underlying chemical features and molecular interactions that drive DCLK1 inhibition for lead compounds bearing the 5,11-dihydro-6H-benzo[e]pyrimido[5,4-b][1,4]diazepin-6-one scaffold. These cheminformatics approaches can also be applied to design and optimize follow-up compounds for both potency and off-target selectivity considerations.
67
While the SAR trends around these three positions correlate with DCLK1 inhibition, not all of them are necessarily required for the desired activity and potency. For instance, the highly potent compound TL-1-038 (109 nM) does have two co-occurring methyl substituents at R2 and R3 on the diazepine ring, but lacks the methoxy group at R1. These derivations from the SAR trends highlight the importance of multivariate features in molecular design, as TL-1-038 possesses a piperidinol group attached to the aniline moiety that is unique among all hits. In fact, potent inhibitors XMD13-44, XMD8-90, and TL-1-038 all differ at this tail region off of the aniline moiety (Table 2.2), making it a possible site for further medicinal chemistry efforts.
Molecular docking provided additional insights to SAR trends among MMPs.82
XMD10-39, a 154 nM inhibitor, differs from training set active compound XMD8-85 and from training set inactive XMD10-78 by a single ethyl substitution at R2. This observation indicates that, for the most part, both methyl and ethyl substitutions at the R2 position are tolerated for DCLK1 inhibition, whereas an isopropyl is not. This slight change in structure that results in a large change in activity is reflected by the molecular docking results (Figure 2.6), which shows that the binding pose of inactive XMD10-78 (red) is flipped in the ATP-binding site relative to active compounds
XMD8-85 (teal) and XMD10-39 (green). It is worth noting that JWE-067 (0.265μM) possesses
68
Docking provided additional hypotheses about the key protein-ligand interactions for other DCLK1 inhibitors. Using the two most potent compounds as examples, which also have the two best docking scores, key hydrogen-bonds are likely formed with the backbone of the hinge-region valine in the ATP-binding by the 3-position pyrimidine nitrogen and the aniline NH site (Figure 2.7).
The recommended modifications to the four most potent lead compounds, i.e.,
XMD13-44, XMD8-90, XMD10-39, and TL-1-038 (Table 2.2), are summarized in Figure 2.8. Based on the SAR analysis, a methoxy substitution at R1 paired with either a methyl or ethyl substitution at R2 promotes DCLK1 inhibition (Figure 2.2). A methyl substituent at the R3 position is present in all four lead compounds (Table 2.2) and was shown to promote DCLK1 inhibition among training set MMPs (Figure 2.3). At minimum, a methyl substituent at this position is required. Docking studies also suggest that additional hydrogen bonds may be formed by larger chemical
Figure 2.6 Docking of matched
molecular pairs. The binding pose of inactive XMD10-78 (red) is flipped in the ATP-binding site relative to active compounds XMD8-85 (teal) and XMD10-39 (green). Note that the 5,11-dihydro-
6H-benzo[e]pyrimido[5 ,4-b][1,4]diazepin-6-one scaffold of the active compounds are perfectly aligned. Figure 2.89. Docking of matched molecular pairs. The binding pose of inactive XMD10-78 (red) is flipped in the ATP-binding site relative to active compounds XMD8-85 (teal) and XMD10-39 (green). Note that the 5,11-dihydro-
69
substituents at R3 and residues in the pocket (Figure 2.7). This site should be considered for further optimization and SAR studies. Finally, the R4 region off of the aniline moiety is varied among the leads and the training set MMPs, making it another possible site for optimization and combinatorial design.
2.5 CONCLUSIONS
The integration of QSAR-based virtual screening and experimental medicinal chemistry (Figure 1.1) used in this study resulted in the discovery of the most potent and selective series of DCLK1 inhibitors to date. We succeeded to develop robust and predictive QSAR models of DCLK1 inhibition, despite challenges in the available data, which included limited dataset sizes and a very small amount of active compounds. These models were used hen to screen a set of 169
compounds. Ultimately, five sub-micromolar inhibitors with a
5,11-dihydro-6H-benzo[e]pyrimido[5,4-b][1,4]diazepin-6-one scaffold were identified using this approach. The top hit, XMD13-44, had an IC50 of 52 nM. Subsequent cheminformatics-based SAR analyses
Figure 2.7104. SAR analysis and implications for design. Recommended modifications to the four most potent lead compounds at positions R1-R4 are shown. Sites known to modulate DCLK1 activity are shown in green. Sites proposed for DCLK1 optimization are shown in orange.
Figure 2.105. SAR analysis and implications for design. Recommended modifications to the four most potent lead compounds at positions R1-R4 are shown. Sites known to modulate DCLK1 activity are shown in green. Sites proposed for DCLK1 optimization are shown in orange.
Figure 2.106. SAR analysis and implications for design. Recommended modifications to the four most potent lead compounds at positions R1-R4 are shown. Sites known to modulate DCLK1 activity are shown in green. Sites proposed for DCLK1 optimization are shown in orange.