Contents Overview 2 Hydrology 3 Hydraulics 5 Hydraulic Structures 6 2 Dimensional Flow 9 Water Quality 12 Building your model 14
Running your model 19 Viewing & Reporting Results 21 System Requirements 25 Digital Terrain Models 18
xpstorm is used for: Stormwater Management
Stormwater master planning Collection system design & analysis Detention facility optimization Stormwater treatment analysis Hydromodification simulations
Floodplain Management
Flood and hazard mapping Emergency evacuation plans Capital improvement plans Flood risk identification Mitigation strategies Disaster recovery plans River Restoration Modeling
Analysis performed by xpstorm Hydrology
Actual and design precipitation events Single event and continuous simulation Deterministic and unit hydrograph runoff Groundwater infiltration and discharge Temporary surface storage
Hydraulics
Full Dynamic wave Pressure flow and Pumping Dual drainage and looped networks Conduit and Detention system optimization Reverse flow and adverse grades
Integrated 1D/2D Overland flow
Water Quality
Pollutant buildup and washoff Street sweeping
Pollutant transport
Treatment analysis and optimization Sediment transport
Technical Description
xp
swmm
is a comprehensive software package for planning, modeling and managing sustainable drainage systems. It simulates storm water and sanitary sewer flows including treatment in typical LID (WSUD) systems. Hydraulically, flows are simulated in 1D channels and pipes and coupled to a powerful 2D engine for comprehensive flood modeling and mapping. The software is used by scientists, engineers as well as resource and asset managers to simulate natural rainfall-runoff processes and the performance of engineered systems that manage our water resources.xp
swmm
is used to develop link-node and spatially distributed models that are used for the analysis, design and simulation of storm and wastewater systems.xp
swmm
also models flow in natural systems including rivers, lakes, floodplains with groundwater interaction and with the Water Quality module also routes pollutants and treatment through these systems.xp
swmm
xp
storm
xpstorm is a comprehensive software package for planning, modeling and managing sustainable drainage systems. It simulates stormwater and river flows including treatment in typical LID (WSUD) systems. Hydraulically, flows are simulated in 1D channels and pipes and coupled to a 2D surface grid for comprehensive flood modeling and mapping. The software is used by scientists, engineers as well as resource and asset managers to simulate natural rainfall-runoff processes and the performance of engineered systems that manage our water resources.
xpstorm is used to develop link-node and spatially distributed models that are used for the analysis, design and simulation of storm collection and conveyance systems. xpstorm also models flow in natural systems including rivers, lakes, floodplains with groundwater interaction and with the Water Quality module also routes pollutants and treatment through these systems.
Overview
GIS Integration - connect to OBDC compliant databases, import/export & display ESRI shape files and MapInfo files. Directly input GIS data with the graphical interface. Display and color code attributes of any object.
CAD Integration - import .dxf and .dwg files and manage the display of layers. Convert the layers to model nodes, links and catchments. LandXML files of networks and terrain can be imported/exported.
Scenario Manager - compare graphically and in tabular format model results for various scenarios. All model data including 2D layers are available to the Scenario Manager.
xpviewer - distribute your model to stakeholders in a read-only format. Model simulations, including all
scenarios may be viewed with downloadable free software.2 Dimensional Hydrodynamic Modeling - model overland flows, street flooding and floodplains using either a 1D/2D integrated model or as a comprehensive 2D only model.
Animations - review and present model results through customizable animations including dynamic long section, color coded dynamic plan view and the synchronized long and cross section view with hydrographs. 2D plan animation includes vectors for flow and velocity and color coding of cells for many map types such as depth, elevation and hazard. These animations offer an unparalleled visualization of model results and can be directly saved to an AVI file.
Real Time Control Simulation - xpstorm
‘
s Real Time Control (RTC) module expands the control capabilities for gates valves, flow regulators, moveable weirs and telemetry-controlled pumps. It extends RTC to a comprehensive management and design tool. RTC sensors can be any combination of velocity, flow and water level at nodes, conduits, pumps, weirs or orifices in the network.Global Storms - simulate and compare model runs using a series of storms such as design storms with varying return period or storm durations from the Global Database. The Global Database dramatically reduces data redundancy and the associated problems of updating multiple locations when changes are made. Examples of global data include rainfall, infiltration, pollutant description, cross sections, dry weather flows and pump curves.
Dual Drainage - simulate flow in conduits and in streets and situations where flow is limited by inlet capacity.
EPA SWMM 5.0 Compatibility - xpstorm can import from or export to SWMM5 model formats.
FEMA Approval - approved by US Federal Emergency Management Authority (FEMA) as meeting the minimum requirements for using a computer model in floodplain mapping for the National Flood Insurance Program. Approval is for Hydrology and 1 and 2 dimensional Hydraulics.
Hydromodification - xpstorm produces flow duration and exceedance curves for continuous simulations. Coupled with the scenario manager and the monthly and annual changes to parameters you can evaluate the impacts of development and mitigation scenarios.
Overland Flow - xpstorm can simulate overland flows in dual drainage systems such as parallel street and pipe systems as well as integrated pipe and 2D overland flow routing.
NPDES - xpstorm models the sewer collection network which can be used to assist National Pollutant Discharge Elimination System permittees to obtain permits and comply with the conditions.
LID - Low Impact Development, also known as Water Sensitive Urban Design (WSUD) or Sustainable Drainage Systems (SuDS) is a philosophy that focuses on specific sustainable water conservation goals. Its aim is to minimize adverse impacts to the hydrologic cycle and water quality principles of low impact development require that projects not increase peak flows.
Evacuation Planning - xpstorm 2D models can include the analysis of evacuation planning routes and graphically report time to inundation and duration of inundation. Additionally, user defined hazard mapping can be generated using depth, velocity and debris factors.
Special
Applications
Key
Features
xpstorm simulates the complete hydrologic cycle in rural and urban watersheds. Beginning with single or multiple rainfall events and dry weather flows, it models flows through collection, conveyance and treatment systems to the final outfalls. All hydrologic process-es including snowmelt, evaporation infiltration, surface ponding and ground-surface water exchangprocess-es are included in the model. Local hydrology can be further described by redirecting flows from impervious areas to pervious surfaces to allow infiltration.
Rainfall
Users may select either design storms or actual recorded rainfall events. Rainfall hyetographs may be linked to a model using off line files or assigned from a global list to catchments. Continuous simulation can be used to evaluate Hydromodification and model catchment response to long term rainfall records while including multiple rainfall stations.Design storms for any duration and return period may be created from a library of rainfall patterns that includes:
SCS Types: I, IA, II, Florida Modified, III, B
Huff Distributions
Chicago Storm
AR&R temporal patterns
UK Summer and Winter Storm Patterns
Storms from localized templates
User defined distributionsEach subcatchment can reference a separate hyetograph enabling the modeling of radar rainfall data, localized storm events or the timing of the hyetographs can be adjusted to simulate movement of a storm across a watershed.
xpstorm also models snowmelt using the Degree-Day method developed by the US National Weather Service.
Runoff
There are numerous methods available for computing storm runoff hydrographs for event or continuous simulations. These are:
Non-linear Runoff Routing (US EPA Runoff Method)
Laurenson’s Non Linear Runoff Routing (RAFTS)
SCS Unit Hydrographs using a Curve Number with curvilinear or triangular unit hydrographs.
Kinematic Wave
Clark Unit Hydrograph
Snyder Unit Hydrograph
Alameda County Snyder and Rational methods
Nash Unit Hydrograph
Santa Barbara Urban Hydrograph
Time Area
Rational Method
LA County Modified Rational Method
Sacramento County Nolte and Hydrograph Methods
Colorado Urban Hydrograph Procedure (CUHP)
EPA RTK Unit Hydrograph for RDII
5 UK Methods: Variable PR, Wallingford, ReFH, FEH, and FSRHydrology
Non-Linear
Runoff
Routing
The primary runoff hydrograph generation method is the EPA SWMM non-linear runoff method. Overland flow hydrographs are generated by a routing procedure using Manning’s equation and a lumped continuity equation. Surface roughness and depression storage for pervious and impervious area parameters further describe the catchment. The subcatchment width parameter is related to the collection length of overland flow and is easily calculated based on watershed characteristics. Urban, suburban, and rural areas of any size may be simulated using non-linear reservoir routing.
The unit hydrograph methods such as SCS, SBUH, LA County Modified Rational, etc. are primarily used for single event simulations. The SWMM runoff method is a deterministic hydrologic method suitable for comprehensive analysis and design including the simulation of LID (WSUD) using catchment surface redirection capabilities. Additional seasonal and annual adjustments can also be made the hydrologic parameters to capture the effects of a changing watershed over time. For example, frozen ground during winter months can be simulated by adjusting infiltration with monthly factors and development can be modeled by increased impervious percentage over several years.
Groundwater
Interactions
Subcatchment infiltration can be coupled to groundwater and is computed using a selection of these methods:
If groundwater is simulated then the unsaturated zone interacts with the infiltration from the watershed surface. Decreased infiltration increases surface runoff. For example, the water table can rise to the ground level from excessive infiltration and cut off the infiltration.
The recovery of depression storage between storms is achieved by means of evaporation as well as recovery of infiltration capacity. Sub-surface flow is routed through saturated and unsaturated zones using the method of lumped storages. Sub-surface outflow is computed using a power equation. Seasonal variation in groundwater levels can drive base flows in streams and infiltration in sewers.
Horton (including cumulative depth cutoff)
Green-Ampt
SCS method with optional sub-surface routing
Initial and Continuing loss
Proportional loss
Initial and ProportionalHydrology
xp
storm
Seasonal Parameter Changes
xpstorm solves the complete St. Venant (Dynamic Flow) equations for gradually varied, one dimensional, unsteady flow throughout the drainage network. The calculation accurately models backwater effects, flow reversal, surcharging, pressure flow, tidal outfalls and interconnected ponds. The model allows for looped networks, multiple outfalls and accounts for storage in conduits. Flow can also be routed using kinematic or diffusive wave methods. Additionally, models can be solved using the SWMM5 engine.
Inlet Capacity
and
Dual Drainage
xpstorm determines the captured flow for a range of inlet types including slot, grate and curb inlets. Options for calculating the inlet capacity are:
Maximum capacity
Rated by approach depth or flowFlow not captured by the inlet is stored on the surface or lost from the system or diverted automatically to overland flow conduits. Additionally, with the included
xp2D
module, surface flows can be routed on a 2D grid.Conduit
Shapes
There are more than 30 different pre-defined hydraulic elements available for hydraulic routing and user-defined open and closed conduits making the number of available shapes virtually limitless:
Circular
Rectangular
Horseshoe
Trapezoidal Channel
Rectangular Triangular Bottom
Basket-handle
Modified Basket-handle
Egg-shaped
Power Function Channel
Semi-Elliptic
Catenary
Gothic
Semi-Circular
Rectangular Round Bottom
Arch
Vertical and Horizontal Ellipse
User-Defined (HEC-2) Open Channel
Rating Curve
Regulator
Reaction Link
User-Defined Closed Sectionxpstorm can also accommodate channels and conduits having roughness changes as a function of depth and can simulate sediment deposition and transport in all conduit shapes.
Hydraulics
Node Data
Dialogs
Data is easily entered and reviewed in graphically enhanced dialogs. Check boxes indicate which options are invoked. Radio buttons are used for selecting a single option from a group. Copy and paste tools are used to replicate data between multiple objects. Tooltips are available indicating field name, parameter description and units when the cursor hovers over a field.
HEC 22 methods
Local and Global 2D Inflow Capture equationsPumps
Pumping of stormwater or wastewater is easily modeled in xpstorm . A pump station may be represented as either an in-line lift station, or an off-line node representing a wet-well, from which the contents are pumped to another node or outfall. Using a multilink up to seven pumps may be assigned to a single pump station representing seven individually controlled pumps or seven settings for a variable speed pump.Pumps may be one of six types:
Rated by Well Volume An in-line or off-line pump station with a wet well; the rate of pumping depends upon the volume (level) of water in the wet well.
Rated by Depth in Node An in-line or off-line lift station that pumps according to the level of the water surface at the junction being pumped.
Rated By Dynamic Head An in-line or off-line pump that pumps according to the depth (head) difference over the pump using a multi point pump curve and starting and stopping elevations.
Rated By Static Head An in-line or off-line pump that pumps according to the head at the upstream node using a multi point pump curve and starting and stopping elevations.
Special Dynamic Head These pumps use a rule curve to modify the flow of the dynamic head pump based on the depth at either an adjacent or non-adjacent node.
Variable Speed These pumps are defined by pump curves that are based on wet well depth or other user defined parameters.Control
Structures
and
Diversions
In gravity conveyance systems, a variety of structures are used to measure, control and divert flows. In xpstorm all diversions occur from nodes and the complex hydraulics of flow regulation devices are modeled in links. User defined diversion rules that can direct flow to the appropriate node as Control devices in xpstorm include:
Weirs:
Transverse
Side flow
Inflatable
Bendable
User-defined geometry Orifices:
Circular bottom
Circular side
Rectangular bottom
Rectangular sideOrifices may have time dependent area and discharge coefficients.
Hydraulic Structures
Real Time
Control
xpstorm’s Real Time Control (RTC) add-on module expands existing depth based control capabilities for gates, valves, flow regulators, moveable weirs and telemetry-controlled pumps. It extends RTC to a comprehensive simulation tool. The sensors can be any combination of time and date variables, conduit velocity and flow, node depth and elevation, and flows in pumps, weirs or orifices. The comprehensive real time control option provides the ability to control any conduit, pump, weir, orifice or rating curve from an unlimited number of sensors. The types of elements subject to RTC and the Parameters capable of being controlled are:
Other control parameters include a variety of time and date options, ramp times and target values. Operators can be concatenated with Boolean operators and parameters can be compared with other sensors or with absolute values. Real time control can be activated only during a certain time period (schedule) and the control can ramp on and/or off over a user-defined time period.
Detention
Storage
In addition to conduits, channels and other flow elements, flow may also be routed through a variety of different storage shapes. The shape of the storage may be defined as:
Constant surface area (tank)
A power functionAlso, a stepwise linear relationship may be defined as:
Stage vs. surface area
Elevation vs. surface area
Stage vs. volume
Elevation vs. volumeThe routing of flows through detention storage units is performed by:
Modified Puls method in the kinematic wave of the Sanitary layer
Dynamic flow equations (St. Venant) in the Hydraulics layerInterconnected ponds and detention basins can be modeled in either parallel or series. Storage can be assigned from the invert of a node to represent typical detention ponds or from the ground surface to represent surface storage such as trap-lows, sag inlets or flooded inlets and intersections.
Element Parameter
Conduit Flow, Roughness, Diameter (or Depth) Node Depth, Elevation
Pump On Elevation, Off Elevation, Speed Factor, Pump Flow Rate, Well Volume Weir Flow, Crest Elevation, Surface Elevation, Length, Discharge Coefficient Orifice Area, Discharge Coefficient
Rating Curve Flow
Hydraulics
2D
Hydrodynamic
Model
1D - 2D
Integrated
Model
Fully two-dimensional (2D) models have been widely used for modeling river and coastal hydraulics and recently have become a viable practical option for modeling urban floods. As a stormwater management tool 2D models are more accurate and produce results that are far more readily accepted and understood by managers, decision makers and other stakeholders.
The
xp2D
modeling package is based on the TUFLOW program developed by WBM Oceanics Australia and the University of Queensland.xp2D
has incorporated the TUFLOW engine into a user-friendly graphical interface which walks the user through preprocessing of input data and the calculation of the model. All of xpstorm ’s familiar tools for generating tables, graphs, and animations are available for reviewing, analyzing and presenting model results. New 2D animation and 2D Scenario Management tools make it easy to present results to managers and decision makers. Multiple sets of 2D results can be loaded, animated and compared.A powerful feature of
xp2D
is its ability to dynamically link to any 1D (quasi-2D) model in an integrated fashion. The user sets up a combination of 1D network domains linked to 2D domains in a single model. An add-on module allows multiple 2D domains that can havedifferent grid sizes and orientation. Multiple 2D domains can be linked with 2D/2D Interface lines.
2 Dimensional Flow
Stormwater flows overland until it enters the underground network. Surcharges may exit the network and resume overland flow after being subjected to inlet or 2D inflow capture rules.
1D elements may be integrated into a 2D flow area to accurately model 1D flow. Cells underlying natural channels that are modeled in 1D are made inactive to avoid double calculation of conveyance and volume.
The 2D active area is divided into cells with user defined dimensions and orientation. Multiple non-contiguous active areas may be defined. At each time step, depths are calculated at the cell center and corners and velocities are calculated on each edge. This 9-point calculation produces highly accurate model results.
Polygons can be imported or digitized within the program to simulate varying initial water surface elevations for ponds, lakes and other storage facilities. Sets of polygons and polylines called Elevation Shapes can be used to alter the grid derived from the DTM such as building finished floor, road crowns, flood walls and other features that would alter the overland flow. Dynamic Elevation Shapes can be used with triggers to simulate levee breach, dam failure, collapsing fences and other real time phenomena.
2D Model
Advanced
Features
Polygons assigning rainfall directly to cells allow distributed hydrology in 2D. The cells can be further described by 2D Landuse with associated 2D Soil Types. The infiltration can be assigned to the cells with user defined parameters or USDA Soil Type using Green-Ampt or Initial and Continuing loss models. In the 2D rain on grid models no catchment delineation is necessary.
2D Rain on
Grid and
2D
2 Dimensional Flow
Running
2D Models
The job control settings are used to define a variety of runtime parameters in order to customize or optimize the model calculations. Once a simulation is completed a comprehensive 2D Summary is produced for model review and QA/QC.
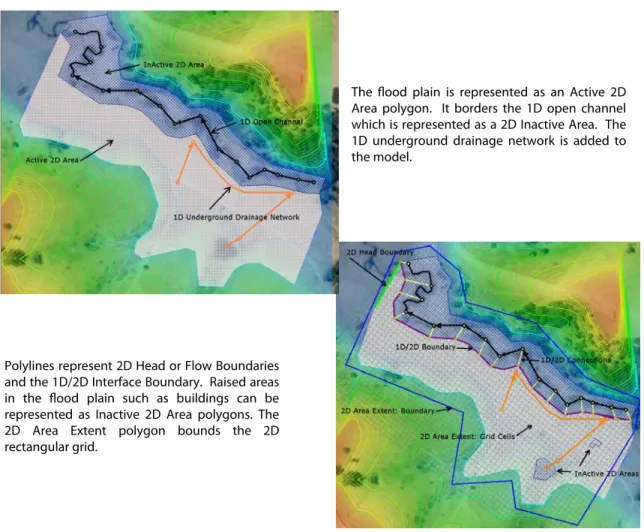
Polylines represent 2D Head or Flow Boundaries and the 1D/2D Interface Boundary. Raised areas in the flood plain such as buildings can be represented as Inactive 2D Area polygons. The 2D Area Extent polygon bounds the 2D rectangular grid.
The flood plain is represented as an Active 2D Area polygon. It borders the 1D open channel which is represented as a 2D Inactive Area. The 1D underground drainage network is added to the model.
Graphic Tools
for 1D-2D
model building
1D-2D models are constructed from intelligent modeling objects. These objects are represented as points, polylines and polygons.
xp2D
has a set of tools that allow the user to quickly lay out the model and manage the properties of the objects.2 Dimensional Flow
Time series outputs of water depth and velocity at user defined points or flows across user defined polylines are easily generated. These plots may be displayed, printed or exported as graphic files.
Viewing
Model
Results
2D model results can be animated in plan view. Color coded maps display time series such as water depth and elevation, stream power and bed shear or hazard. Scaled vectors can display flow or velocity. The vector scaling and color coding are user-defined. DVR-like buttons are used to play animations which may be recorded as AVI files.
All 2D maps can be exported to GIS or to CSV data files. The export to GIS includes ESRI grid and shape files.
2 Dimensional Flow Applications
Evacuation
Planning
Our FEMA-approved software contains tools to assist emergency management personnel in identifying important evacuation routes. Users layout routes in plan view and then specify criteria for depth cutoffs. For example depths above 0.4m (1.5ft) in roadways may prevent vehicle traffic.
Evacuation criteria includes user defined labels to values of depth, velocity or hazard. The Evacuation criteria is unique to each route and the route can follow the terrain or have higher elevations such as when following the road crown.
Several map types exist related to time. Duration and time of inundation to user specified depths can be mapped. For example, duration of flooding may help assess crop damage due to a low tolerance for extended periods of flooding. The map below shows the time to 0.3m of inundation downstream of a dam failure.
Time to
Inundation
xpstorm provides a full suite of tools for modeling processes impacting water quality in watersheds. The software simulates the buildup and washoff of contaminants (non-point sources) in catchments, the direct entry of pollutants into network (point sources), transport through collection and conveyance systems and the treatment of stormwater and wastewater by natural processes and engineered devices.
Buildup
and
Washoff
xpstorm provides a variety of tools for modeling the buildup of any pollutant in a subcatchment. The buildup may be modeled using the US EPA time dependent Dust and Dirt model. Buildup parameters may be assigned for each pollutant and landuse combination in the watershed.
Washoff during rainfall events may be modeled using:
Event Mean Concentration (EMC)
Exponential: dependent on flow and availability
Rating curve: relates concentration to flowErosion
The erosion load can be modeled using the Modified Universal Soil Loss Equation (MUSLE). These results are then presented with the total wash off rate for constituents such as TSS.
Water Quality Modeling
xp
storm
Sediment in Pipes
A static depth of sediment may also be entered as a conduit factor in the Hydraulics mode to alter the convey-ance capacity of the conduit. For example, a culvert may be purposefully buried for fish passage.
BMP Analysis
Best Management Practices (BMP's) or Low Impact Development (LID) strategies may be simulated using the above procedures in xpstorm . The model will quantify the effect of the treatment technology in terms of reduced flow (peak or total volume) and contaminant load.Typical BMP and LID strategies simulated by xpstorm include: rain gardens dry detention basins green roofs wet ponds rain barrels swales
street sweeping porous pavement infiltration trenches filter strips
In addressing sewer overflow problems, the software can identify the volume of spillage, flooding and the concentration of any pollutants or sediment build-up. The modeler may evaluate solutions such as storage, treatment and real-time control adjustments to prevent system failure.
Quality routing is performed as plug flow or complete mixing in storage units. Storage and treatment devices are simulated as a series and/or parallel network of units each with optional flow-storage routing using the modified Puls method.
The treatment simulation uses either user-defined removal equations (for example, removal as exponential function of hydraulic residence time) or sedimentation theory coupled with particle size-specific gravity distribution for constituents. The user may enter any valid equation to describe the treatment of the various constituents and xpstorm will parse this equation and apply it to the simulation. This treatment train can be simulated in all the modes allowing it to represent typical LID (WSUD, SuDS) structures and practices.
Water Quality
Modeling in
Storage Units
Water
Quality
Routing In
Conduits
Quality routing is performed by advection and complete mixing in conduits. Each constituent may be subjected to first order decay during the routing process. The decay of one constituent has no effect on other constituents present.
Routing of quality parameters is performed by using the integrated form of the completely mixed conduit volume. The routing becomes closer to pure advection (plug flow) as the number of conduits is increased.
Water Quality Modeling
xp
storm
’sgraphical environment allows the modeler to create and modify the network interactively on the screen using a mouse and graphic tools. Convenient graphical wizards guide the user through a range of required tasks such as importing data. The internal knowledge-base “intelligently” reviews the input to prevent incorrect or inconsistent network structures or data from being created.xp
storm
also contains a variety of tools to jump-start model building by using data from other previous projects (using templates), other models (“Merge” command) and importing data from external sources such as CAD and GIS files.Network
Creation
xp
storm
has tools for quickly laying out, navigating and annotating networks. Model objects can be constructed on a scaled background with GIS , CAD and aerial photo layers or on a blank screen. The color and size of labels can be adjusted for optimum readability. Single objects or groups of nodes or links can be selected for editing. Specialized objects for river modeling include bridge links and river links that can be digitized or imported from HECRAS.Dialog boxes
xp
storm
has numerous dialog boxes that assist data entry. Schematic diagrams indicate the definition of various parameters. Pop-up screen tool tips provide additional information such as units and field definitions to assist the users.This dialog box displays the Solve feature which calculates and enters the selected dependent variable. For example, knowing the upstream and downstream inverts and the conduit length, the slope is calculated.
XP Tables
Import
XP Tables offers an excellent complement to the dialog-based interface. XP Tables provides views of data and results that can be quickly sorted, edited and copied to or from other applications such as Excel spreadsheets. Filters can also be applied to the table so that only the objects meeting specified criteria are displayed.
Predefined tables can be loaded into any model that organize the data based on object type. Tabs in the lower left hand corner allow quick navigation to a specific table. Model building is enhanced in this spreadsheet style interface allowing quick copy, paste and data entry. Data is checked against reasonable and absolute ranges at this level as if entered in dialogs.
Building Your Model
Layer
Control
Panel
The movable Layer Control panel allows the user to manage the graphical display of the model. The display of layers (model links and nodes, text, topography, DTMs, and background images) may be switched off/on with check boxes. Model layers may also be locked (from editing) or have their selectable attribute switched off/on.
The layer control panel may be moved, resized, hidden or docked. The layers are organized into a tree structure with expandable/collapsible groups.
Right-clicking on the name of any layer launches a popup menu for importing, editing and changing the display properties to that layer. The count of objects [selected/total] is displayed within each layer as well as an indication of the layers selected by changing the font to bold.
Quick
Data
View
The Quick Data View tool displays a user-defined set of input data and results for any link or node in the model. It can also display the attributes for selected objects from a GIS layer. It is effectively a custom dialog that dynamically displays current values of the defined set of parameters.
The view may be docked or moved anywhere on the viewing pane and resized. The display is updated when a new link or node or GIS object is selected. It is an excellent tool for reviewing the model data and results.
Global Data
Global data allows for the management of data that may be referenced from multiple nodes and links. This reduces data redundancy dramatically and the associated problems of updating many locations when changes are made. Examples of global data include rainfall, infiltration, pollutant description, cross sections, dry weather flows and 2D Soil Types. A series of dialog boxes are used to assist editing and assigning global data to the model.The global database can be efficiently loaded by importing or merging models together and by using several supplied template files.
Building Your Model
GIS
Integration
xp
storm
is streamlined to utilize GIS and CAD data for modeling. It has the ability to display raster and vector files as background images from commercial drawing and GIS applications without the purchase of additional software or runtime licenses. With its integrated GIS linkxp
storm
enables you to exchange data with other external databases such as ArcGIS, MapInfo, Asset Management Software, Access and Excel or any other ODBC compliant database.xp
storm
’s layer control panel allows the management of geospatial data sets including visualization and direct import of geometric objects such as polygons, polylines and points to the appropriate layer. The export of links and nodes with object data can be exported to ESRI shape or MapInfo files.Specialized polygon processing that intersects catchment polygons with GIS polygons allows catchment parameters to be derived.
Background
Layers
xp
storm
allows the user to layout the network over a CAD (.DXF or .DWG) drawing or a GIS layer (.SHP or .MIF). The ability to include a background image also includes digital pictures such as .ECW, .BMP, .JPG, .TIF files.Alternatively, schematic network layouts can be created without the objects being georeferenced.
Building Your Model
A right-click launches a pop-up dialog for directly importing/exporting nodes, links, catchments and 2D objects from a GIS file. Attributes in the source file may be mapped to
xp
storm
fields.ESRI shapes files and MapInfo .MIF files may be added to a model as layers. The Quick Data View tool may be used to display the attribute values for selected GIS objects.
Exchanging
data with
EPA SWMM
Existing information may be imported into
xp
storm
from Version 4 through Version 5 EPA SWMM data files. The model can also be solved using the SWMM5 engine and exported to or imported from an EPA SWMM 5 input file. Users can also select XP Solution’s new SWMM5 based engine that includes mostxp
storm
enhancements and capabilities.Text Files
Data may also be imported from an ASCII text file in our proprietary XPX file format. XPX files are free format and use a simple script to allow import of all required data. Comma Separated Values (CSV) files can be included in XPX files to allow import of multiple input variables to a range of objects. This allows the user to create new data and objects as well as update and add to existingxp
storm
networks. Large data sets exceeding 10,000 conduits can be managed easily using XPX files.Network
Navigation
The Network Navigation tool bar contains numerous zoom and pan tools allowing the user to quickly navigate the model. Other icons in the tool strip aid in selecting objects and adding/removing objects from the current mode. The Fit to Window and Regenerate View tools are used to quickly refresh the screen. Very large networks will redraw quickly and look much cleaner without the clutter of object labels. A popup tool tip describes the function of each tool.
GIS
Integration
Building Your Model
Attributes of GIS files used as background images may be color coded to enhance viewing.
The Network Overview panel assists in navigation of large networks.
CAD
Connect
Both .dxf and .dwg CAD files may be added to any model and used as a spatial reference or for importing points, lines and polygons as
xp
storm
model objects. The display of any layer in the CAD file can be toggled on/off. Completed models can be exported as .dxf files. LandXML import/export can also be selected to create DTM and pipe networks from/to many CAD and GIS programs supporting this data standard.Digital Terrain Models
Whether you are modeling in 1 or 2 dimensions, integrating elevation data is an essential step in constructing your model.
xp
storm
incorporates Digital Terrain Models (DTMs) as Triangular Irregular Networks (TINs) into any 1D or 2D model. Our software offers a fast triangulation engine and a comprehensive set of tools that are used to create, import, display elevation data layers, and to derive properties of network elements from the DTM. In cases of very large DEM for 2D models they can be used and not triangulated.The DTM builder constructs a TIN from an x, y, z text file. The “S” column is used to designate break lines. Multiple DTMs can be tiled together.
Additional options include creating a DTM from:
Existing node ground elevations
MapInfo files
ESRI Shape and ASCII Grid files
LandXML filesThe dialog allows for direct editing of points and block copy and paste operations.
DTM Builder
Manage DTM
Layers
DTM Tools
The color scale, transparency and contour line format of the TIN can be adjusted or toggled on/off with the display properties dialog in the Layer Control Panel. Major contour labels can also be displayed with a user defined interval.
Polygons can be drawn and saved to expose the triangulation of the TIN in the plan view.
The elevation of the mouse location is displayed in the status bar.
xp
storm
After the DTM has been incorporated into the model a variety of tools are available to perform such tasks as:
Generating node ground elevations from the DTM
Creating cross section shape files along open channels
Creating cross section profiles along any user defined polyline
Generating node and link inverts
Displaying the 2D Grid elevations in plan and profileRunning
xp
storm
is more than clicking on the calculate button. When usingxp
storm
, the modeler can monitor the calculating engine performance and make adjustments and rerun the calculations. After the simulation a variety of tools assist in calibrating, adjusting designs and producing final report output.Scenarios
The Scenario Manager allows you to create up to 50 scenarios. A scenario can have different model configurations, storms, control strategies or boundary conditions. The modeler can easily analyze the networks performance under different storm events and future development conditions in graphical and tabular formats.Running Your Model
Design
Tools
Several dialogs contain tools for conduit sizing and grading based on design criteria. During a hydraulic simulation the model can be set to automatically upsize conduits based on minimum freeboard or a percentage of full depth. Using a constraint of minimum cover the selected conduits will be upsized and parallel pipes can also be added if necessary to satisfy the desired design criteria. This design routine can be applied globally to all conduits or to selected conduits in a retrofit solution.
Dual Drainage
Conversion
The simulation of parallel major and minor drainage systems (dual drainage) is easily facilitated and visualized in
xp
storm
. The Dual Drainage Batch Conversion Tool automates the conversion of single subsurface conduits to parallel multilinks containing the existing subsurface closed conduit and placing a second open channel at the existing ground. The automation includes making appropriate adjustments to model nodes (manholes) to match the depth of the channel representing street cross sections.Page 22 displays a dual drainage case in the Dynamic Long Section view.
WSPG (Water Surface Profile Gradient) is a hydraulic analysis that computes uniform and non-uniform steady flow water surface profiles and pressure gradients in a network of open channels and closed conduits. This tool, originally developed by Los Angeles County, has been upgraded by XP Solutions and is available as an add-on module to
xp
storm
or as a separate standalone product calledxp
wspg
.Applications include: engineered channel design urban drainage analysis minor hydraulic loss analysis After designing the model using the steady state WSPG solution the model can be switched to a full dynamic analysis in
xp
storm
. This combination of solutions allows the modeler to have confidence that the proposed design maintains the hydraulic grade line to acceptable levels and that storage facilities are sized correctly for major events.WSPG
Proprietary
Dynamic Wave
Routing
xp
storm
uses a proprietary dynamic wave routing procedure. The coupled 1D/2D analysis engine is available in both 32 bit and 64 bit. The solution method is inherently stable and has a fast run time by using a self modifying time step. Throughout the simulation, the time step is adjusted to insure stability and flow balance. There are several techniques available to improve the performance of the calculation engine. Additional simulation parameters allow optimization of the solution. They include:
Global settings for minor losses, flow multipliers, roughness factors
Courant time step factors
User defined fixed and relative tolerances
Minimum time step and conduit length adjustments
Automatic modification of short conduitsFor compatibility with older EPA SWMM models the three Version 4 solutions are also available in
xp
storm
. The SWMM5 engine may be selected from the Mode Properties dialog as an alternative calculation engine.Routing of the flows may also be accomplished using the kinematic and diffusive wave solutions.
Model
Calibration
xp
storm
offers a variety of tools to assist in model calibration. Calculated values of flow, velocity or HGL may be plotted over measured values. XP Tables may be used to make global adjustments to model parameters. Scenarios can be used to show both graphically and in tables the differences resulting from the calibration runs.A comprehensive output file is also created similar to the output in EPA SWMM. This output file is the *.out file and contains all the information on data input and output. The file is organized with a table of contents indicating the most important tables that summarize key model input and output. During scenario runs or when simulating multiple rainfall events with global storms, multiple output files are generated.
Model
Summary
Running Your Model
Basin
Optimization
Your
xp
storm
model can be calculated using the EPA SWMM5 engine or a proprietary based engine based on SWMM5. The latter engine includes most of XP Solutions enhancements to SWMM including numerous hydrologic methods and dual drainage simulation capabilities. The input file (.inp) and output file (.rpt) are generated when these options are invoked. After solvingxp
storm’
s time series graphic result tools are used to display those computed model results.SWMM 5 Engine
Storage nodes representing detention and retention facilities can be optimized for both discharge rates and maximum water elevation.
Four optimizations include:
Resize pipes for maximum water elevation
Limit discharge in downstream pipes
Resize the basin for maximum water elevation
Resize pipes and basin to optimize for storage and limits of downstream discharge controlAfter designing the model using the optimization the solution can be switched to a continuous simulation analysis in
xp
storm
. This continuous simulation can yield statistics for Hydromodification to ensure that pre-development flow statistics are not exceeded with the new pre-development. The model time series can be converted to Cumulative Probability, Percent Exceeding and Flow Duration graphs.Hydro-modification
When a model is calculated, tens of thousands (sometimes millions) of data points are created in the resulting time series.
xp
storm
has tools to organize and present results in a manner that allows the modeler to understand the processes that have been simulated. Utilities accessed from the menus break up rainfall and pollutant time series into events and rank those events. In addition,
xp
storm
has numerous tools for producing professional quality graphics and exporting text and graphics to other software packages.
XP Tables
The XP Tables tool will generate customized tables of both input data and results organized in a workbook. Multiple tables are displayed as separate worksheets and a tab in the lower left hand corner allows easy navigation. Tables may be easily formatted by font, color, alignment and numeric format. Data can be sorted, filtered or displayed in alternative units. User defined variables can be generated using mathematical operators, constants and existing columns in the table. Tables may be easily exported as text files or to publishing software as well.Tables can be used in the model building process by copy and pasting common data from within the tables or other databases. In a model review process objects can be selected in the table then highlighted in the network window with a simple click on an icon. The results from global storms and scenarios can be compared in the tables.
Graphs
Graphs of model results may be displayed for any single or multiple objects in the network with anywhere from 1 to 16 graphs displayed on a single page. The scales, series symbols, grids and fonts of these graphs can be easily adjusted to meet publication requirements. Parameters that may be graphed include:
Flow, Velocity
Infiltration, Evaporation
Rainfall excess
Snowmelt
Groundwater stage, Flow
Soil moisture
HGL and EGL
Cumulative Overflow
Measured Flows, Levels
System Storage
Cumulative Probability
Percent Exceeding
Duration Curves
Viewing and Reporting Results
Dynamic Plan
Plotting
The results may also be replayed on the plan view with the size and color of the nodes and links changing to reflect changes in the Flow, Velocity and Depth during the simulation period. Instantaneous direction of flow is also indicated and flooded nodes turn red and display water mark symbols for the duration of flooding.
Scaled plan drawings, including the base map of information, may be generated and output to DXF files, printers and plotters.
Dynamic
Section
Views
Animations
Model results for the entire simulation period may be viewed in any profile, plan or section view. The display of the animation is controlled by a set of DVR like buttons located at the bottom left of the GUI. At any time step the animation may be printed or exported as a graphic file. In the case of 2D animations the user can create .AVI videos of the network plan view to share with other stakeholders.The results may also be replayed on a multi-panel view presenting a profile, cross sections and hydrographs. Dynamic Sections can be constructed for a single link or contiguous segment of the network.
The panels in this view can be maximized, formatted, printed and exported for report generation.
Viewing and Reporting Results
1D Flood
Maps
Dynamic
Long
Section
Viewing and Reporting Results
A long section or profile for any contiguous segment of the network may be selected for animation of the HGL. The profile displays pipe, manhole geometry, maximum water levels and HGL over the course of the simulation. XP Tables can also be shown in conjunction with this view allowing data editing and results query. Multiple conduits can be shown when dual drainage is being modeled.
Using the node water elevations and interpolating along the link the software will create a 1D flood map. This map is created by intersecting the interpolated water elevations with the digital terrain model. The resulting differences in elevation are1D Flood depths and they are shown in plan view as color shading and with depth contours.
Stakeholder
Model
Sharing
The
xp
viewer
program allows data files to be opened and viewed but not modified. Thexp
viewer
Reader software and your model may be freely distributed to anyone associated with your project. Recipients will have the ability to view and generate all model output including animations of your encryptedxp
storm
models without the ability to change the model integrity or rerunning the simulation.This is an excellent add-on tool for those customers who need to share their data with other stakeholders and reviewers who do not own a license of the software, but wish to view the model data and results.
xp
viewer
Reader is available from XP Solutions at no cost and the encryption ability within an existingxp
storm
license as available as an add-on module. XP Solutions also offers fee based model encryption services.Viewing and Reporting Results
Spatial
Reports
Spatial reports of model data and simulation results can be shown onscreen in the GUI. A box, bracket or drop shadow attached to the link or node will show items such as the peak flow and conduit diameter (selected from several hundred available fields). Model results may also be shown in conjunction with thematic plotting or graphical encoding in which the color and size of the links and nodes is dependent on the model data or results.
Graphical
Encoding
Also called thematic viewing or plotting, this tool allows variables (or themes) to be displayed using graphical entities of objects. Currently six entities are supported, three for both links and nodes. These are; Color, Size or Width, and Text Label Size. The variables (or themes) include input data and calculated results.
Minimum Recommended
Processor Pentium Multi Core (i5, i7)
RAM 512 MB 8 –16 GB
Operating System Windows XP, 7 & 8 - 32 & 64 bit Windows 7 or 8 - 32 or 64 bit
Hard disk 50 GB 100+ GB Solid State Hard Drive
Display 1024 x 768 24 bit color 1920 x 1200 32 bit color
Video Card
64 MB ram
Vertex shader version 1.0 or greater Pixel shader version 1.4 or greater DirectX 9.0
1 GB ram
Vertex shader version 1.0 or greater Pixel shader version 2.0 or greater DirectX 9.0
XP Solutions offers the ability to run
xp
storm
programs over a Local Area Network. This enhanced functionality provides you with a network hardware lock which enables any user on your network to run the program from their workstation without the tedium of sharing a hardware key for the program. Alternatively, using the stand-alone hardware lock that is provided with your license the software can be installed on multiple workstations. Your users will be able to access the program according to who has possession of the hardware lock. Wide area network licensing options are also available to organizations meeting minimum license criteria.Network
Capabilities
xp
storm
is designed to work on your desktop PC. Requirements for computer power are dependent on the size and complexity of your model, length of simulation, time and other control settings. The following table should be used as a guide.System Requirements
Support &
Training
xp
ertcare
for 12 months is included in the purchase price.xp
ertcare
includes the following: unlimited technical support, regular updates, annual upgrades and a 1-hour online model consultation.Each installation is shipped with a copy of our Getting Started Manual and electronic reference manual. Our workshop notes which are a more comprehensive set of step by step instructions is also available for purchase. XP Solutions presents an on-going training program of workshops (at locations around the world, on-site, and on-line training). Training can be customized for any user.
XP Solutions also presents a series of public educational webinars related to water resources modeling. Scheduled and recorded events are made available at http://xpsolutions.com/Resources/XP-Live-Webinars.do.
xp
storm
XP Solutions Americas
5415 SW Westgate Drive, Suite 150 Portland, Oregon 97221
United States Tel: +1 888 554 5022 Fax: +1 888 554 5122 Email: [email protected]
XP Solutions Asia Pacific
Locked Bag 4006 Fortitude Valley, QLD 4006 Australia Tel: +61 (07) 3310 2302 Fax: +61 (07) 3369 9722 Email: [email protected] XP Solutions EMEA
Jacobs Well, West Street Newbury, Berkshire, RG14 1BD United Kingdom Tel: +44 (0) 1635 582 555 Fax: +44 (0) 1635 582 131 Email: [email protected]