Worcester Polytechnic Institute
Digital WPI
Masters Theses (All Theses, All Years)
Electronic Theses and Dissertations
2016-04-14
Student Modeling From Different Aspects
Yan Wang
Worcester Polytechnic Institute
Follow this and additional works at:
https://digitalcommons.wpi.edu/etd-theses
This thesis is brought to you for free and open access byDigital WPI. It has been accepted for inclusion in Masters Theses (All Theses, All Years) by an authorized administrator of Digital WPI. For more information, please [email protected].
Repository Citation
Wang, Yan, "Student Modeling From Different Aspects" (2016).Masters Theses (All Theses, All Years). 205. https://digitalcommons.wpi.edu/etd-theses/205
STUDENT MODELING FROM DIFFERENT ASPECTS
by
Yan Wang
A Thesis
Submitted to the Faculty
of the
WORCESTER POLYTECHNIC INSTITUTE
in partial fulfillment of the requirements for the
Degree of Master of Science
in
Computer Science
April 2016
APPROVED:
______________________ ______________________
Dr. Neil T. Heffernan
Dr. Joseph E. Beck
Contents
Abstract
... 1
Students vs. Skills: Partitioning Variance Explained in Learner Models
... 2
The Opportunity Count Model: A Flexible Approach to Modeling Student Performance
... 10
Enhancing the Efficiency and Reliability of Group Differentiation through Partial Credit
... 17
Partial Credit Revisited: Enhancing the Efficiency and Reliability of Group Differentiation at
Scale
... 22
How Long Must We Spin Our Wheels? Analysis of Student Time and Classifier Inaccuracy
... 32
Defining Mastery: Knowledge Tracing Versus N- Consecutive Correct Responses
... 39
Improving Students’ Long-Term Retention Performance: A Study on Personalized Retention
Schedules
... 47
The Assessment of Learning Infrastructure (ALI): The Theory, Practice, and Scalability of
Automated Assessment
... 52
1
Abstract
With the wide usage of online tutoring systems, researchers become interested in mining data from logged files of
these systems, so as to get better understanding of students. Varieties of aspects of students’ learning have become
focus of studies, such as modeling students’ mastery status and affects. On the other hand, Randomized
Controlled Trial (RCT), which is an unbiased method for getting insights of education, finds its way in Intelligent
Tutoring System. Firstly, people are curious about what kind of settings would work better. Secondly, such a
tutoring system, with lots of students and teachers using it, provides an opportunity for building a RCT
infrastructure underlying the system. With the increasing interest in Data mining and RCTs, the thesis focuses on
these two aspects. In the first part, we focus on analyzing and mining data from ASSISTments, an online tutoring
system run by a team in Worcester Polytechnic Institute. Through the data, we try to answer several questions
from different aspects of students learning. The first question we try to answer is what matters more to student
modeling, skill information or student information. The second question is whether it is necessary to model
students’ learning at different opportunity count. The third question is about the benefits of using partial credit,
rather than binary credit as measurement of students’ learning in RCTs. The fourth question focuses on the
amount that students spent Wheel Spinning in the tutoring system. The fifth questions studies the tradeoff
between the mastery threshold and the time spent in the tutoring system. By answering the five questions, we both
propose machine learning methodology that can be applied in educational data mining, and present findings from
analyzing and mining the data. In the second part, we focused on RCTs within ASSISTments. Firstly, we looked
at a pilot study of reassessment and relearning, which suggested a better system setting to improve students’
robust learning. Secondly, we proposed the idea to build an infrastructure of learning within ASSISTments, which
provides the opportunities to improve the whole educational environment.
2
Students vs. Skills:
Partitioning Variance Explained in Learner Models
Joseph Beck, Korinn Ostrow, Yan Wang
Worcester Polytechnic Institute Worcester, MA 01609
{josephbeck, ksostrow, ywang14 } @wpi.edu
This section has been submitted to:
Beck, J., Ostrow, K. & Wang, Y. (2016) Students vs. Skills: Partitioning Variance Explained in Learner Models. The 9th
International Conference on Educational Data Mining. ACM
ABSTRACT
Learner modeling is a significant tool within the Educational Data Mining (EDM) community that can drive system implementation and learner analytics. Students and skills are often modeled together, and yet the proportion of variance attributed to each is typically overlooked. The present work examines how student and skill variance are partitioned across large-scale datasets from three popular learning platforms while considering four popular constructs for learner modeling. Results suggest that variance attribution is largely system and construct specific. Further, findings suggest that many researchers in the EDM community are working in an overly complex portion of the space by modeling next item correctness. These novel observations offer a strong contribution to the field. Limitations and future work are also discussed.
Keywords
Learner modeling, student variance, skill variance, ASSISTments, Cognitive Tutor, Andes, next item correctness, first item correctness, mastery speed, wheel-spinning.
INTRODUCTION
Learner Modeling
Student and skill modeling are primary focuses within the Educational Data Mining (EDM) community that have shifted from tools for the development of learning technologies to features driving adaptive tutors in real time [9]. Learner modeling allows designers of educational technologies to fine-tune learning materials, reform skill compositions, and predict student skill mastery to guide adaptive content provision. Despite persistent attempts to strengthen learner models, the majority of methods for guiding student and skill models have remained largely stagnant. For instance, one of the most popular forms of student modeling, Bayesian Knowledge Tracing (BKT), was conceived over 20 years ago to predict skill mastery using four parameters per skill [8]. By considering the probability of prior knowledge alongside probabilities at each skill opportunity for slip, guess, and learning, knowledge tracing calculates the likelihood of skill mastery with a swift and generally accurate quaintness that has sustained the test of time [9]. Still, researchers have shown that individualizing BKT in an attempt to account for student or skill variance can produce more robust models with predictions that are more generalizable to unseen students or skills [17; 23; 24]. This leaves researchers questioning what portion of the variance explained by their models can be attributed to individualized parameters.
Learner models are also versatile in terms of constructs of interest. Arguably the most common construct for the prediction of skill mastery, next item correctness drives models like Knowledge Tracing and (in a sense) Performance Factors Analysis [9]. However, researchers have also modeled student performance by predicting first item correctness, or an estimate of prior knowledge [6], mastery speed, or the number of skill opportunities required to reliably learn a skill [23], and wheel-spinning, or a state of perpetual struggle within skill acquisition [4]. Numerous constructs can be considered when examining variance within learner models.
Partitioning the Variance
It is typical for modeling approaches to be compared against one-another within the same dataset to examine effectiveness in predicting outcomes. However, the present work was inspired by a question posed by Ken Koedinger during a conference presentation meant to explain a model of wheel-spinning within ASSISTments: “What portion of the variance was due to the student and what portion was due to the skill?” [10]. It is true that learner models are often comprised of both student variance and skill variance, yet few researchers have taken a broad enough stance to examine how these sources of variance are partitioned within datasets [15]. Further still, no one (to the best of our knowledge) has yet pushed the boundary to examine trends in student and skill variance across systems, skill domains, modeling constructs, or longitudinally within systems. Just as Brahe and Kepler would have had far more difficulty discovering heliocentric orbits without the printing press that expanded access to astronomical tables [14], educational technologies had to reach a particular scale before student and skill variance could be compared across platforms and constructs.
The present work seeks to partition the variance across systems and predictive constructs. Specifically, the following research questions guide this work:
1. How much variance across systems and constructs can be attributed to differences between students?
2. How much variance across systems and constructs can be attributed to differences between skills?
3. Within systems, how do student and skill variability change over time?
The following sections detail three popular tutoring systems that are commonly used for learner modeling, as well as four constructs that are common resources within the field. Then, remaining sections highlight the methods used in the present
3 work, results observed and their potential implications, limitations of our approach, suggestions for future work, and the overall contribution of this work to the EDM community.
SYSTEMS & CONSTRUCTS
Systems of Interest
The present work highlights three tutoring systems that produce datasets commonly used for student modeling. These systems cover different domains, reach qualitatively different student populations, and were designed using different protocols. The following subsections briefly describe each system and specify the datasets analyzed herein.
ASSISTments
ASSISTments is an online learning platform focused primarily on middle school mathematics and used by more than 50,000 students around the world. The system aims to provide students with assistance and teachers with assessment within a variety of assignments mapped to the Common Core State Standards and popular mathematics textbooks [11]. As students work through classwork and homework, ASSISTments logs student performance that can be used to construct student models. The most common type of assignment within ASSISTments is the Skill Builder, a skill driven mastery-based problem set. Students must complete a series of problems randomly selected from a skill pool until meeting a predefined threshold for skill mastery (i.e., the system default requires that students accurately answer three consecutive problems). The ASSISTments dataset considered herein is comprised of all data available from Skill Builders spanning five academic years (2009-2014). As shown in Table 1, this dataset contained performance details on almost 6.5M problems representative of 54,570 students and 645 skills. This dataset was accessed by querying the ASSISTments database and has been made publicly available at [22].
Cognitive Tutor - Algebra 1
Cognitive Tutors are a series of commercialized tutoring systems distributed by Carnegie Learning for students in grades 9-12 [7]. These systems are built around the ACT-R theory of cognition, allowing each system to enlist humanistic problem solving techniques and compare automated solution steps against student solutions to provide appropriate feedback and assistance [2; 18]. Cognitive Tutors are developed as a part of broader curriculum reform, with courses spanning mathematics and language domains [20; 7]. As students work through units and fluency challenges within modules, the tutor logs details on student performance useful for constructing student models.
The Cognitive Tutor dataset used in the present work is composed of data from the Algebra 1 Course and was promoted as the Knowledge Discovery and Data Mining (KDD) Cup dataset in 2010 [12]. This dataset spans two academic years (2005-2007), with over 2.5M problems completed by 1,857 students working within 445 Algebra skills (see Table 1). This dataset was retrieved from the PSLC DataShop [19] where it was split by academic year. Given its breadth, Cognitive Tutor surely houses far larger datasets, but they are not readily available in the PSLC DataShop.
Andes2 Physics
The Andes Physics tutoring system was created as a minimally invasive web-based homework tool for college students at the U.S. Naval Academy [20]. The platform was intended to supplement existing curriculum by replacing pencil and paper homework when solving physics problems. Andes provides feedback following each step within the derivation of a single problem; a far more finite granularity than the other systems considered herein [20]. The rule-based cognitive modeling behind Andes stemmed from the Cascade and Olae projects, with additions to incorporate immediate feedback and various types of tutoring assistance meant to guide students’ reasoning while problem solving [20]. As students work through
Table 1. Descriptive statistics across systems years
Students Skills
Student-Skill
Pairs
Problem
Logs
Problems Per
Student
Problems Per
Skill
AS 2009-2010 2,028 104 25,263 265,821 131 2,556 AS 2010-2011 7,317 130 89,525 931,798 127 7,168 AS 2011-2012 14,971 131 186,352 1,815,054 121 13,855 AS 2012-2013 15,400 139 203,271 1,624,007 105 11,684 AS 2013-2014 14,854 141 219,024 1,824,295 123 12,938 ASSISTments Totals/Ave 54,570 645 723,435 6,460,975 121.4 9,640.2 CT-A 2005-2006 559 106 20,622 879,561 1,573 8,298 CT-A 2006-2007 1,298 339 78,991 1,828,055 1,408 5,392Cognitive Tutor Totals/Ave 1,857 445 99,613 2,707,616 1,490.5 6,845.0
Andes2 – Fall 2005 76 150 7,589 118,822 1,563 792
Andes2 – Fall 2006 66 157 7,142 119,196 1,806 759
Andes2 – Fall 2007 79 143 4,851 73,744 933 516
Andes2 – Fall 2008 64 99 3,585 36,532 571 369
Andes2 – Fall 2009 63 88 2,274 23,840 378 271
Andes2 – Fall Totals/Ave 348 637 25,441 372,134 1,050.2 541.4
Andes2 – Spring 2005 72 128 6,117 59,834 831 467 Andes2 – Spring 2006 71 144 7,162 82,923 1,168 576 Andes2 – Spring 2007 93 120 6,362 58,212 626 485 Andes2 – Spring 2008 42 34 903 22,588 538 664 Andes2 – Spring 2009 71 108 4038 38,001 535 352 Andes2 Totals/Ave 349 534 24,582 261,558 739.6 508.8
Note. System totals do not represent unique students or skills, as overlap is possible across years. Assumptions of independence do not apply. Averages are presented for total Problems Per Student and Problems Per Skill.
4 homework problems within Andes, performance details are primarily collected to assist professors in grading, but also prove useful for student modeling.
Specifically, the dataset used in the present work was collected from Andes2, the second iteration of the platform, and spans five academic years (2005-2009). This data was retrieved from the PSLC DataShop [19], where it was split by academic semester. The full dataset included over half a million problems solved by 650 students spanning 1,044 skills, as shown in Table 1. For the analyses presented herein, the academic semester split was retained across years as variance attributed to students differed greatly across semesters, suggesting wualitative differences between semesters. Although the Andes dataset had far fewer students in comparison to the ASSISTments and Cognitive Tutor datasets, it is included because the sample sizes were large enough to support the modeling approach used without over fitting the data. Few parameters were necessary to partition student and skill variance, and cross validation was employed for reliability (see Section 3.2).
Constructs of Interest
While considering the distribution of student and skill variance across datasets from three qualitatively different platforms, it was also of interest to define these distributions across numerous constructs that are commonly used in learner models. The following subsections highlight the constructs examined herein.
First Item Correctness
Models focused on first item correctness seek to isolate what students know when they first sit down to complete an assignment, or essentially, the prior knowledge they bring to a skill. Recent research has examined the prediction of first item correctness, or initial knowledge, within BKT to enhance the individualization of learner modeling [17; 6]. Models have also been constructed using first item correctness to examine the influence of prerequisite performance, or initial skill knowledge, on wheel-spinning [21]. Determining the knowledge a student brings to the table can be critical for predicting whether he or she will succeed in mastering a skill.
Within the present analyses, first item correctness is traditionally defined as the prediction of whether or not a student will accurately solve the first item within a given skill.
Next Item Correctness
Models focused on next item correctness seek to predict what students will come to know as they progress through an assignment, or essentially, whether they ultimately learn a skill. Next item correctness is one of the most popular constructs in the field, as determining whether a student will answer the next item accurately is key in predicting precisely when a student will master a given skill. Knowledge Tracing relies largely on predictions of next item correctness [8], and other common learner models like Performance Factors Analysis consider the accuracy of sequential skill items in a similar nature [9]. Leaders within the field have long argued that predicting skill mastery or overall performance is impossible without tracking a student’s performance at item-level [2].
Within the present analyses, next item correctness is traditionally defined as a prediction of whether or not a student will accurately solve the next item opportunity within a given skill, considering their performance on previous items.
Mastery Speed
Models focused on mastery speed seek to gain insights from how quickly students learn or master a skill by considering the number of skill opportunities or problems that a student receives [23]. Some systems define skill mastery using predictive models while others define mastery through consecutive, n right-in-a-row, problems solved. In some senses, being able to predict when a student will master a skill, or how much additional practice would be necessary to reach mastery, can be as helpful as incremental predictions of next item correctness.
Within the present analyses, mastery speed is defined across all platforms (regardless of their internal definitions of mastery) as accurate responses to three consecutive questions. Although this approach is simple, it is easy to replicate and produces results similar to skill mastery as defined by Knowledge Tracing (P(T) = 0.95). Prior work has shown that within the context of ASSISTments Skill Builder data, similar predictions for mastery can be obtained from KT to those observed using the system’s default approach requiring correct answers on three consecutive skill items. Comparing predictions of next item correctness for a transfer item of greater difficulty, when guess rate was low (<0.1) and slip rate was low (<0.3), three consecutive items reached the 95% threshold of KT [13]. Knowledge Tracing also presents an identifiability issue that results in models with equivalent statistical fit but mixed predictions of student knowledge [3]. This issue can be avoided by defining mastery by a series of accurate responses to consecutive skill items.
Wheel-Spinning
Models focused on wheel-spinning seek to determine whether struggling students will eventually master a skill, even when they may fail to initially master or master in a timely manner [4]. The mastery-based learning approach to skill acquisition that is taken by most Intelligent Tutoring Systems and online learning platforms may be too strict for students that are not capable of reaching proficiency, especially considering potential variation in content difficulty. Recent models have predicted whether or not students will wheel-spin by considering the student’s performance on prerequisite skills, or essentially, a measure of their prior knowledge [21].
Within the present analyses, wheel-spinning is defined as it was presented in [4]: failure to attain skill mastery following ten item opportunities within a given skill.
METHODS
Data Preprocessing
The datasets were retrieved and the constructs were isolated, as described in previous sections. Datasets from all three systems included information that would allow for the modeling of first item correctness, next item correctness, mastery speed, and wheel-spinning. Each dataset required preprocessing to format universal constructs for modeling. First, the data was filtered to include only skills with performance information from at least ten students. The data was then filtered to include only students that had worked on at least three skills. Additionally, data was filtered such that only student/skill pairs with at least three item opportunities were included. The intuition behind this filtration process was to
5
Table 2. The process for calculating student and skill covariates Student ID Skill ID Opportunity Order Correct Student Covariate Skill Covariate 1 A 1 0 0.75 0.25 1 A 2 1 0.75 0.25 1 B 1 1 0.75 0.75 1 B 2 1 0.75 0.75 2 A 1 0 0.25 0.25 2 A 2 0 0.25 0.25 2 B 1 0 0.25 0.75 2 B 2 1 0.25 0.75
Note. A covariate is calculated per student given the overall average accuracy across skills and item opportunities (i.e., Student 1 scores 0 + 1 + 1 + 1 = 0.75). A second covariate is calculated per skill given average accuracy across all item opportunities by all students (i.e., Skill A has accuracy of 0 + 1 + 0 + 0 = 0.25).
arrive at a subset of data for each system that was robust enough to model the proportions of skill and student variance. Rather than applying a complex algorithm, this simple iterative filtering process ensured enough data for each skill and for each student. Further, within the ASSISTments dataset, tutoring problems (i.e., Scaffolds) were excluded as to only retain primary skill item opportunities. This issue was not apparent in the Cognitive Tutor or Andes2 datasets. All resulting datasets and the filtration code are available at [22] for further reference.
Following filtration, it was necessary to develop weighted covariates for student and skill to help partition the variance attributed to each predictor. These covariates were calculated using identifiers for the student and the skill, the number of items and their opportunity order, and the item’s accuracy, as shown in Table 2. To process the student covariate, accuracy was averaged across all problems that the student answered, regardless of skill. For example, in Table 2, Student 1 answered four items spanning two skills, with an average overall accuracy of 0.75. Student 2 also answered four items spanning two skills, but her average accuracy was 0.25. The student covariate provides insight into overall student performance, regardless of skill, or essentially a student-level characteristic inherent to ability. To process the skill covariate, a similar approach was taken using skill as the unit of analysis. For example, in Table 2, both students solved two items pertaining to Skill A. Looking across students, the average accuracy on Skill A items was 0.25. Both students also solved two items pertaining to Skill B, which carried an average accuracy of 0.75. The skill covariate provides insight into overall skill difficulty, as experienced by all students.
Modeling Approach
The modeling approach presented herein is simple in nature, with a focus on how student and skill variance are partitioned across systems and constructs. Linear or Logistic Regression models were constructed (for continuous and binary constructs, respectively) to predict the constructs of interest while examining R2 as a core metric for variance explained. For example, as shown in the logit equation (2) and resulting probability equation (3) below, a Logistic Regression model was built to predict the probability of next item correctness (Y), with student and skill covariates (X) as independent variables.
Linear Regression: 𝑌̂ = 𝛼 + 𝛽𝑋 (1) Logistic Regression: 𝑙𝑜𝑔𝑖𝑡(𝑌) = ln (1−𝜋𝜋 ) = 𝛼 + 𝛽𝑋 (2) 𝑃𝑟𝑜𝑏𝑌= 𝑒 𝛼+ 𝛽𝑥 1+𝑒𝛼+ 𝛽𝑥 (3)
Table 3. Correlations of constructs across systems First Item Next Item Mastery Speed Wheel-Spinning
ASSISTments First Item 1.0 Next Item 0.28 1.0 Mastery Speed -0.43 -0.33 1.0 Wheel-Spinning -0.29 -0.32 0.78 1.0 Cognitive Tutor First Item 1.0 Next Item 0.17 1.0 Mastery Speed -0.46 -0.22 1.0 Wheel-Spinning -0.28 -0.22 0.79 1.0 Andes2 - Fall First Item 1.0 Next Item 0.27 1.0 Mastery Speed -0.45 -0.21 1.0 Wheel-Spinning -0.32 -0.31 0.73 1.0 Andes2 - Spring First Item 1.0 Next Item 0.27 1.0 Mastery Speed -0.46 -0.24 1.0 Wheel-Spinning -0.31 -0.30 0.71 1.0
The model also included inherent error, 𝛼. This model was run once while considering only the student covariate, again while considering only the skill covariate, and a final time considering the compound effect of student + skill. Through this approach, resulting R2 values can be interpreted as variance explained by the variable(s) included in each model. Within the iterations of Linear and Logistic Regression models, and regardless of the covariate or construct being modeled, ten-fold cross validation based on student-skill pairs was used to promote robust outcomes. These models were not designed to examine the error inherent to resulting predictions, but simply to gauge the overall variance explained by variables within the model.
RESULTS
Correlations of Constructs
Prior to running the necessary Linear and Logistic Regressions across systems and constructs, it was first of interest to briefly examine the correlations between constructs within systems. Correlations are presented in Table 3, showing relatively stable trends in the relationships between constructs across platforms. The values presented are the average of Pearson’s r correlations collected from each academic year within each system (e.g., 5 years for ASSISTments, 2 years for Cognitive Tutor, and 5 years split by semester for Andes2). In order to collect these correlations, first item correctness, mastery speed, and wheel-spinning (logged at the level of student/skill pairs) were replicated across each item as necessary, such that the number of items represented, n, was stable across constructs. While most correlations were mild (all were significant prior to averaging across years), mastery speed and wheel-spinning maintained a strong positive correlation across platforms, suggesting that the nature of this relationship is linked to how these constructs are defined. Given this strong correlation, variance explained should look similar within these constructs across systems.
Variance Explained
After examining correlations amongst constructs within systems, the Linear and Logistic Regressions were modeled with cross-validation employed. Immediate results were intriguing, as to our knowledge, partitioning the variance within learner models across systems and constructs is a novel task.
6
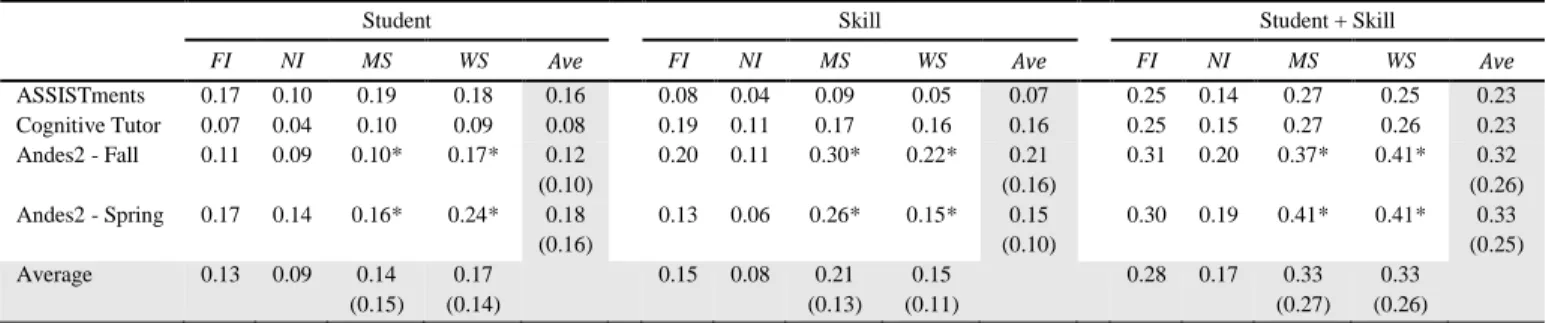
Table 4. Variance explained (R2) by Student, Skill, and Student + Skill across systems and constructs
Student Skill Student + Skill
FI NI MS WS Ave FI NI MS WS Ave FI NI MS WS Ave
ASSISTments 0.17 0.10 0.19 0.18 0.16 0.08 0.04 0.09 0.05 0.07 0.25 0.14 0.27 0.25 0.23 Cognitive Tutor 0.07 0.04 0.10 0.09 0.08 0.19 0.11 0.17 0.16 0.16 0.25 0.15 0.27 0.26 0.23 Andes2 - Fall 0.11 0.09 0.10* 0.17* 0.12 (0.10) 0.20 0.11 0.30* 0.22* 0.21 (0.16) 0.31 0.20 0.37* 0.41* 0.32 (0.26) Andes2 - Spring 0.17 0.14 0.16* 0.24* 0.18 (0.16) 0.13 0.06 0.26* 0.15* 0.15 (0.10) 0.30 0.19 0.41* 0.41* 0.33 (0.25) Average 0.13 0.09 0.14 (0.15) 0.17 (0.14) 0.15 0.08 0.21 (0.13) 0.15 (0.11) 0.28 0.17 0.33 (0.27) 0.33 (0.26)
Note. FI = First Item Correctness, NI = Next Item Correctness, MS = Mastery Speed, WS = Wheel-Spinning. Averages are provided for each system across constructs, and for each construct across systems. *As Andes2 was found to be a qualitatively different system in which measures of mastery speed and wheel-spinning were less reliable, averages are corrected to include only ASSISTments and Cognitive Tutor and presented in parentheses.
Student Variance
The proportion of variance in each model that could be attributed to students differed considerably across systems and constructs. Results are depicted in the Student section of Table 4. Further investigation shows that when modeling first item correctness, student characteristics explained anywhere from 7% to 17% of variance in models across systems (M = 0.13, SD = 0.05). Considering next item correctness, student characteristics explained between 4% and 14% of variance in models across systems (M = 0.09, SD = 0.04). When examining mastery speed, between 10% and 19% of variance in models across systems was attributed to students (M = 0.14, SD = 0.05). Finally, wheel-spinning was more reliant on student characteristics yet showed greater variability across systems, with between 9% and 24% of variance attributed to students (M = 0.17, SD = 0.06).
Skill Variance
The proportion of variance in each model that could be attributed to skills also differed considerably across systems and constructs. Results are depicted in the Skill section of Table 4. When modeling first item correctness, skill explained anywhere from 8% to 20% of variance in models across systems (M = 0.15, SD = 0.06). When examining next item correctness, skill showed less variability across systems, explaining between 4% and 11% of the variance in models (M = 0.08, SD = 0.04). Alternatively, skill was exceptionally variable when examining mastery speed, explaining between 9% and 30% of variance in models across systems (M = 0.21, SD = 0.14). The variance explained by skill was also highly variable in wheel-spinning, with between 5% and 22% of variance attributed to skill (M = 0.15, SD = 0.07).
Student + Skill Variance
Briefly examining the compound effects of student and skill, variance explained was not always strictly summative when these covariates were modeled together. Referring to Table 4, within ASSISTments, student explained 10% of the variance when used to model next item correctness alone, while skill explained 4% of the variance when used to model the same construct alone. When taken together, student and skill did come together in perfect summation to explained 14% of the variance in the model. However, when modeling the construct of wheel-spinning within Andes2 - Spring, student alone explained 24% of the variance and skill alone explained 15% of the variance, and yet together they explain 41% of the variance in the model (gaining strength by 2%, perhaps through a moderating latent construct).
Findings Across Systems
Overall, student and skill were equally informative in terms of average variance explained. However, trends in the attribution of variance were impressively different across constructs and
systems. Considering averages across constructs but within systems is perhaps more crucial to the field. On average within ASSISTments, a greater proportion of variance was attributed to student (M = 0.16, SD = 0.04), while skill was about half as powerful in terms of variance explained (M = 0.07, SD = 0.02). The Cognitive Tutor data actually showed the reverse. On average, a greater proportion of variance was attributed to skill (M = 0.16, SD = 0.03), while student was about half as powerful in terms of variance explained (M = 0.08, SD = 0.03). Oddly, this flip also occurred within the Andes2 system, with skill claiming a greater portion of the variance explained on average in the Fall (M = 0.21, SD = 0.08), and student explaining a greater proportion of the variance explained on average in the Spring (M= 0.18, SD = 0.04).
Findings Across Constructs
Across constructs, next item correctness is perhaps the most popular for learner models and yet appeared to be the most difficult to predict. While student and skill were fairly well balanced in importance, only 9% of the variance (on average) in next item correctness was explained by student, and only an additional 8% (on average) was explained by skill. Other constructs carried more accurate predictions. Models of first item correctness attributed 13% of variance to student and 15% to skill, while models of mastery speed and wheel-spinning also carried high proportions of variance explained by both student and skill, as shown in Table 4. Skill held more variance in these constructs, suggesting they may also provide avenues for driving instructional interventions to improve modeling outcomes through curriculum design.
A Deeper Look into Andes2
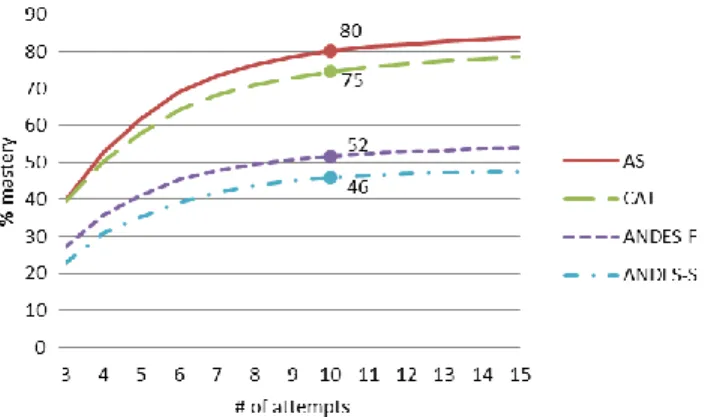
Additional tests were run to examine why Andes2 (Fall and Spring) resulted in impressively different R2 values for the constructs of mastery speed and wheel-spinning, as shown in Table 4. It was thought that perhaps the issue was linked to the definition of mastery used here (i.e., accurate responses on three consecutive skill items). As such, the percentage of students reaching mastery within 15 attempts was graphed in Figure 1, a classic wheel-spinning curve. Results suggested that students within Andes2 were only mastering at chance levels by 10 attempts (i.e., 52% mastery in the Fall, 46% mastery in the Spring). In comparison, 80% of students within ASSISTments and 75% of students within Cognitive Tutor were mastering by the 10th attempt.
In an attempt to reduce the mastery skew effecting Andes2, the threshold for mastery was lowered to require accurate responses on only two consecutive skill items. As shown in Figure 2, although gains in mastery were observed across systems, the
7
Figure 1. Trends in the percentage of students that master when mastery is defined as 3 consecutive correct responses
Figure 2. Trends in the percentage of students that master when mastery is defined as 2 consecutive correct responses
percentage of mastery for students working within Andes2 (Fall or Spring) was still below 70%. As it was not logical to reduce the requirement for mastery to accuracy on a single item, Andes2 was simply labeled as a qualitatively different system and it was redacted from amended analyses for mastery speed and wheel-spinning. As such, both original and adjusted averages for these constructs and for the Andes2 system(s) are presented in Table 4.
Variability in Variance Over Time
The final research question guiding the present work was to examine the variability of student and skill variance within systems over time. The longitudinal trends shown in Table 5 are novel in that (to the best of our knowledge) variance for these systems has never been examined longitudinally at such a fine granularity. Findings suggest that the variance explained by models tailored to correctness metrics varies widely across systems, proportional to the distance from predictions of chance accuracy (50% correctness).
On average, most constructs actually grow more difficult to model in both ASSISTments and Cognitive Tutor with each passing year. For instance, when modeling next item correctness in ASSISTments, researchers were able to explain 16% of the variance using both student and skill variables in the 2009-2010 academic year, but this value dropped to only 10% explained in 2013-2014. Similar trends exist for models predicting first item correctness (dropping 11%), for models predicting mastery speed (dropping 5%), and for models predicting wheel-spinning (dropping 12%). Specifically, drops in variance explained could be largely attributed to student across constructs, as shown in Table 5. Although trends were flipped for Cognitive Tutor, in that more variance could be attributed to skill than to student, the longitudinal decline remains. For both systems, the data suggests that something within system modernization has made learner modeling more difficult.
Despite discovering potential issues with using the Andes2 datasets for traditional learner modeling, longitudinal data for both semesters is presented in Table 5 for reference. The system showed no clear longitudinal trends in the variability of student or skill variance across constructs.
Table 5. Longitudinal trends of variance explained (R2) by Student, Skill, and Student + Skill across systems and constructs
Student Skill Student + Skill
FI NI MS WS FI NI MS WS FI NI MS WS AS 2009-2010 0.22 0.13 0.22 0.25 0.11 0.05 0.10 0.06 0.32 0.16 0.30 0.32 AS 2010-2011 0.17 0.11 0.19 0.18 0.09 0.05 0.10 0.06 0.25 0.15 0.28 0.28 AS 2011-2012 0.17 0.13 0.19 0.19 0.07 0.04 0.08 0.05 0.23 0.16 0.27 0.25 AS 2012-2013 0.14 0.08 0.17 0.15 0.08 0.04 0.09 0.05 0.21 0.11 0.25 0.21 AS 2013-2014 0.14 0.07 0.17 0.13 0.08 0.04 0.09 0.05 0.21 0.10 0.25 0.20 CAT 2005-2006 0.08 0.04 0.13 0.10 0.18 0.12 0.14 0.19 0.26 0.17 0.27 0.30 CAT 2006-2007 0.05 0.03 0.08 0.07 0.19 0.09 0.19 0.13 0.24 0.14 0.26 0.21 ANDES Fall 2005 0.06 0.03 0.06 0.07 0.19 0.06 0.27 0.13 0.25 0.09 0.32 0.22 ANDES Fall 2006 0.11 0.08 0.10 0.17 0.17 0.07 0.24 0.13 0.28 0.15 0.32 0.34 ANDES Fall 2007 0.15 0.14 0.13 0.22 0.19 0.13 0.26 0.26 0.33 0.27 0.34 0.47 ANDES Fall 2008 0.09 0.11 0.10 0.20 0.26 0.15 0.44 0.36 0.34 0.25 0.50 0.54 ANDES Fall 2009 0.16 0.10 0.13 0.21 0.21 0.13 0.27 0.24 0.36 0.23 0.38 0.46 ANDES Spring 2005 0.08 0.05 0.08 0.09 0.14 0.07 0.24 0.11 0.22 0.12 0.30 0.21 ANDES Spring 2006 0.16 0.12 0.14 0.20 0.14 0.05 0.26 0.13 0.29 0.17 0.37 0.34 ANDES Spring 2007 0.26 0.23 0.24 0.39 0.11 0.06 0.26 0.19 0.36 0.27 0.41 0.53 ANDES Spring 2008 0.16 0.11 0.23 0.32 0.20 0.08 0.48 0.28 0.33 0.17 0.56 0.55 ANDES Spring 2009 0.18 0.17 0.17 0.29 0.12 0.06 0.27 0.18 0.30 0.21 0.38 0.44
Note. FI = First Item Correctness, NI = Next Item Correctness, MS = Mastery Speed, WS = Wheel-Spinning. Values for mastery speed and wheel-spinning within Andes2 are shaded to remind readers that this system was found to be qualitatively different than ASSISTments and Cognitive Tutor, and as such, these values may carry less reliability.
8
DISCUSSION
Much like Brahe and Kepler discovering errors in planetary orbits via side-by-side astronomical charts [14], the present results revealed potential errors in the focus of the Educational Data Mining community via side-by-side learner models. The trends observed for next item correctness (e.g., a construct that explains minimal variance in models, that has decreased in power longitudinally within systems, and in which attribution to student or skill is heavily system dependent) suggest that researchers in the field are putting the majority of their focus in an overly complex portion of the space that may not reveal as much about student achievement and skill mastery as other constructs. The present work sought to determine the proportion of variance attributed to students and skills when looking across systems and constructs. Findings suggested that across systems and constructs, between 4% and 24% of variance could be attributed to student (without corrections for Andes2, M = 0.13, SD = 0.03), and between 4% and 30% of variance could be attributed to skill (without corrections, M = 0.15, SD = 0.05). When not considering Andes2 due to its qualitative differences as a system, student variance in ASSISTments and Cognitive Tutor ranged from 4% to 19% (M = 0.12, SD = 0.04) and skill variance also ranged from 4% to 19% (M = 0.12, SD = 0.03). Further, when looking over time, trends were observed in the variability of student and skill variance for constructs and systems. Findings suggested that learner models are highly sensitive to the system, dataset, and construct being modeled, with different systems and constructs resulting in different trends.
The systems considered herein were chosen for their popularity within the EDM community. ASSISTments and Cognitive Tutor, systems producing some of the most mined datasets, actually appear to behave very differently. Across constructs, student was more valuable when modeling ASSISTments data, while skill was more valuable when modeling Cognitive Tutor data. These extremes in the attribution of variance suggest that learner models treating these systems as equivalents may not be appropriate, as results will look similar on average but the observed effects may be attributed to very different causes.
The set of constructs examined herein was also chosen to address useful issues within the field of EDM. The goal of this work was to promote the importance of modeling a broad range of constructs, extending the field’s vocabulary beyond next item correctness. Further, little focus has fallen on comparing learner models across systems [5]. Results from the present work suggest that this approach is critical for understanding the implications of learner modeling from a broader perspective.
When questioning why differences in variance attribution were observed, a few potential causes can be hypothesized. It is possible that skills were poor predictors in ASSISTments due to greater variance in the population of student users (i.e., perhaps students bring a greater range of preparation, knowledge, and behavior). The apparent lack of predictive ability in comparison to Cognitive Tutor may also be due to the fact that skills and specific knowledge components have much more variability, spanning grades and mathematics domains while Cognitive Tutor is limited to Algebra 1 components. It is also possible that the issues inherent to skill-based learner modeling in ASSISTments can be linked to the tagging of knowledge components or to errors in the skill structure itself, although this structure is continuously revised for accuracy through research into prerequisite skills [1]. Still, it is also possible to turn the tables and ask why student was a poor predictor within Cognitive Tutor. It is possible that the student
population using Cognitive Tutor to practice Algebra, especially within the restricted data made available through the PSLC DataShop [19] was more homogenous in preparation, ability, and behavior. Cognitive Tutor is presented to students as part of an entire curriculum [18; 20] and is limited to a single mathematics domain.
Not surprisingly, middle school mathematics is qualitatively different than introductory college physics, as confirmed by the difficulty in modeling constructs within Andes2. These systems carry similar knowledge components or skills, but are driven by very different instructional objectives. Middle school mathematics is repetitious, requiring students to practice skills multiple times and offering a clear depiction of learning (i.e., through learning curves). In comparison, physics is far more granular, with knowledge components that correspond to smaller steps within complex problem solving. Students solving physics problems experience less repetition in specific skill practice, making it more difficult to model when learning has occurred by considering student or skill.
A touch of clairvoyance into the future of EDM would suggest that the future of learner modeling will likely look more like the trends observed within ASSISTments, as the platform more closely resembles material from a Massive Open Online Course. These platforms have broader and more loosely defined skills, where students are not constrained to a fixed curriculum and may access lessons at will, as shown by work that has already investigated the application of knowledge tracing to MOOCs [16]. As the field progresses, learner models should be developed cautiously, explained within their context, and presented within a broader perspective of implications.
LIMITATIONS & FUTURE WORK
The present work is not without limitation. First and foremost, while three systems and four constructs were considered to examine how student and skill variance are partitioned within learner models, there are certainly many other systems and constructs that have not been considered. Future work should be considered to extend the findings presented here across additional systems, perhaps to include MOOCs and datasets that have not been primed for presentation in the PSLC DataShop [19]. There are also a number of constructs that are of interest to the greater EDM community that are not considered in the present work (e.g., student affect, or other student, class, and school level characteristics like gender, class size, and urbanicity). Future work should investigate variance attributions across more complex constructs of this nature.
Another limiting factor of this work is the validity of the datasets considered herein. While the authors had control over the query and preprocessing necessary for the ASSISTments dataset, less is known about the steps that established datasets retrieved from the PSLC DataShop [19]. Specifically, the Cognitive Tutor Algebra dataset was promoted for the specific purpose of the KDD Cup [12], a data mining challenge focused on specific predictors and outcomes. Thus, it is possible that the dataset was cleaned in a manner to best suit the needs of data miners with particular goals, which may have led to some of the trends in student and skill variance observed between systems.
Additionally, model-fitting procedures have the capacity to influence the results observed, and while measures were taken to produce valid and reliable results, it is possible that our approach had room for error. Other approaches to partitioning the variance within learner models may result in slightly different outcomes.
9
CONTRIBUTIONS
The present work offers a novel contribution to the Educational Data Mining community in the form of a cross platform comparison of student and skill variance attributions within learner models predicting first item correctness, next item correctness, mastery speed, and wheel-spinning. This work revealed that much of the field has been focusing on a complex and potentially impractical area in learner modeling – next item correctness. Student characteristics are less helpful in predicting this construct, but may be more practical in predicting other, less sensitive constructs. Further, it revealed that variance in some of the most frequently mined datasets can be system and construct specific, and as such, that broad claims about the generalization of particular learner models should be made with caution.
ACKNOWLEDGMENTS
We acknowledge funding from multiple NSF grants (1440753, 1252297, 1109483, 1316736, 1535428, 1031398), the U.S. Dept. of Ed. (R305A120125, R305C100024, P200A120238), and ONR. The opinions, findings and conclusions, and recommendations expressed in this paper are those of the authors and do not necessarily reflect the views of our funders.
REFERENCES
[1] Adjei, S.A. & Heffernan, N.T. 2015. Improving learning maps using an adaptive testing system: PLACEments. In Conati, et al. (eds), Proc of the 17th Int Conf on AIED. 517-520.
[2] Anderson, J.R., Corbett, A.T., Koedinger, K.R., & Pelletier, R. 1995. Cognitive tutor: Lesson learned. The journal of the learning sciences. 4 (2): 167–207.
[3] Beck, J.E. & Chang, K. 2007. Identifiability: A Fundamental Problem of Student Modeling. In Conati, et al. (eds.) Proc of the 11th Int Conf on User Modeling. 4511: 137-146. [4] Beck, J.E. & Gong, Y. 2013. Wheel-Spinning: Students Who
Fail to Master a Skill. In Lane, et al. (eds.) Proc of the 16th Int Conf on AIED. 431-440.
[5] Beck, J.E. & Xiong, X. 2013. Limits to Accuracy: How Well Can We Do at Student Modeling? In D’Mello, et al. (eds.) Proc of the 6th Int Conf on EDM. 4-11.
[6] Botelho, A., Wan, A., & Heffernan, N. 2015. The Prediction of Student First Response Using Prerequisite Skills. In Kiczales, et al. (eds.) Proc of the 2nd ACM Conf on L@S. 39-45.
[7] Carnegie Learning. 2016. Cognitive Tutor Software. Carnegie Learning, Inc. Retrieved from
https://www.carnegielearning.com/learning-solutions/software/cognitive-tutor/
[8] Corbett, A. T., & Anderson, J. R. 1995. Knowledge tracing: Modeling the acquisition of procedural knowledge. User Modeling and User-Adapted Interaction. 4 (4): 253-278. [9] Desmarais, M.C. & Baker, R.S.J.d. 2011. A Review of
Recent Advances in Learner and Skill Modeling in Intelligent Learning Environments. User Modeling and User-Adapted Interaction. 22 (1-2): 9-38.
[10]Gong, Y. & Beck, J.E. 2015. Towards Detecting Wheel-Spinning: Future Failure in Mastery Learning. In Kiczales, Russell, & Woolf (eds.) Proc of the 2nd ACM Conf on L@S. 67-74.
[11]Heffernan, N. & Heffernan, C. 2014. The ASSISTments Ecosystem: Building a Platform that Brings Scientists and Teachers Together for Minimally Invasive Research on Human Learning and Teaching. International Journal of AIED. 24 (4): 470-497.
[12]KDD Cup. 2010. Rules of the KDD Cup 2010: Educational Data Mining Challenge. PSLC DataShop. Retreived from https://pslcdatashop.web.cmu.edu/KDDCup/rules.jsp [13]Kelly, K., Wang, Y., Thompson, T., & Heffernan, N. 2015.
Defining Mastery: Knowledge Tracing Versus N-Consecutive Correct Responses. In Santos, et al., (eds.) Proceedings of the 8th Int Conf on EDM.
[14]Kusukawa, S. 1999. Astronomical Tables. University of Cambridge, Department of History and Philosophy of Science. Retrieved: www.hps.cam.ac.uk/starry/tables.html [15]Mood, A.M. 1971. Partitioning Variance in Multiple
Regression Analyses as a Tool for Developing Learning Models. American Educational Research Journal. 8 (2): 191-202.
[16]Pardos, Z.A., Bergner, Y., Seaton, D., Pritchard, D. 2013. Adapting Bayesian Knowledge Tracing to a Massive Open Online Course in edX. In D’Mello, et al. (eds.) Proc of the 6th Int Conf on EDM. 137-144.
[17]Pardos, Z.A. & Heffernan, N.T. 2010. Modeling Individualization in a Bayesian Networks Implementation of Knowledge Tracing. In Bra, et al. (eds.) Proc of the 18th Int Conf on UMAP. 255-266.
[18]Ritter, S., Anderson, J.R., Koedinger, K.R., & Corbett, A. 2007. Cognitive Tutor: Applied research in mathematics education. Psychonomic Bulletin & Review. 14 (2): 249-255. [19]Stamper, J.C., Koedinger, K.R., Baker, R.S.J.d., Skogsholm, A., Leber, B., Demi, S., Yu, S., & Spencer, D. 2011. DataShop: A Data Repository and Analysis Service for the Learning Science Community. In Biswas et al. (eds.) Proc of the 15th Int Conf on AIED.
[20]VanLehn, K., Lynch, C., Schulze, K., Shapiro, J.A., Shelby, R., Taylor, L., Treacy, D., Weinstein, A., & Wintersgill, M. 2005. The Andes Physics Tutoring System: Lessons Learned. International Journal of AIED. 15 (3): 147-204.
[21]Author 1. 2016. Data and code for “Students vs. Skills: Explaining the Variance in Learner Modeling” available at http://tiny.cc/StudentSkillEDM2016
[22]Xiong, X., Li, S., & Beck, J.E. 2013. Will You Get It Right Next Week: Predict Delayed Performance in Enhanced ITS Mastery Cycle. In Proc of the 26th Int FLAIRS Conference. [23]Yudelson, M.V., Koedinger, K.R., & Gordon, G.J. 2013.
Individualized Bayesian Knowledge Tracing Models. In Lane, et al. (eds.) Proc of the 16th Int Conf on AIED. 171-180.
[24]Wan, H. & Beck, J.B. 2015. Considering the influence of prerequisite performance on wheel spinning. In Santos, et al., (eds.) Proc of the 8th Int Conf on EDM.
10
The Opportunity Count Model: A Flexible Approach to
Modeling Student Performance
Yan Wang, Korinn Ostrow, Seth Adjei, Neil Heffernan
Worcester Polytechnic Institute Worcester, MA 01609
{ywang14, ksostrow, saadjei, nth} @wpi.edu
This section has been published at:
Wang, Y., Ostrow, K., Adjei, S. & Heffernan, N. (2016). The Opportunity Count Model: A Flexible Approach to Modeling Student Performance. In the Proceedings of 3rd Annual ACM Conference on Learning at Scale. ACM.
ABSTRACT
Rich features can be exploited to better model student performance when predicting next problem correctness (NPC) within intelligent tutoring systems. Yet these features may differ significantly in availability and importance when considering opportunity count (OC), or the number of problems experienced within a skill or knowledge component. Inspired by such intuition, the present study examines the Opportunity Count Model (OCM), a unique approach to student modeling in which separate models are built for differing OCs rather than creating a blanket model to encompass all OCs. Random Forest (RF) is used to establish iterations of the OCM by considering rich features within logged tutor data. Model strength is then tested against standard Knowledge Tracing. Results suggest that prediction of next problem correctness is improved through the OCM approach for lower OCs, and applying different modeling techniques at different phase of students’ practice would be plausible. Also, feature variation among OCs justifies our proposal to build OCM. Author Keywords
Random Forest; Opportunity Count; Student Modeling; Next Problem Correctness; Intelligent Tutoring System; Knowledge Tracing
ACM Classification Keywords
I.6.5. Simulation and modeling: Model Development; J.1. Administrative data processing; K.3.0. Computers and education: General.
INTRODUCTION
Since its creation, Knowledge Tracing (KT) [3] has played a critical role in the intelligent tutoring system (ITS) community for its use in modeling student knowledge and performance. Although it has shown high prediction accuracy, KT overlooks the rich features that are common to many ITSs, such as response time and hint usage. A variety of rich features are easily obtained by data mining the log files of these systems, and as research has shown,
these features can be exploited to improve student modeling [4,5,8,9,11]. Specifically, González-Brenes et.al. presented a general method for making use of rich features via dynamic Bayesian Networks, thereby compensating for the limitations of KT [5]. In contrast, Wang and Heffernan [11] established a maximum likelihood tabling method termed the “Assistance” Model, which considered a student’s hint and attempt usage to better predict performance. Although this model did not outperform KT, ensembling the two models proved beneficial. Research by Duong, Zhu, Wang and Heffernan [4] considered action sequences in the prediction of next problem correctness, enhancing prediction accuracy over KT. Other feature based methods that have proven successful include Performance Factors Analysis [9], which applies logistic regression to a compounding record of correct and incorrect problem responses in order to predict next problem correctness, and a Random Forest approach by Pardos & Heffernan [8] that examined the significance of numerous rich features in modeling student performance.
Despite the fact that rich features have been shown to enhance student modeling, little focus has been given to the critical significance of opportunity count (OC), or the compounded sequence of skill or knowledge component opportunities within a student’s learning experience. It seems intuitive that the availability and importance of rich features within logged data can vary based on opportunity count: different features hold significance for a student on her third opportunity than those important for a student on her seventh opportunity. It may be possible to reduce the noise inherent to low OCs (i.e., the initial parameters used in KT are more critical to prediction when OCs are low) by establishing flexible models that consider opportunity count alongside rich features.
The present study investigates the significance of opportunity count when establishing student models using rich features. We propose building separate models for differing OCs by using a Random Forest approach to determine fluctuations in the importance of rich features
11
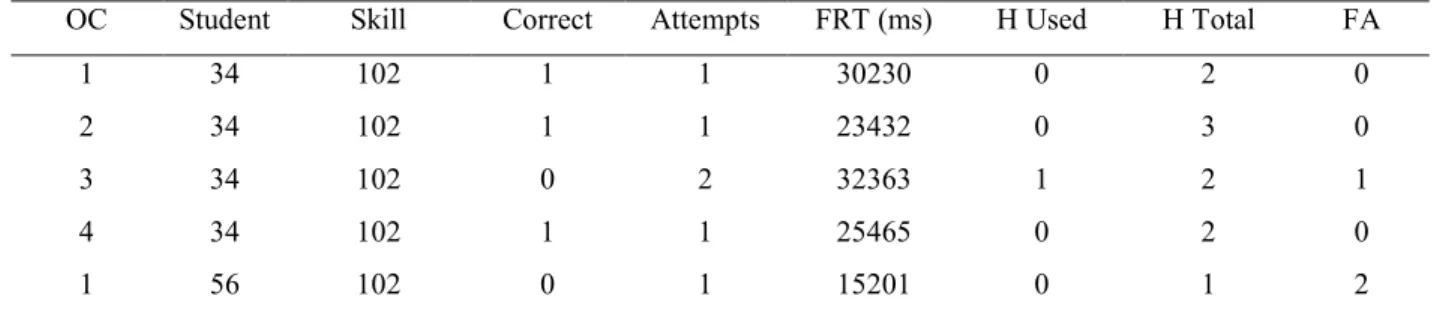
OC Student Skill Correct Attempts FRT (ms) H Used H Total FA
1 34 102 1 1 30230 0 2 0
2 34 102 1 1 23432 0 3 0
3 34 102 0 2 32363 1 2 1
4 34 102 1 1 25465 0 2 0
1 56 102 0 1 15201 0 1 2
Table 1. Sample Data across a dataset stratified by OC. Random Forest,
introduced by Leo Breiman, is a proven method for making predictions based on a variety of features [2]. The method trains regression trees based on decision splits made from a random subset of data features. The resulting output offers a prediction model based on an ensemble of regression trees. This method also succinctly defines the degree of feature importance within a model, as measured by out-of-bag error [10].
The Opportunity Count Model proposed here examines the potential flexibility of student modeling when considering opportunity count and rich features inherent to intelligent tutoring systems. We seek to answer the following research questions:
1. Can the accuracy of models predicting next problem correctness be enhanced by establishing separate models for differing opportunity counts when considering rich features?
2. Is there variation of feature importance among different OCs?
DATASET
The current study examines flexible OC modeling using a dataset comprised of student data logged between September 2012 and August 2013 within ASSISTments, an intelligent tutoring system with a primary focus on mathematics content [6]. The log files used in the present study originated solely from Skill Builders, a type of problem set unique to ASSISTments in which students must correctly solve three (by default setting) consecutive problems on a skill in order to complete or ‘master’ their assignment. Problems are randomly assigned from a large pool of skill content to reduce the likelihood of cheating. For each problem, students are provided correctness feed-back along with hints or scaffolding problems that act as tutoring strategies to deter students from getting stuck within the assignment. Hints are provided upon the student’s request, while scaffolding problems are presented automatically when an incorrect answer is entered, or upon the student’s request. A series of hints offers assistance that grows increasingly specific, until ultimately providing students with the correct answer (i.e., the ‘Bottom Out Hint’). Alternatively, scaffolding problems are used to provide worked examples or to break a problem down into steps as a guide for problem solving. A detailed log is kept
for each problem with regard to student actions, including answers, attempt count, hint requests, and scaffold usage. Students are not able to skip problems within the problem set, and must answer a problem correctly or arrive at the Bottom Out Hint before moving on to the next problem. Thus, Skill Builders offer the unique opportunity to investigate opportunity count within differing skills in a mastery-learning environment.
The dataset used in the present study only included information logged for main problems. Thus, scaffolding problems were excluded from analysis as they carry a high probability of student accuracy based on their nature. Further, ASSISTments Skill Builders can include problems with a variety of problem types including ‘Fill-In,’ where the student must answer an exact answer, ‘Algebra,’ where the student can enter any mathematically equivalent answer, and ‘Multiple Choice’ in which students must select an answer from a range of possible solutions. Skill Builder problem sets employing Multiple Choice problems were
excluded from the present study due to their
disproportionate ease and the potential for correct guessing. Additionally, Skill Builders with less than 1000 logged problems were excluded from analysis. Following all exclusions, the resulting dataset contained details for 85,862 problems logged by 3,210 unique students spanning 70 unique skills.
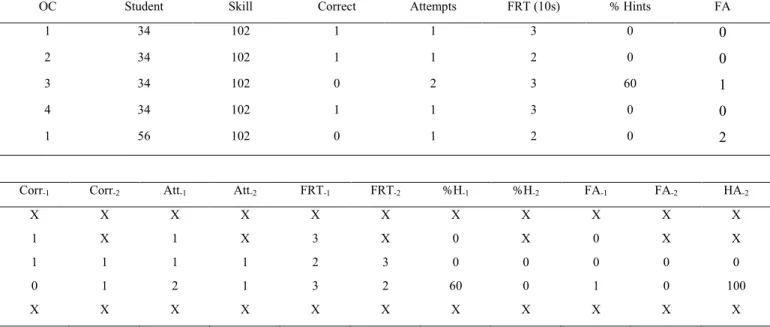
An abbreviated version of the logged data is presented in Table 1, displaying only the information pertinent to feature generation. The full dataset, including all logged data, can
be accessed here. Within the sample data in Table 1, each
row represents a problem logged for one student at a specific opportunity to practice the skill. A binary score is logged for each problem, along with an attempt count, the student’s first response time (in milliseconds), the number of hints used, the number of hints available per problem, and the student’s first action on the problem. For instance, the first row represents student 34’s first opportunity on skill 102. The student answered the problem correctly in one attempt without the use of hints.
While a value of 1 in this column signifies that the student answered the problem correctly without assistance, a value of 0 may signify an incorrect first attempt or an immediate request for assistance from hints or scaffolding. First response time represents the duration of time in
12
milliseconds from when a problem is started to the first logged action. As shown in Table 1, first action can include an attempt at answering the problem (0), a hint request (1), or a scaffolding request (2).
Figure 1. Number of Cases for Differing OCs. As previously noted, Skill Builders require three correct consecutive answers for skill mastery. Thus, high performing students are likely to have minimal OCs within a skill, while struggling students are likely to have higher OCs within a skill. As OC increases, data points grow scarcer as students master (or fail to master) the skill. Figure 1 depicts this trend for OCs within the dataset. For example, there were approximately 12,000 cases of students experiencing three OCs for a skill, but only about 7,000 cases of students reaching five OCs for a skill. It should also be noted that Skill Builder problem sets carry a daily limit, or a preset number of problems that a student can attempt in one day. By default, the daily limit is set to ten problems. If a student exceeds the daily limit prior to correctly solving three consecutive problems, the problem set is effectively locked until the next day and the student is told to consult with her teacher. Therefore, it might be less accurate to make predictions for OC’s greater than ten.
METHODS
Feature Generation and Organization
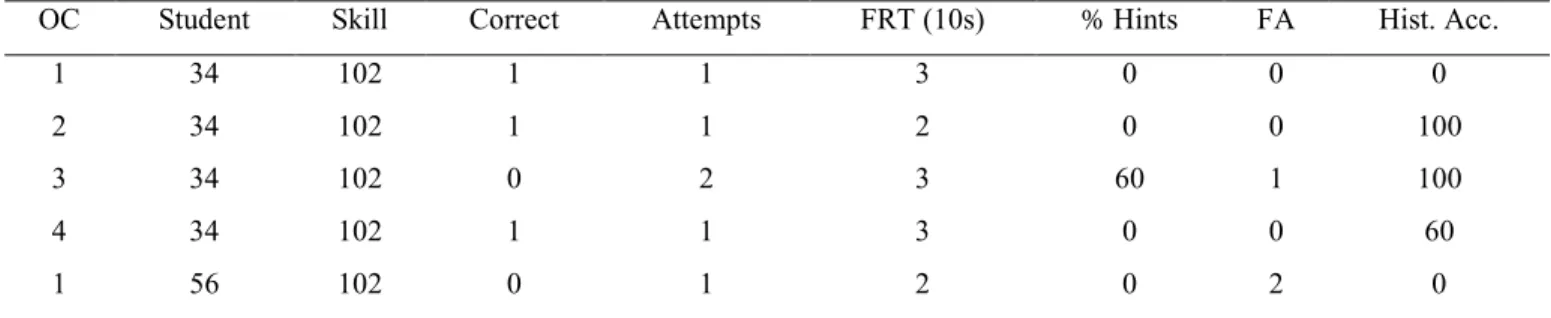
In order to apply RF to build prediction models, it was first necessary to modify the original data set by generating new features. The first generated feature combined original data for hints used and total hints available to establish the percentage of hints used at each OC. As different problems carry different hint totals, percentage of hints used offers a better understanding of student performance across problems. Next, first response times were groomed to remove outliers that are larger than 400ms (less than 1% of the problems logged were removed in this process) and to simplify the time structure to 10 second increments. We felt that it was unnecessary for time to be measured with such precision and as RF prefers discretized data, this binning process would help to avoid excess node splitting without much information loss. Additionally, a feature called ‘historical accuracy’ was generated to track a student’s percentage of correctness across all prior OCs within a skill. Finally, as an organizational measure, all percentages in the modified dataset were discretized by units of 20% to simplify RF. For example, if historical accuracy was 65%, it was discretized to 60%, while if percentage of hints used was 75%, it was discretized to 80%. A sample of the resulting dataset is presented in Table 2.
In order to generate predictions for next problem performance, RF reads in features based on the organization of training data. We propose two organization methods for the features depicted in Table 2, with results presented for both methods.
Organization Method 1.
The first method of feature organization employs the structure depicted in Table 2. Columns, read left to right, serve as successive features or predictors for RF. Each row or problem serves as a case, and the predicted value is correctness on the next problem.
Organization Method 2.
This organization method sought to amend potential data loss observed in Organization Method 1 due to the
OC Student Skill Correct Attempts FRT (10s) % Hints FA Hist. Acc.
1 34 102 1 1 3 0 0 0
2 34 102 1 1 2 0 0 100
3 34 102 0 2 3 60 1 100
4 34 102 1 1 3 0 0 60
1 56 102 0 1 2 0 2 0
Table 2. Sample Data Following the Organization Method 1
0 5 10 15 0 1000 2000 3000 4000 5000 6000 7000 8000 9000 10000 11000 12000 13000 14000 15000 OC N u m b e r o f C a s e s