DOI: http://dx.doi.org/10.21609/jiki.v9i1.287
PERFORMANCE COMPARISON BETWEEN SUPPORT VECTOR REGRESSION AND ARTIFICIAL NEURAL NETWORK FOR PREDICTION OF OIL PALM PRODUCTION
Mustakim1, Agus Buono2, and Irman Hermadi2
1Information System Department, Faculty of Science and Technology, UIN Sultan Syarif Kasim Riau
Jl. H.R. Soebrantas No. 155 Km. 18, Pekanbaru, 28293, Indonesia
2Computer Science Department, Faculty of Mathematic and Natural Science, Institut Pertanian Bogor
Jl. Meranti Wing 20 Level 5-6, Bogor, 16680, Indonesia E-mail: [email protected]
Abstract
The largest region that produces oil palm in Indonesia has an important role in improving the welfare an economy of the society. Oil palm production has increased significantly in Riau Province in every period. To determine the production development for the next few years, we proposed a prediction of the production results. The dataset were taken to be the time series data of the last 8 years (2005-2013) with the function and benefits of oil palm as the parameters. The study was undertaken by comparing the performance of Support Vector Regression (SVR) method and Artificial Neural Network (ANN). From the experiment, SVR resulted the better model compared to the ANN. This is shown by the correlation coefficient of 95% and 6% for MSE in the kernel Radial Basis Function (RBF), whereas ANN resulted only 74% for R2 and 9% for MSE on the 8th experiment with hidden neuron 20 and learning rate 0,1. SVR model generated predictions for next 3 years which rose 3%-6% from the actual data and RBF model predictions.
Keywords: Artificial Neural Network (ANN), Palm Oil, Prediction, Radial Basis Function (RBF), Support Vector Regression (SVR)
Abstrak
Daerah penghasil kelapa sawit terbesar di Indonesia mempunyai peranan penting dalam peningkatan kesejahteraan dan ekonomi masyarakat. Produksi kelapa sawit mengalami peningkatan yang signifikan di Provinsi Riau dalam setiap kurun waktu, untuk menentukan perkembangan produksi beberapa tahun ke depan, kami mengusulkan suatu prediksi dari hasil produksi. Dataset yang diambil adalah data time series dari data yang diperoleh selama 8 tahun terakhir (2005-2013) dengan fungsi dan manfaat kelapa sawit sebagai parameter. Dalam implementasinya peramalan dilakukan dengan membadingkan kinerja metode Support Vector Regression (SVR) dan Artificial Neural Network (ANN). Dari percobaan, SVR menghasilkan model terbaik dibandingkan dengan ANN yaitu ditunjukkan dengan koefisien korelasi sebesar 95% dan MSE 6% pada kernel Radial Basis Function (RBF), sedangkan ANN hanya menghasilkan R2 sebesar 74% dan MSE 9% pada percobaan ke-8 dengan hidden neuron 20 dan learning rate 0,1. SVR model menghasilkan prediksi untuk 3 tahun kedepan yang memiliki kenaikan antara 3%-6% dari data aktual dan prediksi model RBF.
Kata Kunci:Artificial Neural Network (ANN), Kelapa Sawit, Prediksi, Radial Basis Function (RBF), Support Vector Regression(SVR)
1. Introduction
Riau is a province in the central of Sumatra, Indo-nesia that has 8.91 million hectares of area. Riau consists of 12 districts and 142 sub-districts. In 2013, Riau was recorded as a province that has the largest area of oil palm in Indonesia, with 2.26 mi-llion hectares. The average production of oil palm in Riau is 6.93 million tons per year spread in 10 sub-districts [1]. The production of oil palm in Riau is increasing every year for both its production and its plantation area. Information that was released
by Riau Central Bureau of Statistics showed that there was a decreasing value of certain area. It was due to the change and replanting oil palm that has reached the limit of its age production.
The amount of oil palm production in Riau il-lustrates its benefits toward the prosperity level of a region [2]. In addition, oil palm also contributed to the sustainability of three main different indus-tries. First of all, the production of Crude Oil palm (CPO) [3]. Secondly, it affects downstream indus-tries derived from waste oil [3]. Lastly and the most important for Riau, it is used as a raw materials for
February 2016
the development of renewable energy with the co-mposition of waste that has been prescribed for ea-ch part suea-ch as shells, fibers, and oil palm’s empty bunch, to over-come the electricity crisis [4-7].
A broad view and production of oil palm was also used as a decision making reference for Steam Power Plant development in Riau with simulation of extraction calculation 50% oil palm waste [8-9]. On the other hand, oil palm that has spread throu-ghout Riau at this time have become a phenomenon among investors in terms of both production and waste. The local government is also seeking a way to develop energy using the raw material of oil pa-lm as an alternative of fossil energy. This is in ac-cordance with the mandate of the law No. 30/2007 concerning about chapter 20 verse 4. It is stated that is the provision and utilization of new and renew-able energy should be enhanced by the central and local governments appropriate with their authority. One of the renew-able energy which is mentioned in the law is biomass which is made from oil palm [10]. The problem is the condition of oil palms in Riau in a long term, whether the result of produc-tion can always provide the raw material supply of alternative energy or vice versa. It must be depen-dent from local government policy.
Several studies had discussed topic related to forecasting of oil palm production both in term of production statistics or based on past data. In 2009, Hermantoro was predict oil palm [11]. By compar-ing determiner parameters, he concluded that oil palm production will increase. The study was con-ducted by using a machine learning technique call-ed Artificial Neural Network (ANN). However, he did not mention the accuracy of the prediction result. Mustakim [12] also studied another predict-tion of oil palm using a different method called Support Vector Regression (SVR). This is done by using time series data Riau from 2005 to 2013. The Research concluded the best model accuracy of SVR is 95% and 6% for error in the kernel of Ra-dial Basis Function (RBF).
Therefore, this study will discuss the perfor-mance comparison between the best model of SVR and best model of ANN to predict the oil palm production in Riau by utilizing last 8 years data (2005-2013). SVR is used to overcome several data over-fitting from the data set. The expectation of this study is to provide conclusions related to the best model in predicting the production of oil palm for the coming years.
2. Methods
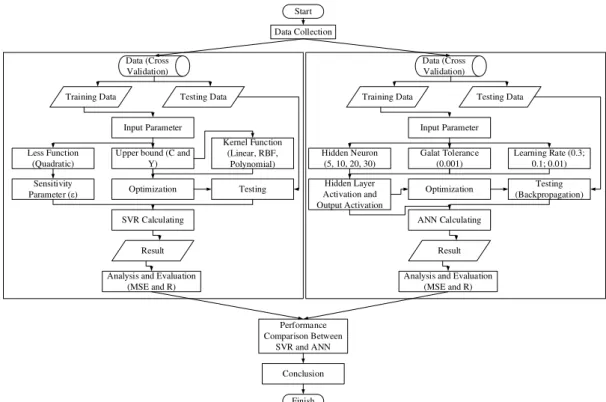
This research was conducted with multiple steps including data collection, data selection, SVR mo-delling, ANN momo-delling, and analysis of perfor-mance comparison between SVR and ANN.
Sever-al literatures that compare SVR and ANN often conclude that SVR is better than ANN. This rese-arch will also prove some statement best algorithm SVR modelling than ANN modelling. For more de-tails, methodology can be seen in Figure 1. Data Collection
The data that were used in this research are the pro-duction and productivity of oil palm. The data ware originated from Central Bureau of Statistics and Department of Estate Crops in Riau 2013. The data consists of 32 data points, and were recorded from 2005 to 2013. The data was filtered into 74 sub-districts based on Production Minimum Standard (PMS). SVR was able to overcome some of the da-ta over-fitting in a dada-ta set. According to Christo-doulos’s research the minimum data required for prediction is 16 up to 20 data points [13].
Data Selection
Data selection was done by performing pre-pro-cessing all of the data, several companies, and de-partment determined that the PMS which was used as a target should be 1.000 ton/period or an average minimum production of 1.000 ton/ year. There are only 74 from 142 sub-districts that fulfil this Pro-duction Minimum Standard (PMS). After establi-shing and obtaining the data points that will be used to make a prediction the next step is to divide the data into two parts: training dataset and testing da-taset. The division was based on k-fold cross vali-dation by randomly dividing the data into k subsets and all the data were used for both testing data and training data [14]. All of the data will also be nor-malized. To obtain the same weight from all data attributes and to obtain less variation. In other wo-rds, there are no attributes which more dominant or considered as more important than others from the result of its weighting [15].
Support Vector Regression (SVR)
SVR is the application of Support Vector Machine (SVM) for the case of regression. In the case of re-gression, output is in real or continuous numbers. SVR is a method that can solve over-fitting. There-fore, it will produce a good performance [16] and provide conclusions about the superiority and ac-curacy results [17].
It could also be applied to various cases with continuous data [18]. In 2003, Smola and Schol-kopf explained about SVR by giving example of a condition which there is 𝜆𝜆 training dataset (𝑥𝑥𝑗𝑗,𝑦𝑦𝑗𝑗) with 𝑗𝑗= 1,2, … ,𝜆𝜆 with input. 𝑥𝑥= {𝑥𝑥1,𝑥𝑥2,𝑥𝑥3}⊆
𝑅𝑅𝑅𝑅 and output concerned 𝑦𝑦= {𝑦𝑦𝑖𝑖, … ,𝑦𝑦𝜆𝜆}⊆ 𝑅𝑅𝑅𝑅. By using SVR, a function of 𝑓𝑓(𝑥𝑥) will be found.
The function has the biggest deviation 𝜀𝜀 from the actual target for all training data. Then by using SVR, when the value of 𝜀𝜀 is equal to 0, perfect re-gression will be obtained. Based on the data, the SVR wanted to find a regression function of 𝑓𝑓(𝑥𝑥) that can approximate output to an actual target, with error tolerance of 𝜀𝜀, and minimal complexity. Regression function of 𝑓𝑓(𝑥𝑥) can be stated by the following formula [19]:
𝑓𝑓(𝑥𝑥) =𝑤𝑤𝑇𝑇𝜑𝜑(𝑥𝑥) +𝑏𝑏 (1)
Where 𝜑𝜑(𝑥𝑥) indicates a point within a higher di-mension feature space and the result of mapping the input of vector x in a lower dimension feature space. Coefficients w and b are estimated by mini-mizing the risk function that is defined in the equa-tion(2) and (3): 𝑚𝑚𝑚𝑚𝑚𝑚1 2‖𝑤𝑤‖ 2+𝐶𝐶1 𝜆𝜆 � 𝐿𝐿𝑒𝑒(𝑦𝑦𝑖𝑖,𝑓𝑓(𝑥𝑥𝑖𝑖)) 𝜆𝜆 𝑖𝑖=1 (2) 𝑦𝑦𝑖𝑖− 𝑤𝑤𝜑𝜑(𝑥𝑥𝑖𝑖)− 𝑏𝑏 ≤ 𝜀𝜀 𝑤𝑤𝜑𝜑(𝑥𝑥𝑖𝑖)− 𝑦𝑦𝑖𝑖+𝑏𝑏 ≤ 𝜀𝜀,𝑚𝑚= 1,2, … ,𝜆𝜆 (3) where, 𝐿𝐿𝜀𝜀�𝑦𝑦𝑖𝑖,𝑓𝑓(𝑥𝑥𝑖𝑖)� =�|𝑦𝑦𝑖𝑖− 𝑓𝑓(𝑥𝑥𝑖𝑖)|− 𝜀𝜀|𝑦𝑦𝑖𝑖− 𝑓𝑓(𝑥𝑥𝑖𝑖)|≥0 0,𝑜𝑜𝑜𝑜ℎ𝑒𝑒𝑒𝑒 (4)
There are three kernel functions on SVR mo-dels. They are Linear, Polynomial and Radial Basis Function (RBF). These 3 kernel functions are in LIBSVM [20]:
Linear Kernel
𝑘𝑘(𝑥𝑥,𝑦𝑦) =𝑥𝑥𝑇𝑇𝑦𝑦+𝐶𝐶 (5)
Polynomial Kernel
𝑘𝑘(𝑥𝑥,𝑦𝑦) = (𝛼𝛼𝑥𝑥𝑇𝑇𝑦𝑦+𝐶𝐶)𝑑𝑑 (6)
Radial Basis Function (RBF) Kernel
𝑘𝑘(𝑥𝑥,𝑦𝑦) =𝑒𝑒𝑥𝑥𝑒𝑒(−𝛾𝛾‖𝑥𝑥 − 𝑦𝑦‖2) (7)
Artificial Neural Network (ANN)
ANN is a network of small processing unit group that is modelled based on human neural tissue. The ANN has an adaptive system that can change its structure to solve problems based on external or internal information that flows through the network [21]. In its development, ANN architecture is divi-ded into two parts; Single Layer Network and Mul-tiple Layer Network [22]. Models of MulMul-tiple La-yer Network’s category such as backpropagation [23].
Backpropagation trains a network to get a balance between the network’s ability to recognize patterns that are used during training as well as net-work’s ability to give the correct response toward input pattern which are similar (but not equal) with
Start Data Collection Data (Cross
Validation)
Training Data Testing Data Input Parameter Less Function
(Quadratic)
Upper bound (C and Y)
Kernel Function (Linear, RBF,
Polynomial) Sensitivity
Parameter (ε) Optimization Testing SVR Calculating
Result Analysis and Evaluation
(MSE and R)
Data (Cross Validation)
Training Data Testing Data Input Parameter Hidden Neuron (5, 10, 20, 30) Galat Tolerance (0.001) Learning Rate (0.3; 0.1; 0.01) Hidden Layer Activation and Output Activation Optimization Testing (Backpropagation) ANN Calculating Result Analysis and Evaluation
(MSE and R) Performance Comparison Between SVR and ANN Conclusion Finish
February 2016
the pattern that are used during training [24]. Back-propagation network has 3 phases: advance phase, reverse phase, and weight modification phase to decrease error that might occur [25].
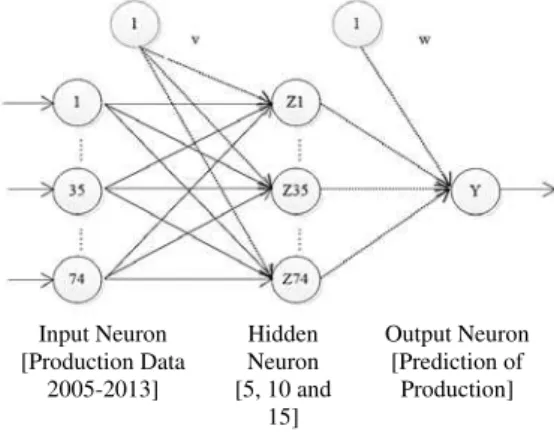
Backpropagation architecture consists of in-put neuron/layer, hidden neuron/layer and outin-put neuron/layer. Each layer consists of one or more ar-tificial neuron. The network architecture that is us-ed in this research can be seen in Figure 2. Comparative Analysis SVR and KNN
This analysis was done by comparing the best re-sults between models of SVM and ANN that were calculated based on the error size and terminated coefficient. If yi is the claimed predicttion value for the i-data and 𝑦𝑦�𝑖𝑖 is the actual output value of the i-data and m is amount of i-data, then the error size that is often used is Mean Squared Error (MSE).
𝑀𝑀𝑀𝑀𝑀𝑀= 1
𝑚𝑚 �(𝑦𝑦�𝑖𝑖− 𝑦𝑦𝑖𝑖)2 𝑚𝑚
𝑖𝑖=1
(8)
3. Results and Analysis SVR Experiment
SVR requires appropriate kernel parameters to conduct the training. To obtain the optimum kernel, optimization was done by using grid search while training. There are two parameters that are opti-mized using grid search. They are parameter C and parameter 𝛾𝛾. Polynomial 𝛾𝛾 parameter is part of α. Parameter 𝐶𝐶 is the penalty value toward error mo-del of SVR, whereas parameters 𝛾𝛾was used as an input to kernel functions that will be used. RBF kernel and polynomial require parameter 𝐶𝐶 and 𝛾𝛾, whereas linear kernel only required parameter 𝐶𝐶 [26]. To search for the optimum value from par-ameter 𝐶𝐶 and 𝛾𝛾, a combination of training and test-ing process experiment for RBF was conducted
220 times. 55 combination experiment were for the linear kernel and 220 experiments combine poly-nomial with various value of parameter 𝐶𝐶 and 𝛾𝛾, so that an optimal model was produced. Other than parameter 𝐶𝐶 and 𝛾𝛾, testing was done by applying parameter New-SVR with a value of 4. The perfor-mance kernel function model can be known thro-ugh the correlation coefficient (R) value and the value of MSE. The best model is a model with the largest value of R (approaching 1) and the smallest value of MSE (close to 0). R and MSE is a simple method that is often used and have been verified in measuring errors.
Simulations which had been performed to find the best accuracy on RBF kernel. The polyno-mial with a C combination is between 2-6 and 25
and a 𝛾𝛾 combination is between 2-1 up to 24.
Like-wise, for the linear kernel the C combination is bet-ween 2-6 and 25. This kind of combination was also
conducted by Hendra Gunawan [27] to find the best accuracy in the case of rice production predict-tion in 2012 that resulted the accuracy above 95%.
Some phases and steps that were done at line-ar kernel were optimized in pline-arameter C. In accor-dance with previous studies. Linear kernel is the simplest one compared to other kernels. Experi-ment combination that ranges from 2-6 up to 25
pro-duced minimum MSE of 0,053308 or 5% with a maximum 𝑅𝑅2 value of 0,921253 or 92%. RBF ker-nel will optimize the value of 𝛾𝛾 that ranges from 2 -1 up to 24. Parameter C at the same range to linear
kernel can obtain the smallest error value of 1.4%, on fold 2. The largest determination coefficient is obtained on fold 1 with 95%. Similar to RBF, poly-nomial kernel optimize value of 𝛾𝛾 and 𝐶𝐶at the sa-me range on RBF.
The best experiment in polynomial with error value of 18% and determination coefficient of 62% is in fold 1. The parameter 𝛾𝛾 and 𝐶𝐶 range between 2-1 and 20. The value of error and the determination
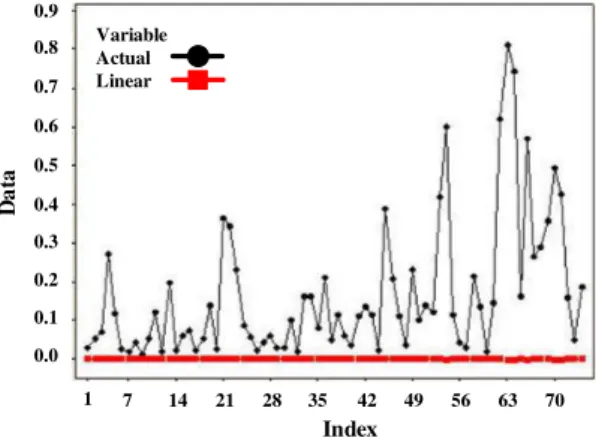
coefficient from those three kernels can be seen on Table 1. Based on experiment from the three ker-nels, the relationship between observation and pre-diction can be seen and are shown in Figure 3, 4 and 5.
On polynomials, experiments that were con-ducted illustrate the inverse curve between actual and predicted it taken based on experiments with the smallest error without considering other aspec-ts. In the linear kernel, making the conclusion of an Input Neuron [Production Data 2005-2013] Hidden Neuron [5, 10 and 15] Output Neuron [Prediction of Production]
Figure 2. ANN architecture
TABLE1
MSEAND R2ON THE KERNEL RESPECTIVELY
Kernel MSE R2
Linear 0,10 0,92
Radial Basis Function 0,06 0,95 Polynomial 0.18 0,62
experiment series was also based on the value of the smallest error. From the comparison of linear and polynomial kernels, the linear is more optim-um. The results caused some experienced over-fitting data.
From the experiment, prediction models that showed the highest correlation level and the lowest value of error was the one that was done by using RBF kernel. This is appropriate with SVM guide that states RBF kernel is more superior in many ca-ses of machine learning [28].
Experiment of ANN
ANN experiment was done by using the same data based on 32 data points and Hidden Neuron com-parison with a learning rate of 4 cross validation. Moreover, the experiments were comprised of 12 ANN models. Table II and III showed the charac-teristics and specifications that were used for ANN architecture and the best experiments result, res-pectively.
From Table 3, it can be seen that the experi-ment that used ANN had the best model. It was known from the 8th experiment that the ANN has a
determination coefficient value of 74% and error value of 9%. Likewise, for the second experiment, it had the lowest error value between among other experiments with 8%. However the second experi-ment only has a determination coefficient of 43%. Therefore, from the result of best 𝑅𝑅2and best MSE, it can be concluded that the 8th experiment with
hidden neuron 20 and learning rate 0.1 was the best model of a series model which was produced to predict the relationship between observed data and 0.9 0.8 0.7 0.6 0.5 0.4 0.3 0.2 0.1 0.0 63 56 49 42 35 28 21 14 7 1 70 Index Da ta Variable Actual Linear
Figure 3. Comparison of linear kernel prediction result with observation on the production of oil palm in normal
form Variable Actual Polynomial 0.75 0.50 0.25 0.00 -0.25 -0.50 63 56 49 42 35 28 21 14 7 1 70 Index Da ta
Figure 5. Comparison of polynomial kernel prediction result with observation on oil palm production in normal
form TABLE2
CHARACTERISTIC AND SPECIFICATION USED
Characteristic Specification Architecture 1 hidden layer Hidden Neuron 2, 10, 20 and 30
Neuron Output 1 (Prediction Production of Palm Oil)
Activation Hidden Layer
Sigmoid Binary Activation Output Linear Galat Consideration 0,001
Learning Rate 0,3; 0,1 and 0,01 Maximum Epoch 1000
TABLE3
THE BEST EXPERIMENT RESULT OF ANN MODEL
Try Hidden Neuron Learning Rate R 2 MSE 1 2 0,3 0,57 0,11 2 2 0,1 0,43 0,08 3 2 0,01 0,66 0,10 4 10 0,3 0,49 0,14 5 10 0,1 0,62 0,15 6 10 0,01 0,51 0,31 7 20 0,3 0,53 0,12 8 20 0,1 0,74 0,09 9 20 0,01 0,44 0,13 10 30 0,3 0,63 0,17 11 30 0,1 0,50 0,22 12 30 0,01 0,69 0,19 Variable Actual RBF 0.9 0.8 0.7 0.6 0.5 0.4 0.3 0.2 0.1 0.0 63 56 49 42 35 28 21 14 7 1 70 Index Da ta
Figure 4. Comparison of RBF kernel prediction result with observation on oil palm production in normal form
February 2016
best model of ANN. This can be seen at time series Figure 6 plot and scatter plot Figure 7.
Performance Comparison between SVR and ANN
From the experiment, the method that produced the best model for oil palm production is the SVR mo-del. The model has a determination coefficient of 95% and error value of 6%. From the percent-age, it can be seen that the two methods produced very much differences on value R2.
Prediction of Best Model
From the best SVR model the prediction result that was obtained for three years ahead can be describe-ed basdescribe-ed on estimatdescribe-ed actual data prdescribe-ediction and oil palm production prediction in the next year.
Figure 9 shows that the average increase for each recording period is 3%-6% in normalization form. It will have the same pattern for year 2017, if the pattern data used are still the same as the actual data and the prediction results. Nature is not a fac-tor that will be used as references in this study. The
factors that will be used as references in this study is only based on the final data.
4. Conclusion
From the conducted research, it can be concluded that SVR model is better than ANN model for oil palm production prediction’s case in Riau. ANN Model got the best value of determination coeffici-ent (𝑹𝑹𝟐𝟐) 74% with galat error 9% on the 8th
experi-ment, while SVR on the RBF kernel produced a smaller error i.e. 6% and also a bigger 𝑹𝑹𝟐𝟐 i.e. 95%. A very huge difference of determination coefficient value proved that by using time series data, SVR model is more superior compared to ANN model. Prediction results for next three years gradually in normal form as many as 3%-6%. Prediction results do not reckon the nature or other factors in the field that could affect production in each period. Variable Actual ANN-8 0.9 0.8 0.7 0.6 0.5 0.4 0.3 0.2 0.1 0.0 63 56 49 42 35 28 21 14 7 1 70 Index Da ta
Figure 6. Time graph series comparison between actual data and result of best ANN model prediction
0.8 0.6 0.4 0.2 0.0 0.7 0.6 0.5 0.4 0.3 0.2 0.1 0.0 ANN-8 Ac tu a l
Figure 7. Regression graph that is produced by the ANN model for actual data and prediction
Figure 8. The best model comparison between SVR and ANN that is shown in size of correlation coefficient and
MSE 0.0 0.1 0.2 0.3 0.4 0.5 0.6 0.7 0.8 0.9 1.0 SVR ANN P er ce n ta g e Models
Determination Coeffitient MSE
Variable Actual RBF Model 2014 2015 2016 0.9 0.8 0.7 0.6 0.5 0.4 0.3 0.2 0.1 0.0 63 56 49 42 35 28 21 14 7 1 70 Index Da ta
Figure 9. Comparison graph between actual data and RBF model and oil palm production prediction for 3 years
References
[1] Riau Central Bureau of Statistics (BPS). “Ri-au in Figures of 2006-2013 (Riau dalam
Ang-ka 2006-2013) and District in Figures of
2006-2013 (Kabupaten Dalam Angka
2006-2013)”, 2013.
[2] Elinur,“Analysis of Energy Consumption and Supply in Indonesian Economy (Analisis Ko-nsumsi dan Penyediaan Energi dalam
Pere-konomian Indonesia)”, Master Thesis,
Facul-ty of Mathematics and Natural Sciences, Ins-titut Pertanian Bogor, Indonesia, 2011. [3] A.R. Pudyantoro,“Effects of Fiscal Policy
and The Economy Gas Upstream Sector in Riau Province (Dampak Kebijakan Fiskal dan Sektor Hulu Migas Terhadap
Perekono-mian Provinsi Riau)”, Master Thesis,
Facul-ty of Agricultural Technology, Institut Per-tanian Bogor, Indonesia, 2012.
[4] E. Mahajoeno, “Development of Renewable Energy from Waste Liquid Palm Oil Mill ( Pe-ngembangan Energi Terbarukan Dari
Lim-bah Cair Pabrik Minyak Kelapa Sawit)”.
Master Thesis, Faculty of Agri-cultural Tech-nology, Institut Pertanian Bogor, Indonesia, 2008.
[5] Saepudin, “Renewable Energy (Biogas) from Palm Oil Waste. Research Center for Electric Power and Mechatronics (Energi Terbarukan (Biogas) dari Limbah Kelapa Sawit. Pusat
Penelitian Tenaga Listrik dan Mekatronik)”.
Indonesia Institution of Science, 2010.
[6] D. Partogi, M.N. Amin, and S.T. Kasim, “Analysis Electricity Production Cost Per KWh Using Liquid Waste Biogas Fuels Oil Palm (PKS PLTBGS Tandun Application)
(Analisis Biaya Produksi Listrik Per KWh Menggunakan Bahan Bakar Biogas Limbah Cair Kelapa Sawit (Aplikasi pada PLTBGS
PKS Tandun)”. Singuda Ensikom. 3 (1):
17-22, 2013.
[7] M.S. Nur, “Characteristics of Palm Oil As Raw Materials Bioenergy (Karakteristik
Ke-lapa Sawit Sebagai Bahan Baku Bioener-gi)”,
San Design, Bogor, 2014.
[8] Mustakim, “Support Vector Regression and Multi-Attribute Decision Making for Produc-tivity Prediction and Regional Renewable Energy Development Ranking (Support Vec-tor Regression dan Multi-Attribute Decision Making untuk Prediksi Produktifitas dan Pe-rankingan Wilayah Pengembangan Energi
Terbarukan)”. Master Thesis, Faculty of
Ma-thematics and Natural Sciences, Institut Per-tanian Bogor, Indonesia, 2015.
[9] B. Sunarwan, and R. Juhana, “Utilization of Waste Oil for Fuel and Renewable Energy
(Pemanfaatan Limbah Sawit untuk Bahan
Bakar Energi Baru dan Terbarukan)”, Jurnal
Tekno Insentif Kopwil 4. 7(2): 1-14, 2013.
[10] D. Kusdiana, “Real conditions of Energy Re-quirements and Sources of Renewable Alter-native Energy in Indonesia (Kondisi Rill Ke-butuhan Energi di Indonesia dan
Sumber-sumber Energi Alternatif Terbarukan)”.
Ge-neral of Electricity and Energy Utilization Department of Energy and Mineral Resour-ces, 2008.
[11] R.W.P. Hermantoro, “Palm Oil Production Based on Prediction of Soil Quality Using Ar-tificial Neural Model Network (ANN) ( Pred-iksi Produksi Kelapa Sawit Berdasarkan Ku-alitas Lahan Menggunakan Model Artificial
Neural Network (ANN))”. Jurnal
Agrotekno-se. 4(2), 2009.
[12] C. Christodoulos, “Forecasting with limited data: Combining ARIMA and diffusion mo-dels”, Technological Forecasting & Social
Change. 77 (2010) 558–565, 2010.
[13] M. A. Agmalaro, “Statistical Downscaling GCM Data Modeling Using Support Vector Regression to Predict Monthly Rainfall in Indramayu (Pemodelan Statistical Down-sca-ling Data GCM Menggunakan Support Vect-or Regression untuk Memprediksi Curah
Hu-jan Bulanan Indramayu)”, Master Thesis,
Fa-culty of Mathematics and Natural Sciences, Institut Pertanian Bogor, Indonesia, 2011. [14] V.R. Patel, and R.G. Mehta, “Impact of
Out-lier Removal and Normalization Approach in Modified K-Means Clustering Algorithm”. IJCSI International Journal of Computer Sci-ence Issues. 8(5), 2011.
[15] E. Piantari, “Hyperspectral data Feature Se-lection for Rice Productivity Prediction with Genetic Algorithm Support Vector Regres-sion (Feature Selection Data Hiperspektral Untuk Prediksi Produktivitas Padi dengan Algoritme Genetika Support Vector Regres-sion)”, Essay, Faculty of Mathematics and Natural Sciences, Institut Pertanian Bogor, Indonesia 2011.
[16] N. Ibrahim, and A. Wibowo, “Support Vec-tor Regression with Missing Data Treatment Based Variables Selection for Water Level Prediction of Galas River in Kelantan Malay-sia”. Wseas Transactions on Mathe-matics. 13(1), 2014 E-ISSN: 2224-2880, 2014. [17] J. F. De Paz, B. Pérez, A. González, E.
Cor-chado, and J. M. CorCor-chado, "A support vector regression approach to predict carbon dioxide exchange," in Distributed Computing and Ar-tificial Intelligence. Springer Science + Busi-ness Media, 2010, pp. 157–164.
[18] Smola, B. Schölkopf, “A Tutorial on Support Vector Regression: NeuroCOLT, Technical
February 2016
Report NC-TR-98-030”, Royal Holloway
Co-llege, University of London, UK, 2003.
[19] Santosa, “Data Mining Techniques Use of Data for Business Purposes (Data Mining Teknik Pemanfaatan Data untuk Keperluan
Bisnis)”, Graha Ilmu, Yogyakarta, 2007.
[20] V. Sharma, “A comprehensive Study of Arti-ficial Neural Network”, International Journal of Advanced Research in Computer Science and Software Enginering India, 2012. [21] J.K. Siang, “Artificial Neural Network and Its
Programming using MATLAB (Jaringan Sa-raf Tiruan dan Pemrogramannya
Mengguna-kan MATLAB)”, ANDI, Yogya-karta, 2004.
[22] S. Kusumadewi, and S. Hartati, “A Neuro-Fuzzy Integration of Neuro-Fuzzy system and Neu-ral Network (NEURO-FUZZY Integrasi
Sis-tem Fuzzy dan Jaringan Saraf)”, Graha Il-mu,
Yogyakarta, 2006.
[23] D.O. Maru'ao, 2010, “Neural Network Imple-mentation in Foreign Exchange Kurs Predic-tion”, International Seminar Information Te-chnology, 2010.
[24] A.A. Adebiyi, A. Charles, A. Marion, S. Oto-kiti Sunday, “Stock Price Prediction using Neural Network with Hybridized Market
Indicators”. Journal of Emerging Trends in
Computing and Information Sciences. 3(1):
1-9, 2012.
[25] G. Adhani, A. Buono, A. Faqih, “Support Vector Regression modelling for rainfall pre-diction in dry season based on Southern Os-cillation Index and NINO3.4”, International Conference on Advanced Computer Science
and Information Systems. 2013: 315-320,
2013.
[26] H. Gunawan, “Hyperspectral Band Selecti-on Using the Recursive Feature Elimination for Rice Production Prediction using Support Vector Regression (Seleksi Hyperspectral Band Menggunakan Recursive Feature Eli-mination untuk Prediksi Produksi Padi
de-ngan Support Vector Regression)”, Essay,
Faculty of Mathematics and Natural Sciences, Institut Pertanian Bogor, Indonesia, 2012. [27] Hsu in R. Hidayat, “Toddler Nutrition Status
System Prediction Using Support Vector Re-gression (Sistem Prediksi Status Gizi Balita dengan Menggunakan Support Vector
Regre-ssion)”, Essay, Faculty of Mathematics and
Natural Sciences, Institut Pertanian Bogor, Indonesia, 2013.