Material Management using Selective Inventory
Control and ARIMA Methodology in a Manufacturing
Industry
Hitesh Vasudev
1,Gurbhej Singh
2Department of mechanical engineering, Punjab Institute of Technology, Hoshiarpur. Department of mechanical engineering, Punjab Institute of Technology, Bhikhiwind.
Email: [email protected], [email protected].
Abstract-The manufacturing industry has gone through significant changes in the last decade. Competition has
increased dramatically. Inventory control is a critical aspect of successful management and today it is the major thrust area for increasing productivity. Due to some reasons, different Inventory control tools have not been fully exploited in Indian SMEs. In the present work an attempt has been made to implement inventory control techniques like Combined Cost Matrix of ABC and HML analysis at Mahindra & Mahindra Swaraj Mazda Ltd. Asron, which is an automotive manufacturing company. The Bill of Materials for its T-3500 Truck has been taken and Combined Cost Matrix of ABC and HML analysis has been done on the 800 items. Sigma level of the supplied goods on the basis of quality is calculated, which comes out to be 3.48. Use of Bar Coding for fast and accurate data entry along with savings in labour cost to has been introduced. To insure the smooth manufacturing activities with minimum inventory, the accurate demand forecasting has been done using “ARIMA” methodology.
Key words: SME’s, ARIMA,inventory control, EOQ.
1. INTRODUCTION
Inventory means a stock of physical commodity required to meet the future demand. The inventory includes stock of raw materials, tools, finished and/or semi – finished products and spare parts etc. In Though an inventory material is an idle resource, every business has to maintain it for efficient and smooth working of its operations[1]&[2] Computerization of Inventory, to create data base of the stacked items in a systematic order. Many types of useful information can be pulled out by creating appropriate quarries[3].Economic Ordering Quantity (EOQ), Material Requirement Planning (MRP) and Scheduling Methods like Shortest Processing Time (SPT), Earliest Due Date (EDD) etc. are used for inventory control[4].It has been concluded that Quality Improvement and Continuous Supplier Control were of paramount importance in Inventory Management[5]. Authors proposed an integer programming model to select vendors and determine the order quantities [6].Roodhooft and Koning ] proposed a Vender selection, based on the Weighted Point Plan, which consisted of stipulating number of criteria, giving them different weights and selecting the supplier with the best weighted total score[7].ARIMA Models has been to Predict Next-Day Electricity Prices. Price forecasting has become increasingly relevant to producers and consumers in the new competitive electric power markets[8]. It has been studied that Very Short-
Term Load Forecasting Based on ARIMA Model and Intelligent Systems like Artificial Neural Networks techniques for load demand forecasting in distribution substations[9].El Hag used adjusted ARIMA for the forecasting of internet traffic The AARIMA model was suggested to give a quick and simple way to model Internet traffic by retaining all the properties of the ARIMA models while capturing the self-similarity[10].
2. METHODOLOGY
BOM for the Truck T 3500 is taken. After omitting the M standard items, 800 items were taken for ABC and HML Analysis.ABC and HML Analysis were done for 800 items. Then combined cost matrix of ABC and HML analysis was also done to overcome short comings of single criteria ABC analysis. Actual sales data were arranged to find accurate demand forecast for the product. Demand forecasting was done using ARIMA methodology and results compared with the actual sales. Data for defective components supplied in a particular period was gathered to calculate sigma level for the supplied goods. Data on the workers working for data entry purposes was gathered to calculate the benefits of the application of Bar Coding system in the Stores.
Fig.1 ABC analyses of materials
.
A Class items Just 10% of the total items consume 77.37% of the total Inventory cost.B Class items , the next 10% of the total items consume 10.29 % of the total Inventory cost. C Class items remaining 80% of the total items consume about 12.34% of the total Inventory cost .A Class items consume 77.37% 0f the total value of the stock. If the company keeps tight control over this class of items, the problem of excess monthly Inventory can be solved to the large extent. For A class items orders should be frequent and smaller.
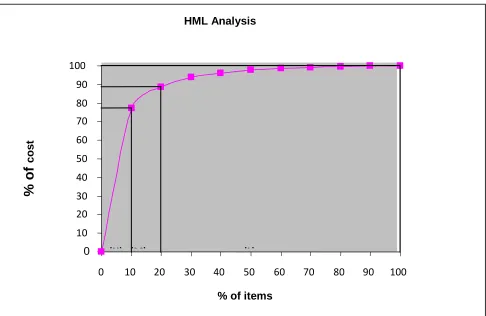
3.2 HML (High, Medium, and Low Value) Analysis:
Sometimes ABC analysis is not sufficient for the materials to reduce the cost of inventory, because some high individual cost items fall in C or B class of ABC analysis. This happens because the consumption of such items is low; although the items are precious they fall in C or B class. According to rule of ABC analysis, company needs to purchase in bulk of C class items, if company did this then high inventory will be blocked. In order to avoid such a situation we need to do HML analysis to support ABC analysis to find out precious items. High Value Items First 10% items are high value items. These items consume 77.34% of the total inventory cost. However ‘A’ Class items of ABC Analysis with item no 9, 141, 680, 684, 687 and 1394 appear as ‘M’ Class items in HML Analysis & item no.1395 as Low value item. Medium
Value Items 10% items are medium value items. These items consume 11.20% 0f the total cost. However ‘B’ Class items of ABC Analysis having no.60, 70, 91, 211, 238, 499 and 841, appear as ‘H’ Value items in HML Analysis. Item no. 20, 201, 219, 498, 796, 1026, 1027, 1042 and1043 appear as Low value items in HML analysis.Low Value items remaining 80% of items consume only 11.37% of the cost. However ‘C’ Class items of ABC Analysis such as item no 5, 329, 460, 983,1048,1049,1161 appear as ‘M’ Class items in HML Analysis. So company needs to keep the strict control while purchasing these items, in spite of their being ‘C’ Class items.
Results of HML Analysis showed ‘A’ Class items of ABC Analysis with item no 9, 141, 680, 684, 687 and 1394 appear as ‘M’ Class items in HML Analysis. A Class item no.1395 of ABC analysis appears as Low value item. The ‘C’ Class items of ABC Analysis such as item no 5, 329, 460, 983, 1048, 1049, and 1161 appear as ‘M’ Class items in HML Analysis. This vindicates that HML Analysis removes the short comings of the ABC Analysis.
3.3 ARIMA or Box- Jenkins Model Building Strategy
using EViews 7 & JMulTic Software.
Step –I the order of integration is tested for our
monthly series on the variable, i.e. sales. Augmented Dickey Fuller statistics is applied to
ABC analysis
0
1
0
20
30
40
50
60
70
80
90
100
110
120
0
10
20
30
40
50
60
70
80
9
100
110
120
% of items
%
o
f
to
ta
l
c
o
s
Fig.2 HML Analysis
check the stationary of the series. Initially the test has been applied upon zero order of integration, i.e. sales at levels. The observed value of test statistics is -1.422 with p value of 0.5712.Hence the observed value is statistically insignificant and thus, reveals the presence of unit root in level series. To solve the problem of unit root the series of sales is differenced
at first level. Hence the following operation is applied.
Sales = Sales t – Sales t-1--- (i)
After differencing once, as defined in model – (i) we check again the presence of unit root by applying ADF test statistics. At first difference, the observed
value of ADF test statistics is 11.770 with a p value of 0.000.Hence the observed statistics is –ve and significant, Thus satisfying the condition of stationery at first order of integration. Therefore in our ARIMA process the order of integration for the variable sales would be 1.
Step – II: Involves examination of the order of Auto
regression (AR) and Moving Average (MA) terms. Three different information criteria are applied to check the order of ARIMA terms. These criteria are (i) AKaike information criteria (ii) Hannan-Quinn Criteria and (iii) Schwarz criteria.
TABLE 1 Observed values of the order of AR (p) and MA (q)
Lag selection for AR and MA terms
Information criterion
Order of AR term
Order of MA term
AIC
3
3
H-Q
2
3
SC
2
3
Source: Author’s calculations
(H) (M) (L)
HML Analysis
0
10
20
30
40
50
60
70
80
90
100
0
10
20
30
40
50
60
70
80
90
100
% of items
%
o
f
c
o
s
Table 2 Point estimates of ARIMA model used to forecast future sale
From table 1 it is evident that maximum lag of AR terms suggested by AIC criteria is 3 whereas from MA terms, all the three information criteria are providing the same order i.e. q = 3. Thus for forecasting purpose we finalize an ARIMA process of the order 3, 1, 3 i.e. ARIMA (3, 1, 3)
Step-III The third step in ARIMA based
forecasting is the estimation of ARIMA model, defined above for the variable i.e. sales
In the estimated model given in the table 2 the ARIMA coefficient appearing with ** and *** are statistically significant at 5% and 1% level of significance, respectively. On the basis of this estimated model, the future values of the sales can be forecasted. Table 3 provides 40 months forecast
of sales with respective confidence intervals and standard errors. Confidence intervals of forecast values signifies that the sales value of given month can fluctuate in between lower and upper bound values confidence intervals. However the estimatedforecasts have been given by the column
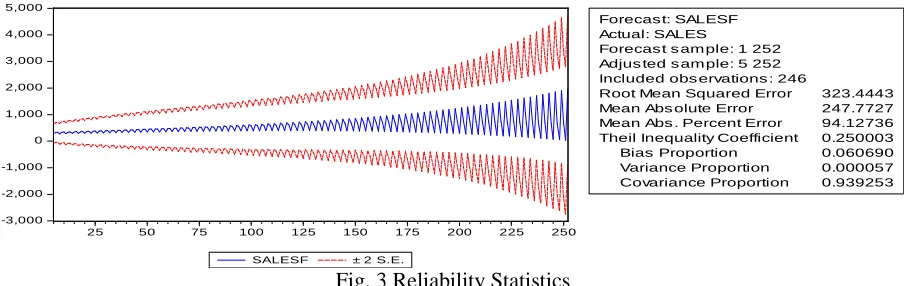
STEP IV: The final step in forecasting step is to
check the reliability of forecasted estimate. Fig. 3 provides the reliability statistics of the forecasted values, and also of Theil’s inequality coefficient. The observed value of this coefficient is 0.25 which is statistically insignificant. Therefore it supports the inference that the observed forecast values of sales are realistic enough for policy planners.
Fig. 3 Reliability Statistics
-3,000 -2,000 -1,000 0 1,000 2,000 3,000 4,000 5,000
25 50 75 100 125 150 175 200 225 250
SALESF ± 2 S.E.
Forecas t: SALESF Actual: SALES
Forecas t s am ple: 1 252 Adjus ted s am ple: 5 252 Included obs ervations : 246
Root Mean Squared Error 323.4443
Mean Abs olute Error 247.7727 Mean Abs . Percent Error 94.12736 Theil Inequality Coefficient 0.250003 Bias Proportion 0.060690 Variance Proportion 0.000057 Covariance Proportion 0.939253
Point estimates of ARIMA Model
Regression
Coefficient
F-Ratio
P-Value
Constant
AR1
AR2
AR3
MA1
MA2
MA3
2.313
-1.012***
-0.989***
-0.005
-0.186
-0.149**
0.640***
2.699
0.127
0.120
0.108
0.115
0.075
0.074
0.392
0.000
0.000
0.963
0.105
0.048
0.000
Note: I) *** and ** represent significant at 1% 5% levels respectively.
[image:4.595.73.525.615.758.2]3.4The following are some of the benefits of the
Bar Code data entry system. Scope of Barcode in SML’s stores
The Scope of Bar Code in SML’s stores is simply tremendous. Bar Code System is a fool proof System. For improving the existing system of stores, there must be information sharing between all departments and stores which issue the materials. For example if production department wants item having number x120 then person needs to feed it in the computer, this request will go to the stores. When the person from the production department collects item having number x120 then the item will be issued after scanning the barcode and this code will be compared with the requirement of production department. If there is any mismatch and store person tries to issue the item number y120 instead of x120 then the computer will not permit it and display a warning. Also computer cannot manipulate the number while entering it, because it will be scanned from the bar code.
3.4.1Reduction in the no .of data entry workers,
when Bar Coding system is used.
Replacement of the Cardex system with the Bar Coding system can greatly reduce the labour involved in the data entry work. Cardex system requires posting of data from the cards to the Computer manually. Whereas, the Bar Coding system enters data in to the computer without using key board. Further Clubbing of activities of stores with adjoining venues is also possible. Main Store and Consumables Stores are in adjacent venues; their activities can be clubbed. Similarly Rejection Stores and Receipt Stores are also in adjoining venues; their activities too can be combined. As a rough rule we can safely reduce the strength of the data entry workers by half. One Bar Code system can replace 3 most efficient data entry workers. In all we can remove five data entry workers from all the stores very safely.
3.4.2 Cost-Benefit Analysis:
Costs Involved:For implementation of Bar Code system in the SML, it needs 4 sets of Barcode printer, scanner and software.
3.4.3 Benefits:
1. Saving on labour = (40,000 + 11000-1000) = Rs.50, 000 per month.
2. Fast and reliable data collection from the system.
3. Solving the problem of wrong issuing of materials.
4. It will check the status of the materials within a fraction of time.
5. Instead of twelve workers seven will be sufficient
6. Total Investments can be recovered in one and a half years’ time.
4. CONCLUSION
Category “AH” comprises of 73 items that account for 75% of the total cost. This group consists of items that have high usage value and high individual cost. Stringent control & frequent ordering is the appropriate technology to minimize the Inventory cost incurred on these items. Category “BH” comprises of 08 items that account for 1.6 % of the total cost. Although consumption value of these items is very small, none the less these items are important. Quality Sigma level of the material supplied by the suppliers is 3.48. Bar Coding makes data entry very fast, accurate and reliable. Also reduces labour costs to the tune of Rs. 50,000/month. The system pays for itself in one and a half years’ time. Accurate demand forecasting by ARIMA methodology is done.
REFERENCES
[1]. Singh, Bhardwaj, Arvind and Sachdeva (2007) .The Impact of ISO Implementation on Output Parameters in SME's in India. PICMET 2007 Proceedings, 5-9 August, Portland, Oregon – USA pp 2030-2037.
[2]. Bulinskaya (2003) .Inventory control and investment policy.Int. J. of Production Economics, Vol.81–82 pp309-316.
[3]. Desai,Tushar and Shrivastava (2008). Six Sigma: A Break through Business Improvement Strategy for Achieving Competitive Advantage – A Case Study.First International Conference on Emerging Trends in Engineering and Technology, pp777-780. [4]. Desai Abhyuday and Yang (2003). Effect of
Activity Scheduling and Inventory Control: An Experimental Investigation for PC Assembly.Journal of the Chinese Institute of Industrial Engineers, Vol. 20 No. 3, pp. 282-294
[5]. Reynolds (1989) “An Improved Vendor Quality Control (VQC) Method’ IEEE Proceedings South east con. pp 338-341 [6]. Weber, Charles, Current and Desai. (1998)
.Non-cooperative negotiation strategies for vendor selection” European Journal of OperationalResearch, 108, 208-223.
[7]. Roodhooft, Filip and Jozef. (1996) .Vendor selection and evaluation an activity based costing approach” European Journal of Operational Research,96, 97-102
on Systems, Man and Cybernetics (SMC 2008) pp3280-3285
[9]. Desai,Tushar and Shrivastava (2008) ,Six Sigma: A Break through Business Improvement Strategy for Achieving Competitive Advantage – A Case Study. First International Conference on Emerging Trends in Engineering and Technology, pp777-780. [10]. Kumar (2009),Selective Inventory Control by