Drug Design, Development and Therapy
Dove
press
O r i g i n a l r e s e a r c h
open access to scientific and medical research
Open access Full Text article
an optimized probucol microencapsulated
formulation integrating a secondary bile acid
(deoxycholic acid) as a permeation enhancer
armin Mooranian1
rebecca negrulj1
nigel chen-Tan2
gerald F Watts3
Frank arfuso4
hani al-salami1
1Biotechnology and Drug
Development research laboratory, school of Pharmacy, curtin health innovation research institute, Biosciences research Precinct, curtin University, 2Faculty of science and
engineering, curtin University, 3school
of Medicine and Pharmacology, royal Perth hospital, University of Western australia, 4school of Biomedical
science, curtin health innovation research institute, Biosciences research Precinct, curtin University, Perth, australia
Abstract: The authors have previously designed, developed, and characterized a novel microencapsulated formulation as a platform for the targeted delivery of therapeutics in an animal model of type 2 diabetes, using the drug probucol (PB). The aim of this study was to optimize PB microcapsules by incorporating the bile acid deoxycholic acid (DCA), which has good permeation-enhancing properties, and to examine its effect on microcapsules’ morphol-ogy, rheolmorphol-ogy, structural and surface characteristics, and excipients’ chemical and thermal compatibilities. Microencapsulation was carried out using a BÜCHI-based microencapsulating system established in the authors’ laboratory. Using the polymer sodium alginate (SA), two microencapsulated formulations were prepared: PB-SA (control) and PB-DCA-SA (test) at a constant ratio (1:30 and 1:3:30, respectively). Complete characterization of the microcapsules was carried out. The incorporation of DCA resulted in better structural and surface characteris-tics, uniform morphology, and stable chemical and thermal profiles, while size and rheological parameters remained similar to control. In addition, PB-DCA-SA microcapsules showed good excipients’ compatibilities, which were supported by data from differential scanning calorimetry, Fourier transform infrared spectroscopy, scanning electron microscopy, and energy dispersive X-ray studies, suggesting microcapsule stability. Hence, PB-DCA-SA microcapsules have good rheological and compatibility characteristics and may be suitable for the oral delivery of PB in type 2 diabetes.
Keywords: artificial cell microencapsulation, diabetes, bile acids, probucol, antioxidant, anti-inflammatory, BÜCHI B390
Introduction
Diabetes mellitus is a metabolic disorder classified as type 1 diabetes or type 2 diabetes
(T2D).1,2 Type 1 diabetes is an autoimmune disease marked by the destruction of
β-cells of the pancreas, resulting in a partial or complete lack of insulin production and
the inability of the body to control glucose levels.3 T2D develops due to genetic and
environmental factors that lead to tissue desensitization to insulin.4 Current therapies
are aimed at resolving the persistent hyperglycemia by increasing available insulin or
improving tissue sensitivity.5,6 However, damage of pancreatic β-cells and the build-up
of free radicals and toxins, together with persistent inflammation, remain detrimental
in diabetes treatment and long-term prognosis.7
There is growing evidence for the use of antioxidants as adjuncts in the treatment
of T2D.8–10 Probucol (PB) is a drug that was initially developed to treat hyperlipidemia,
but its strong anti-inflammatory and antioxidant properties have made it a potential
therapeutic agent in the treatment of T2D.11,12 In addition, PB has shown a protective
effect on pancreatic β-cells.13,14 It is highly lipophilic and accumulates extensively
correspondence: hani al-salami school of Pharmacy, curtin University, gPO Box U1987, Perth, Wa 6845, australia
Tel +61 8 9266 9816 Fax +61 8 9266 2769
email [email protected]
Journal name: Drug Design, Development and Therapy Article Designation: Original Research
Year: 2014 Volume: 8
Running head verso: Mooranian et al
Running head recto: Novel DCA–probucol microcapsules for type 2 diabetes treatment DOI: http://dx.doi.org/10.2147/DDDT.S68247
Drug Design, Development and Therapy downloaded from https://www.dovepress.com/ by 118.70.13.36 on 22-Aug-2020
For personal use only.
This article was published in the following Dove Press journal: Drug Design, Development and Therapy
29 September 2014
Dovepress
Mooranian et al
in adipose tissues.15 PB has very low bioavailability but its
pharmacokinetic and pharmacodynamic parameters show
great variation between individuals.16,17 Thus, the low and
variable oral bioavailability and the non-linear distribu-tion and clearance of PB contribute to the variability in its
efficacy as well as its side effects.9,18 So, despite the huge
potential of PB in T2D, its variable and poor kinetics remain
major obstacles to its clinical use.9 Designing a novel and
stable formulation with good rheological parameters and permeation-enhancing properties is anticipated to overcome these obstacles. This can be achieved by incorporating a bile acid with permeation-enhancing characteristics, such as
deoxycholic acid (DCA),19 in a novel delivery system using
artificial cell microencapsulation technology.
Artificial cell microencapsulation is commonly used to improve the delivery of lipophilic drugs that exhibit low
bioavailability and poor dissolution and absorption kinetics.20
It encapsulates a drug using a biodegradable polymer such as sodium alginate (SA), which protects the drug and provides a pH-sensitive targeted delivery after oral administration. The choice of polymer has a significant impact on the formula-tion properties and efficacy as well as on the drug’s chemical
and thermal characteristics.21 Previous work by the authors’
research group19,20,22–27 on the formulation of the antidiabetic
drug gliclazide, alone or combined with bile acids (in vitro and in vivo), and their recently designed and formulated microcapsule platform have demonstrated improved tar-geted delivery when using an SA-based formulation. Thus, this study aimed to examine the potential of these newly developed microcapsules in producing a novel and stable PB formulation suitable for oral delivery in T2D through the incorporation of the bile acid DCA.
Materials and methods
Materials
PB (98%), low-viscosity SA (99%), and DCA (98%) were purchased from Sigma-Aldrich Co., (St Louis, MO, USA).
Calcium chloride dihydrate (CaCl2⋅2H2O, 98%) was obtained
from Scharlab S.L (Sentmenat, Spain). All solvents and reagents were supplied by Merck KGaA (Darmstadt, Germany) and were of high-performance liquid chromatography grade and used without further purification.
Drug preparation
Stock suspensions of PB (20 mg/mL) and DCA (1 mg/mL)
were prepared, as previously described,28 by adding the
powder to 10% ultrapure water-soluble gel. The CaCl2
stock solution (2%) was prepared by adding CaCl2 powder
to high-performance liquid chromatography water. All preparations were mixed thoroughly at room temperature, for 4 hours, stored in the refrigerator, and used within 48 hours of preparation.
Preparation of microcapsules
Microcapsules of PB-loaded low-viscosity SA were pre-pared using a BÜCHI-based microencapsulating system (BÜCHI Labortechnik AG, Flawil, Switzerland). Polymer solutions containing SA and PB with or without DCA were made up to a final concentration (of PB-DCA-SA) in a ratio of 1:3:30, respectively. This ratio was based on the authors’
published work29 and was found to exhibit maximum
con-sistency and best morphology. Parameters used include: a frequency range of 1,000–1,500 Hz, air flow of 4 mL/ minute, and a constant air pressure of 300 mbar. Microcap-sules were collected from the microencapsulating system, and for each formulation, three independent batches were
prepared and tested separately (n=3). All microcapsules
(PB-SA-loaded and PB-DCA-SA-loaded) were prepared and treated in the exact same way. Microcapsules were dried by using stability chambers (ACS Environmental and Climatic Test Chamber; Angelantoni Test Technologies Srl, Massa Martana, Italy).
characterization of loaded microcapsules:
morphology, size analysis, and chemical
characterization of microcapsules
All microcapsules were freshly made, stored in the refrigera-tor, and used within 48 hours of preparation. The appearance and size of microcapsules were examined using light micros-copy followed by scanning electron microsmicros-copy (SEM) and energy dispersive X-ray spectrometry (EDS). The particle size distribution and mean particle size diameter were cal-culated using the software provided.
Optical microscopy
Morphological characteristics and particle size analysis were determined with optical microscopy utilizing a YS2-H microscope (Nikon Corporation, Tokyo Japan) mounted with an FMA050 fixed calibrated microscope adaptor (ToupTek Photonics Co., Ltd., Hangzhou, People’s Republic of China). Sample analysis was carried out in triplicate as previously
described.28 Briefly, predetermined quantities (ten
sules from each formulation) of freshly prepared microcap-sules were loaded onto a glass slide mounted to a calibrated scale. Optical microscopy software (ToupTek; ProSciTech, Australia) capable of particle size analysis, microcapsule
Drug Design, Development and Therapy downloaded from https://www.dovepress.com/ by 118.70.13.36 on 22-Aug-2020
Dovepress novel Dca–probucol microcapsules for type 2 diabetes treatment
characterization, and morphological assessments was utilized to determine basic characteristics of the microcapsules to complement the SEM studies.
seM and eDs
The surface morphology of the microcapsules was examined using SEM (Neon 40 EsB; Carl Zeiss Meditec AG, Jena, Germany) with 0.8 nm calibrated resolution. The chemical characterization of the microcapsules was examined using
EDS (INCA® X-Act; Oxford Instruments plc, Abingdon,
UK). The samples were mounted on a glass stub with double-sided adhesive tape and coated under vacuum with platinum (5 nm) in an argon atmosphere prior to examina-tion. Micrographs at different magnifications were recorded to study the morphological and surface characteristics of the microcapsules.
Determination of dispersing media viscosity
Viscosities of both preparations (SA-loaded and PB-DCA-SA-loaded microcapsules) were measured for freshly
prepared mixtures, using 15 mL aliquots (n=3) at room
temperature using a viscometer (Bohlin Visco 88; Malvern Instruments, Malvern, UK).
Differential scanning calorimetric (Dsc) analysis
DSC thermograms of PB, DCA, and low-viscosity SA pow-ders, their physical mixture, and their microencapsulated formulations were carried out in a DSC instrument (DSC 8000; PerkinElmer Inc., Waltham, MA, USA) as previously
described.30 Briefly, 5 mg samples were placed in sealed
aluminum pans and heated at 20°C/minute under a nitrogen
atmosphere (flow rate 30 mL/minute) in the 35°C–240°C
range. An empty aluminum pan was used as a reference. The equipment was calibrated for baseline and temperature with zinc metal.
Fourier transform infrared (FTir) spectral studies
FTIR spectra of pure components, their physical mixture, and the microcapsules were recorded using an attenuated
total reflectance FTIR spectrometer (Spectrum TWO™;
PerkinElmer), and infrared measurements were performed
in transmission in the scanning range of 450–4,000 cm-1 at
room temperature.
statistical analysis
Values are expressed as mean ± standard deviation. Size
measurements were assessed using Student’s t-test. Statisti-cal analysis was done using a two-way analysis of variance,
with Tukey’s honest significant difference post hoc compari-son of means used only when the associated main effect or interaction was statistically significant. The best fit model
was derived using Prism® version 6.0 software (GraphPad
Software, Inc., La Jolla, CA, USA). Statistical significance
was set at P0.05.
Results and discussion
Morphology, size analysis, and chemical
characterization of microcapsules
Microcapsules were obtained using a low-viscosity SA polymer, PB, and DCA at a constant ratio of 30:1:3, respec-tively. Using the microencapsulation system, all microcap-sules were of similar size. The mean diameters ranged from
2,000–2,300 μm for all batches of both formulations, which
suggest they may also be considered as macrocapsules. The mean particle size was not significantly affected by the pres-ence of DCA.
Optical microscopy
Microcapsules obtained from optical microscopy revealed uniform consistency and spherical shaped microcapsules with similar sizes, as determined via a calibrated scale mounted onto a glass slide. Ten microcapsules were selected for particle size and morphological analysis from each formulation and repeated in triplicate. The mean diameter
of PB microcapsules (average ± standard deviation) was
2,150±150 μm, while that of PB-DCA-SA microcapsules was
2,350±90 μm. Figure 1A shows PB-SA microcapsules and
Figure 1B shows PB-DCA-SA microcapsules. L1 shows the microcapsule membrane thickness, L2 shows the horizontal diameter, and L3 shows the vertical diameter. The calibrated optical microscopy size analysis revealed very similar sizes and morphological characteristics between both microen-capsulated formulations, and thus the addition of DCA to PB microcapsules did not adversely affect the size, shape, or characteristics of the microcapsules.
seM
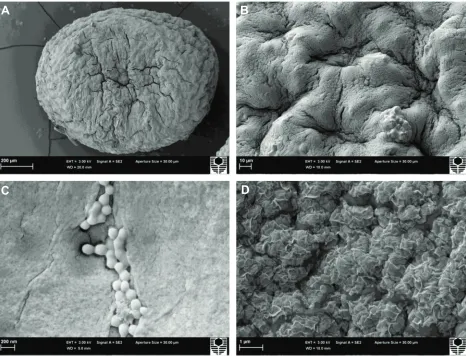
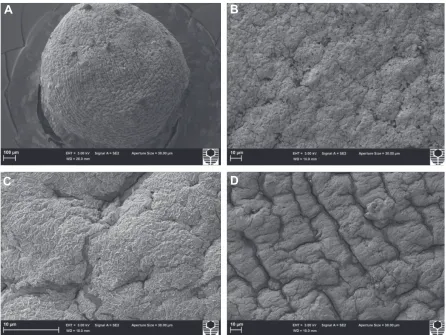
The results from optical microscopy were further comple-mented by SEM data of a PB-SA microcapsule (Figure 2) and PB-DCA-SA microcapsule (Figure 3), which were randomly selected from a few batches. SEM results showed consistently uniform microcapsules with well-defined spherical shapes, and reflect the optical microscopy findings. The microcap-sule size difference between different formulations was not significant, meaning the addition of DCA did not adversely affect the size, morphology, uniformity, and sphericity of
Drug Design, Development and Therapy downloaded from https://www.dovepress.com/ by 118.70.13.36 on 22-Aug-2020
Dovepress
Mooranian et al
A
B
Figure 1 Optical microscopy of PB-sa and PB-Dca-sa microcapsules. Notes: (A) PB-sa microcapsules. (B) PB-Dca-sa microcapsules.
Abbreviations: Dca, deoxycholic acid; l1, outer membrane thickness; l2, horizontal diameter; l3, vertical diameter; PB, probucol; sa, sodium alginate.
A
C
D
B
Figure 2 scanning electron micrographs of a PB-sa microcapsule.
Notes: (A) 200 μm scale. (B) surface morphology at 10 μm scale. (C) 200 nm scale. (D) 1 μm scale. Abbreviations: PB, probucol; sa, sodium alginate.
Drug Design, Development and Therapy downloaded from https://www.dovepress.com/ by 118.70.13.36 on 22-Aug-2020
Dovepress novel Dca–probucol microcapsules for type 2 diabetes treatment
the microcapsules. The microcapsule surfaces were rough but consistent from one microcapsule to another. For PB-SA microcapsules, small crystals were distributed throughout the microcapsule surface (Figure 2C), either as large clumps or smaller groups. These crystals coating the microcapsule surface were believed to be PB, but this was not observed with the PB-DCA-SA microcapsules (Figure 3). They were confirmed to be PB by EDS studies (Figures 4 and 5).
eDs
The surface composition of both PB-SA and PB-DCA-SA microcapsules were analyzed through EDS. This form of analysis allows identification of surface elemental composi-tion, as each element from the periodic table displays unique
EDS patterns.31 Surface crystal depositions and microcapsule
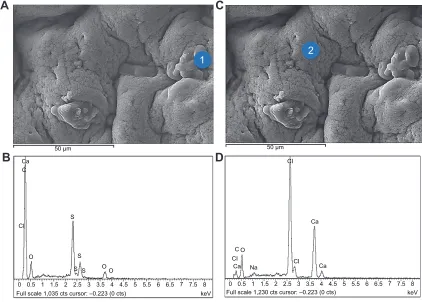
surface composition and characteristics were also evident from this analysis. Figures 4 and 5 show an example of both PB-SA and PB-DCA-SA microcapsule surfaces with the cor-responding surface sites where EDS analysis was conducted. Figures 4A–B and 5A–B show PB deposition on the surface
of the microcapsules, while Figures 4C–D and 5C–D show general surface characteristics of the microcapsules.
EDS examination of crystal depositions on the microcap-sule surfaces (Figures 4 and 5) showed high levels of sulfur atoms, evident as small crystals on the surface of PB-SA (Figures 4A and B) and, to a lesser extent, of PB-DCA-SA (Figures 5A and B) microcapsules. The crystals were from
PB deposition as no other excipient contains sulfur.32–35 The
SEM (Figures 2 and 3) and EDS (Figures 4 and 5) results suggest that PB preferentially coats the microcapsule surface, forming scattered clumps of drug agglomerates distributed around the microcapsule surface. Interestingly, and in line with the authors’ previous studies, DCA seems to reduce the extent of PB surface deposition and the overall poros-ity, thus providing membrane reinforcement and improving
microcapsule integrity.36
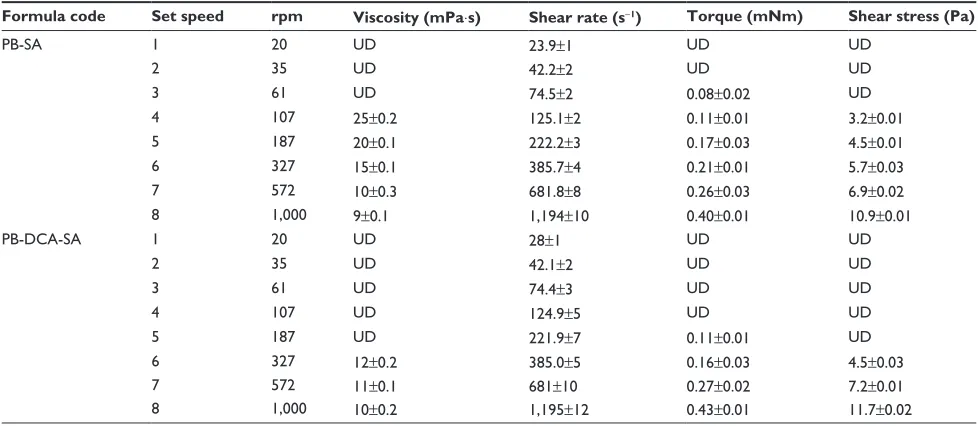
Viscosity of the microencapsulated formulation
Table 1 shows the viscosity, shear rate, shear stress, and torque for both microencapsulated formulations under various
A
B
C
D
Figure 3 scanning electron micrographs of a PB-Dca-sa microcapsule.
Notes: (A) 100 μm scale. (B–D) surface morphology from different angles at 10 μm scale. Abbreviations: Dca, deoxycholic acid; PB, probucol; sa, sodium alginate.
Drug Design, Development and Therapy downloaded from https://www.dovepress.com/ by 118.70.13.36 on 22-Aug-2020
Dovepress
Mooranian et al
A
C
B
50 µmD
50 µmCI
O
S S
S O
O C CI
Ca Na CI
CI
Ca Ca
Ca Ca
C
Ca
Full scale 830 cts cursor: –0.223 (0 cts)0 0.5 1 1.5 2 2.5 3 3.5 4 4.5 5 5.5 6 6.5 7 7.5 8keV Full scale 1,301 cts cursor: –0.223 (0 cts)0 0.5 1 1.5 2 2.5 3 3.5 4 4.5 5 5.5 6 6.5 7 7.5 8keV
1
2
Figure 4 energy dispersive X-ray spectra of PB-sa microcapsules.
Notes: (A and B) PB deposition (indicated by 1) with corresponding analysis. (C and D) surface composition (indicated by 2) with corresponding analysis. Abbreviations: PB, probucol; sa, sodium alginate.
A
C
B
D
2 1
50 µm 50 µm
Full scale 1,035 cts cursor: –0.223 (0 cts)0 keV Full scale 1,230 cts cursor: –0.223 (0 cts) keV
O Ca C
CI
S
S S S
C CI
Ca Na
O
CI Ca Ca CI
OO
0.5 1 1.5 2 2.5 3 3.5 4 4.5 5 5.5 6 6.5 7 7.5 8 0 0.5 1 1.5 2 2.5 3 3.5 4 4.5 5 5.5 6 6.5 7 7.5 8
Figure 5 energy dispersive X-ray spectra of PB-Dca-sa microcapsules.
Notes: (A and B) PB deposition (indicated by 1) with corresponding analysis. (C and D) surface composition (indicated by 2) with corresponding analysis. Abbreviations: Dca, deoxycholic acid; PB, probucol; sa, sodium alginate.
Drug Design, Development and Therapy downloaded from https://www.dovepress.com/ by 118.70.13.36 on 22-Aug-2020
Dovepress novel Dca–probucol microcapsules for type 2 diabetes treatment
speeds (20, 35, 61, 107, 187, 327, 572, and 1,000 rpm). The PB-SA formulation was more viscous, and both formulations
behaved as non-Newtonian fluids under shear stress.37,38 Both
formulations behaved as thixotropic fluids under increasing stress, as evidenced by parallel reductions in their apparent
viscosity.39,40 Increasing speeds resulted in the solutions
forming rapid circular motions away from the origin of the centripetal force, suggesting that both formulations also
behaved in a non-Weissenberg fashion.41,42
Dsc
DSC is commonly used for the thermal characterization
of various materials.43,44 In PB microencapsulation, DSC
measures how physical properties of PB molecules change,
along with temperature, against time.45 This occurs through
determining the temperature and heat flow (35°C–240°C)
associated with PB transitions as a function of time.45 DSC
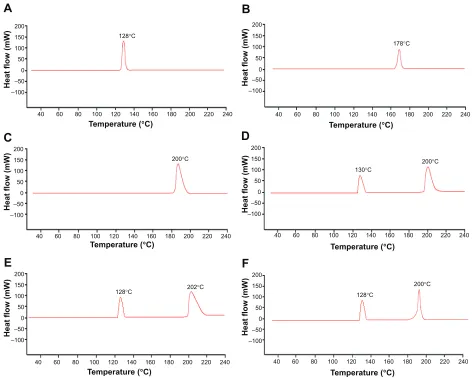
spectra were analyzed for PB powder (Figure 6A), DCA powder (Figure 6B), SA powder (Figure 6C), PB-DCA-SA physical powder mixture (Figure 6D), PB-SA microcapsules (Figure 6E), and PB-DCA microcapsules (Figure 6F).
PB powder analysis (Figure 6A) showed a large
peak at 128°C, which corresponds to the melting point
of PB.45,46 DCA powder analysis (Figure 6B) showed a
small peak at 178°C, which corresponds to the melting
point of DCA.36 SA powder (Figure 6C) showed a large
peak at 200°C, which corresponds to the melting point of
SA.47 PB-DCA-SA physical powder mixture (Figure 6D)
showed only two distinct peaks, one peak at 130°C, which
corresponds to PB, and one at 200°C, which corresponds
to SA. The slight shift to the right in both peaks suggests an increase in the melting point of the combined mixture,
which reflects findings from the authors’ previous work.48
PB-DCA-SA powder analysis only showed two peaks, PB and SA, while the peak that corresponds to DCA was miss-ing, possibly due to a shift in the thermal capacity within the
35°C–240°C range or due to an overlap between DCA and
SA peaks.45 The PB-SA microcapsule (Figure 6E) showed
two peaks – a small peak at 128°C, which corresponds to
the melting point of PB, and a large peak at 202°C, which
corresponds to the melting point of SA – with a slight shift to the right possibly due to ionic interaction between PB and SA post-microencapsulation. The PB-DCA-SA microcapsule (Figure 6F) showed two peaks, similar to the PB-DCA-SA powder mixture (Figure 6D). Overall, DSC analysis showed a transparent and interference-free integration of two prominent peaks – one corresponding to PB and the other to SA, with the possibility of overlap between DCA and SA. There was a noticeable slight shift pre- and post-microencapsulation, which could represent potential chemical interactions between SA and DCA in the microcapsule matrix, alterations in the crystallinity, polymorphism, and plasticization of SA, or a possible
com-bination of factors leading to an endothermic shift.49 Most
importantly, PB did not seem to significantly participate in a crosslinking reaction, and retained its chemical integrity during the microencapsulation process, which is also
sup-ported by the FTIR results (Figure 7).45,46
Table 1 Viscosities and related parameters of both microencapsulated formulations
Formula code Set speed rpm Viscosity (mPa⋅s) Shear rate (s-1) Torque (mNm) Shear stress (Pa)
PB-sa 1 20 UD 23.9±1 UD UD
2 35 UD 42.2±2 UD UD
3 61 UD 74.5±2 0.08±0.02 UD
4 107 25±0.2 125.1±2 0.11±0.01 3.2±0.01
5 187 20±0.1 222.2±3 0.17±0.03 4.5±0.01
6 327 15±0.1 385.7±4 0.21±0.01 5.7±0.03
7 572 10±0.3 681.8±8 0.26±0.03 6.9±0.02
8 1,000 9±0.1 1,194±10 0.40±0.01 10.9±0.01
PB-Dca-sa 1 20 UD 28±1 UD UD
2 35 UD 42.1±2 UD UD
3 61 UD 74.4±3 UD UD
4 107 UD 124.9±5 UD UD
5 187 UD 221.9±7 0.11±0.01 UD
6 327 12±0.2 385.0±5 0.16±0.03 4.5±0.03
7 572 11±0.1 681±10 0.27±0.02 7.2±0.01
8 1,000 10±0.2 1,195±12 0.43±0.01 11.7±0.02
Note: n=3. Data are described as mean ± sD.
Abbreviations: Dca, deoxycholic acid; PB, probucol; sa, sodium alginate; sD, standard deviation; UD, undetected (below the instrument limit of detection).
Drug Design, Development and Therapy downloaded from https://www.dovepress.com/ by 118.70.13.36 on 22-Aug-2020
Dovepress
Mooranian et al
FTir spectral studies
The FTIR method is widely used to stimulate vibrational lev-els of known chemical groups in a molecule, and was used to confirm the chemical compatibility of PB with the SA polymer
and DCA in the microencapsulation formulation.45 In line with
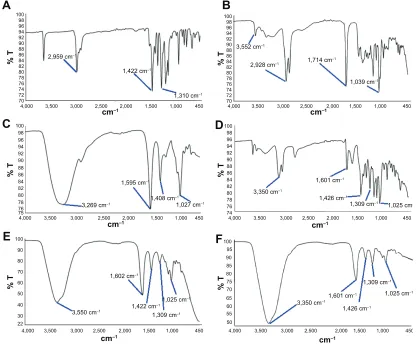
the DSC analysis (Figure 5), FTIR spectra were analyzed for PB powder (Figure 7A), DCA powder (Figure 7B), SA pow-der (Figure 7C), PB-DCA-SA powpow-der (Figure 7D), PB-SA microcapsules (Figure 7E), and PB-DCA-SA microcapsules (Figure 7F). FTIR spectral analysis of individual powders, mixed powders containing all the ingredients, and final microcapsules attained was necessary to ensure the chemical compatibility of PB pre- and post-microencapsulation.
FTIR PB powder analysis (Figure 7A) showed
char-acteristic peaks at 2,959, 1,422, and 1,310 cm-1. DCA and
SA individual powder analysis (Figures 7B and C) showed
similar characteristics to the authors’ published work.27
The PB-DCA-SA physical powder mixture (Figure 7D) showed peaks that correspond to PB, DCA, and SA with no interfer-ence, dilution, or alterations. This confirms compatibility of all the ingredients in the powder form pre-microencapsulation. PB-SA microcapsule analysis (Figure 7E) showed five distinct and interference-free peaks, which correspond to PB and SA
analysis, at 3,350, 1,422, 1,309, 1,602, and 1,025 cm-1. Similar
peaks were noticed after DCA addition, which is in line with the DSC findings (Figure 6), suggesting an interaction between DCA and SA. PB-DCA-SA microcapsule analysis (Figure 7F)
showed three PB peaks (at 3,350, 1,426, and 1,309 cm-1) and
two SA peaks (at 1,601 and 1,025 cm-1), which is in line with
the DSC analysis (Figure 6F).
Overall, FTIR analysis showed compatibility of the for-mulation pre- and post-microencapsulation. The absence of DCA peaks is in line with the DSC analysis (Figure 6) and
the authors’ previously published work,28 and suggests an
A
B
C
D
E
F
Heat flow (mW)
Heat flow (mW)
Heat flow (mW)
200 150 100 50
40 60 80 100 120 140 160 180 200 220 240 40 60 80 100 120 140 160 180 200 220 240
0 –50 –100
200 150 100 50
40 60 80 100 120 140 160 180 200 220 240
40 60 80 100 120 140 160 180 200 220 240 40 60 80 100 120 140 160 180 200 220 240
0 –50 –100
200 150 100 50 0 –50 –100
200 150 100 50 0 –50 –100
Heat flow (mW)
200 150 100 50 0 –50 –100
Temperature (°C)
Temperature (°C)
Temperature (°C) Temperature (°C)
Heat flow (mW)
Heat flow (mW)
Temperature (°C)
128°C
178°C
200°C
200 150 100 50
40 60 80 100 140 160 180 200 220 240
0 –50 –100
Temperature (°C)
130°C
200°C
128°C 202°C 128°C 200°C
120
Figure 6 Differential scanning calorimetric thermograms of the individual powders, mixed powder containing all the ingredients, and microcapsules. Notes: (A) PB powder. (B) Dca powder. (C) sa powder. (D) PB-Dca-sa powder. (E) PB-sa microcapsules. (F) PB-Dca-sa microcapsules. Abbreviations: Dca, deoxycholic acid; PB, probucol; sa, sodium alginate.
Drug Design, Development and Therapy downloaded from https://www.dovepress.com/ by 118.70.13.36 on 22-Aug-2020
Dovepress novel Dca–probucol microcapsules for type 2 diabetes treatment
interaction between DCA and the polymer SA. However, this interaction did not interfere with PB peaks as shown by the chemical (FTIR) and thermal (DSC) analyses. This suggests PB stability pre- and post-microencapsulation, as its chemical composition and structural integrity were maintained when microencapsulated with DCA.
This is a comprehensive study with in-depth in vitro analysis of novel bile acid–PB microcapsules with good potential in the treatment of T2D. A major limitation, and thus future work, is in vivo analysis carried out by adminis-tering these microcapsules to an animal model of T2D and elucidating efficacy and safety profiles.
Conclusion
PB-DCA-SA microcapsules showed good morphology and stability and may be suitable for optimized oral delivery of PB in T2D. A future study may investigate the release kinet-ics and pH-targeted delivery of the microcapsules at various pH and temperature values.
Acknowledgments
The authors acknowledge the Curtin Health Innovation Research Institute at Curtin University, and the Curtin-seeding grant for the support, and also acknowledge the use of equipment and scientific and technical assistance of the Curtin University Electron Microscope Facility, which has been partially funded by the University, State, and Commonwealth Governments.
Disclosure
The authors report no conflicts of interest in this work.
References
1. Barnett R. Historical keyword: diabetes. Lancet. 2010;375(9710):191. 2. Torpy JM, Lynm C, Glass RM. JAMA patient page: diabetes. JAMA.
2009;301(15):1620.
3. Barbeau WE, Bassaganya-Riera J, Hontecillas R. Putting the pieces of the puzzle together – a series of hypotheses on the etiology and pathogenesis of type 1 diabetes. Med Hypotheses. 2007;68(3):607–619.
4. Moore PA, Zgibor JC, Dasanayake AP. Diabetes: a growing epidemic of all ages. J Am Dent Assoc. 2003;134 Spec No:11S–15S.
A
B
C
D
E
F
2,959 cm–1
3,269 cm–1
3,550 cm–1
1,602 cm–1
1,422 cm–1
1,309 cm–1
3,350 cm–11,601 cm –1
1,426 cm–1
1,025 cm–1
1,309 cm–1
3,350 cm–1
3,552 cm–1
2,928 cm–1 1,714 cm –1
1,039 cm–1
1,601 cm–1
1,426 cm–1
1,309 cm–1 1,025 cm–1
1,025 cm–1
1,595 cm–1
1,408 cm–1
1,027 cm–1
1,422 cm–1
1,310 cm–1 4,000 70 72 74 76 78 80 82 84 86 88 90 92 94 96 98 100 70 72 74 76 78 80 82 84 86 88 90 92 94 96 98 100 75 76 78 80 82 84 86 88 90 92 94 96 98 100 76 74 78 80 82 84 86 88 90 92 94 96 98 100 80 70 60 50 40 30 22 90 100 85 80 75 70 60 65 55 50 95 90 100
3,500 3,000 2,500 2,000 1,500 1,000 450 4,000 3,500 3,000 2,500 2,000 1,500 1,000 450
4,000 3,500 3,000 2,500 2,000 1,500 1,000 450 4,000 3,500 3,000 2,500 2,000 1,500 1,000 450
4,000 3,500 3,000 2,500 2,000 1,500 1,000 450 4,000 3,500 3,000 2,500 2,000 1,500 1,000 450
% T % T % T % T % T % T
cm–1 cm–1
cm–1 cm–1
cm–1 cm–1
Figure 7 Fourier transform infrared spectra of the individual powders, mixed powder containing all the ingredients, and microcapsules. Notes: (A) PB powder. (B) Dca powder. (C) sa powder. (D) PB-Dca-sa powder. (E) PB-sa microcapsules. (F) PB-Dca-sa microcapsules. Abbreviations: Dca, deoxycholic acid; PB, probucol; T, transmitted light; sa, sodium alginate.
Drug Design, Development and Therapy downloaded from https://www.dovepress.com/ by 118.70.13.36 on 22-Aug-2020
Dovepress
Mooranian et al
5. Larsen N, Vogensen FK, van den Berg FW, et al. Gut microbiota in human adults with type 2 diabetes differs from non-diabetic adults.
PLoS One. 2010;5(2):e9085.
6. Johansen JS, Harris AK, Rychly DJ, Ergul A. Oxidative stress and the use of antioxidants in diabetes: linking basic science to clinical practice.
Cardiovasc Diabetol. 2005;4(1):5.
7. Cani PD, Neyrinck AM, Fava F, et al. Selective increases of bifidobac-teria in gut microflora improve high-fat-diet-induced diabetes in mice through a mechanism associated with endotoxaemia. Diabetologia. 2007;50(11):2374–2383.
8. Heel RC, Brogden RN, Speight TM, Avery GS. Probucol: a review of its pharmacological properties and therapeutic use in patients with hypercholesterolaemia. Drugs. 1978;15(6):409–428.
9. Zimetbaum P, Eder H, Frishman W. Probucol: pharmacology and clini-cal application. J Clin Pharmacol. 1990;30(1):3–9.
10. Yamashita S, Matsuzawa Y. Where are we with probucol: a new life for an old drug? Atherosclerosis. 2009;207(1):16–23.
11. Crim WS, Wu R, Carter JD, et al. AGI-1067, a novel antioxidant and anti-inflammatory agent, enhances insulin release and protects mouse islets. Mol Cell Endocrinol. 2010;323(2):246–255.
12. Karunakaran U, Park KG. A systematic review of oxidative stress and safety of antioxidants in diabetes: focus on islets and their defense.
Diabetes Metab J. 2013;37(2):106–112.
13. Takatori A, Ohta E, Inenaga T, et al. Protective effects of probucol treatment on pancreatic beta-cell function of SZ-induced diabetic APA hamsters. Exp Anim. 2003;52(4):317–327.
14. Gorogawa S, Kajimoto Y, Umayahara Y, et al. Probucol preserves pancreatic beta-cell function through reduction of oxidative stress in type 2 diabetes. Diabetes Res Clin Pract. 2002;57(1):1–10.
15. Russell JC, Graham SE, Amy RM, Dolphin PJ. Cardioprotective effect of probucol in the atherosclerosis-prone JCR:LA-cp rat. Eur J
Phar-macol. 1998;350(2–3):203–210.
16. Palin KJ, Wilson CG. The effect of different oils on the absorption of probucol in the rat. J Pharm Pharmacol. 1984;36(9):641–643. 17. Tanaka Y, Inkyo M, Yumoto R, Nagai J, Takano M, Nagata S.
Nano-particulation of probucol, a poorly water-soluble drug, using a novel wet-milling process to improve in vitro dissolution and in vivo oral absorption. Drug Dev Ind Pharm. 2012;38(8):1015–1023.
18. Heeg JF, Hiser MF, Satonin DK, Rose JQ. Pharmacokinetics of probucol in male rats. J Pharm Sci. 1984;73(12):1758–1763.
19. Lalic-Popovic M, Vasovic V, Milijasevic B, Golocorbin-Kon S, Al-Salami H, Mikov M. Deoxycholic acid as a modifier of the perme-ation of gliclazide through the blood–brain barrier of a rat. J Diabetes
Res. 2013;2013:598603.
20. Negrulj R, Mooranian A, Al-Salami H. Potentials and limitations of bile acids in type 2 diabetes mellitus: applications of microencapsulation as a novel oral delivery system. Journal of Endocrinology and Diabetes
Mellitus. 2013;1(2):49–59.
21. Whelehan M, Marison IW. Microencapsulation using vibrating technol-ogy. J Microencapsul. 2011;28(8):669–688.
22. Al-Salami H, Butt G, Fawcett JP, Tucker IG, Golocorbin-Kon S, Mikov M. Probiotic treatment reduces blood glucose and increases systemic absorption of gliclazide in diabetic rats. Eur J Drug Metab
Pharmacokinet. 2008;32(2):101–106.
23. Al-Salami H, Butt G, Tucker I, et al. Gliclazide reduces MKC intestinal transport in healthy but not diabetic rats. Eur J Drug Metab
Pharma-cokinet. 2009;34(1):43–50.
24. Al-Salami H, Butt G, Tucker I, Mikov M. Influence of the semisyn-thetic bile acid MKC on the ileal permeation of gliclazide in vitro in healthy and diabetic rats treated with probiotics. Methods Find Exp
Clin Pharmacol. 2008;30(2):107–113.
25. Al-Salami H, Butt G, Tucker IG, Mikov M. The influence of probiotic pretreatment on the ilealpermeation of gliclazide in healthy and diabetic rats. Arch Drug lnf. 2008;1(1):35–41.
26. Al-Salami H, Butt G, Tucker I, Skrbic R, Golocorbin-Kon S, Mikov M. Probiotic pre-treatment reduces gliclazide permeation (ex vivo) in healthy rats but increases it in diabetic rats to the level seen in untreated healthy rats. Arch Drug Inf. 2008;1(1):35–41.
27. Mooranian A, Negrulj R, Mathavan S, et al. A complex microencap-sulated system: a platform for optimized oral delivery of antidiabetic drug–bile acid formulations. Pharm Dev Technol. Epub 2014 May 5. 28. Mooranian A, Negrulj R, Chen-Tan N, et al. Microencapsulation as
a novel delivery method for the potential antidiabetic drug, probucol.
Drug Des Devel Ther. In press 2014.
29. Mooranian A, Negrulj R, Mathavan S, et al. Stability and release kinetics of an advanced gliclazide–cholic acid formulation: the use of artificial-cell microencapsulation in slow release targeted oral delivery of antidiabetics. J Pharm Innov. 2014;9:150–157.
30. Mooranian A, Negrulja R, Chen-Tan N, et al. Novel artificial cell microencapsulation of a complex gliclazide–deoxycholic bile acid formulation: a characterization study. Drug Des Devel Ther. 2014;8: 1003–1112.
31. Tam SK, Dusseault J, Polizu S, Menard M, Halle JP, Yahia L. Physico-chemical model of alginate–poly-L-lysine microcapsules defined at the micrometric/nanometric scale using ATR-FTIR, XPS, and ToF-SIMS.
Biomaterials. 2005;26(34):6950–6961.
32. Davignon J. Probucol. In: Schettler G, Habenicht AJR, editors.
Principles and Treatment of Lipoprotein Disorders. Berlin: Springer;
1994:429–469.
33. George M, Abraham TE. Polyionic hydrocolloids for the intestinal delivery of protein drugs: alginate and chitosan – a review. J Control
Release. 2006;114(1):1–14.
34. Kandrac J, Kevresan S, Gu JK, Mikov M, Fawcett JP, Kuhajda K. Isola-tion and determinaIsola-tion of bile acids. Eur J Drug Metab Pharmacokinet. 2006;31(3):157–177.
35. Kuhajda K, Kandrac J, Kevresan S, Mikov M, Fawcett JP. Structure and origin of bile acids: an overview. Eur J Drug Metab Pharmacokinet. 2006;31(3):135–143.
36. Takka S, Cali AG. Bile salt-reinforced alginate–chitosan beads. Pharm
Dev Technol. 2012;17(1):23–29.
37. Yang Y, Campanella OH, Hamaker BR, Zhang G, Gu Z. Rheological investigation of alginate chain interactions induced by concentrating calcium cations. Food Hydrocoll. 2013;30(1):26–32.
38. Bonino CA, Samorezov JE, Jeon O, Alsberg E, Khan SA. Real-time in situ rheology of alginate hydrogel photocrosslinking. Soft Matter. 2011; 7(24):11510–11517.
39. de Celis Alonso B, Rayment P, Ciampi E, et al. NMR relaxometry and rheology of ionic and acid alginate gels. Carbohydr Polym. 2010;82(3): 663–669.
40. Draget KI, Taylor C. Chemical, physical, and biological properties of alginates and their biomedical implications. Food Hydrocoll. 2011; 25(2):251–256.
41. Pamies R, Rodriguez Schmidt R, Lopez Martinez MDC, Garcia de la Torre J. The influence of mono and divalent cations on dilute and non-dilute aqueous solutions of sodium alginates. Carbohydr
Polym. 2010;80(1):248–253.
42. Legrand J, Dumont E, Comiti J, Fayolle F. Diffusion coefficients of ferricyanide ions in polymeric solutions – comparison of dif-ferent experimental methods. Electrochim Acta. 2000;45(11): 1791–1803.
43. Sarmento B, Ferreira D, Veiga F, Ribeiro A. Characterization of insulin-loaded alginate nanoparticles produced by ionotropic pre-gelation through DSC and FTIR studies. Carbohydr Polym. 2006; 66(1):1–7.
44. Gill P, Moghadam TT, Ranjbar B. Differential scanning calorimetry techniques: applications in biology and nanoscience. J Biomol Tech. 2010;21(4):167–193.
45. Ajun W, Yan S, Li G, Huili L. Preparation of aspirin and probucol in combination loaded chitosan nanoparticles and in vitro release study.
Carbohydr Polym. 2009;75(4):566–574.
46. Thybo P, Pedersen BL, Hovgaard L, Holm R, Mullertz A. Characteriza-tion and physical stability of spray dried solid dispersions of probucol and PVP-K30. Pharm Dev Technol. 2008;13(5):375–386.
47. Soares JP, Santos JE, Chierice GO, Cavalheiro ETG. Thermal behav-ior of alginic acid and its sodium salt. Ecletica Quimica. 2004;29(2): 57–64.
Drug Design, Development and Therapy downloaded from https://www.dovepress.com/ by 118.70.13.36 on 22-Aug-2020
Drug Design, Development and Therapy
Publish your work in this journal
Submit your manuscript here: http://www.dovepress.com/drug-design-development-and-therapy-journal
Drug Design, Development and Therapy is an international, peer-reviewed open-access journal that spans the spectrum of drug design and development through to clinical applications. Clinical outcomes, patient safety, and programs for the development and effective, safe, and sustained use of medicines are a feature of the journal, which
has also been accepted for indexing on PubMed Central. The manu-script management system is completely online and includes a very quick and fair peer-review system, which is all easy to use. Visit http://www.dovepress.com/testimonials.php to read real quotes from published authors.
Dovepress
Dove
press
novel Dca–probucol microcapsules for type 2 diabetes treatment
48. Mooranian A, Negruli R, Mathavan S, et al. Stability and release kinetics of an advanced gliclazide–cholic acid formulation: the use of artificial-cell microencapsulation in slow release targeted oral delivery of antidiabetics. J Pharm Innov. 2014;9:150–157.
49. Kulkarni AR, Soppimath KS, Aminabhavi TM, Rudzinski WE. In-vitro release kinetics of cefadroxil-loaded sodium alginate interpenetrating network beads. Eur J Pharm Biopharm. 2001;51(2):127–133.
Drug Design, Development and Therapy downloaded from https://www.dovepress.com/ by 118.70.13.36 on 22-Aug-2020