K – Means Algorithm
Gayatri Gupta
Department of Master of Computer Application
G. H. Raisoni College of Engineering
Nagpur, Maharashtra, India
[email protected]
Abstract: Clustering analysis is researching issue in data
mining due to its variety of application with the advent of many data clustering algorithms in the recent few years and its extensive use in wide variety of application, including image processing, computational biology, mobile communication, medicine and economics. Clustering is the process of partitioning a group of data point into a small number of clusters. K - Means algorithm is clustering method that aims to find the position of the cluster that minimizes the distance from the data point to the cluster. The mechanism follows the easy way to categorize a given data set through certain numbers of clusters (assume K clusters) fixed apriority. More the data is near to the centroid more is its membership towards the particular cluster center.
Keywords: Clustering algorithm; Algorithm design & analysis; Data mining; Data structure; Data Analysis; Fuzzy K - means algorithm.
I. INTRODUCTION
Clustering is a process of partitioning a group of data set into homogeneous groups based on features such that similar object is Kept in a group whereas dissimilar object is in different groups. K-means algorithm is one of the easy and simplest unsupervised learning algorithms that solve the all clustering problem. K-means algorithm defines clustering method that mainly use to find the position of the cluster that minimizes the distance from the data point to the cluster. The following procedure is an easy and simple way to classify a given data set through a few numbers of clusters fixed apriority. To define K centers for each cluster is the main idea.
These centers should be placed in a cleverly way because of different location causes the dissimilar result. So, the better
Vipul Yerpude
Department of Master of Computer
Application
G. H. Raisoni College of Engineering
Nagpur, Maharashtra, India
[email protected]
choice is to place them as possible as far away from each other. The next step is to take each point related to a given data set and placed it in the nearest center. Fuzzy K-means is works by assigning membership to entries data point object corresponding to all cluster centroids on the basis of the distance between the cluster centroids and data point object. More data is near to the cluster center, more data will become a member of the particular cluster center.
Clustering problem grows in many different applications, such as data mining, data compression, and pattern recognition and pattern classification. The K means problems are nearly related to a number of other clustering problems, such as the Euclidean K-medians problem in which the data point object is to minimize the sum of distances and the geometric K-center problem in which the objective is to minimize the maximum distance. One of the most popular algorithmic for solving the K-means problem is based on a simple iterative scheme for finding a locally minimal solution. This is called K-means algorithm.
II. DIFFERENT TYPE OF CLUSTERS
Clustering aims to find useful groups of clusters, where usefulness is defined by the goals of the data analysis. The type of cluster described here are equally valid for other Kinds of data.
III. WELL - SEPARATED CLUSTERS
idealistic definition of a cluster is satisfied only when a cluster that consists of two groups of points in a two-dimensional space.
Fig 1: Well-separated clusters. All points are closer to all of the points in its cluster than to any point in another cluster.
The distance between any two points in different groups is larger than the distance between any two points within a group. Well-separated clusters no need to be globular but can have any shape.
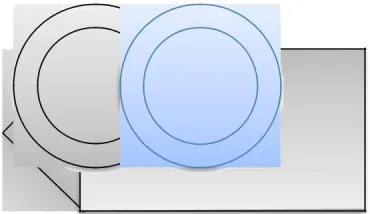
IV. PROTOTYPE - BASED
A cluster is a set of an object in which each object is closer to the prototype that described the cluster than to the prototype of any other cluster. The prototype of a cluster is mostly a centroid that is the mean of all the points in the cluster. When a centroid is meaningless, such as when the data has categorical attributes, the prototype is often a medoid, i.e., the most representative point of a cluster. For numbers of data, the prototype can be regarded as the central point and in such instances, which is commonly referred to prototype-based clusters as the center-based cluster. The figure is showing an example of center-based clusters.
Fig 2: Center-based clusters. All point is closer to the center of its cluster than to the center of any other cluster.
V. Graph – Based
If the data is represented as a graph, where the nodes are the object and the links represent connections among objects then a cluster can be defined as a connected component i.e., a group of objects that are connected to one another, but that have no connection to objects outside the group. One of the
examples of graph-based clusters is contiguity-based clusters, where each object is connected if only they are within a specified distance with each object. This implies that all data object in contiguity-based clusters is close to some other object in the cluster than to any data point objects in a different cluster.
Fig 3: Contiguity-based clusters. All point is closer to at least one point in its cluster than to any point in another cluster.
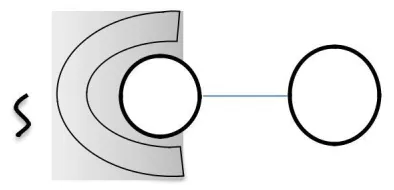
VI. DENSITY-BASED
A Cluster is a dense-based region of objects that is occupied by a region of low density. The figure shows density-based clusters for data created by adding noise to the data of above figure. The two circular clusters are not merged, as shown in above figure because the bridge between them fades into the noise. Like the curve which is present in above figure also called fades into the noise and does not form a cluster in below figure.
Fig 4: Density-based clusters. Clusters are regions of high density
separated by regions of low density.
VI. SHARED-PROPERTY (CONCEPTUAL
CLUSTERS)
definitions of a cluster. Consider the cluster as shown in below figure.
A triangular cluster is adjacent to a rectangular one and there are two intertwined clusters. A cluster is defined as a set of object that shares some property. This definition encompasses all the previous definitions of a cluster.
Fig 5: Conceptual clusters. Points in a cluster share general property that derives from the all set of points.
These are some different type of clusters as illustrated by sets of two-dimensional points.
VII. ROAD MAP
We use the three easy and simple techniques to introduce many of the concepts involved in cluster analysis.
(a) K-means: K-means is a prototype-based which is partitioned clustering technique which is used to find a user-specified number of clusters (K), which are represented by their centroids.
(b) Agglomerative Hierarchical Clustering: This technique used to a collection of related clustering techniques that produce a hierarchical clustering by initialing with all data points objects as a singleton cluster and then continuously merging the two closer clusters until a single, include all cluster remains.
(c) DBSCAN: This technique is a density-based clustering algorithm that produces a partition clustering, in which the many numbers of clusters is automatically determined by the algorithm. Points in low-density regions are classified as a noise and omitted, thus, DBSCAN doesn't produce a complete clustering.
VIII. K- MEANS
The Prototype-based clustering techniques create a partitioning of the data object. There are many techniques, but two most important techniques which are mostly used are K-means and K-medoid.
The term K-means explains the prototype in term of a centroid, which is generally the average of a group of points and it is applied to data objects in a continuous n-dimensional space.
pair of the object. When a centroid almost never corresponds to a real data points, the medoid definition must be an actual data point.
In this section, we only focus solely on K-means which is one of the oldest and last few years the K-means algorithm is widely used.
IX. THE BASIC K- MEANS ALGORITHM
The K- means clustering algorithm is used to minimize the distance between the centroid and put the value on the cluster. The K-means technique is very simple and we start with the basic algorithm.
We have first chosen K initial centroids, where K is a user specified parameter, namely, the number of clusters required.
Entries point assigned to the closest centroid and each collection of points assigned to a centroid is a cluster. The centroid of entries cluster is then modified based on the points assigned to the cluster.
We repeat the assignment and update steps and no point's changes on clusters or equivalently, unit the centroids remain the same.
A
. K- Means is formally described by the algorithm
1. Select the K points as initial centroids. 2. Repeat
3. From K cluster by assigning each point to its closest centroid.
4. Recomputed the centroid of each cluster. 5. Until Centroids do not change.
Figure (a) is showing the 1st step, a point is assigned to the initial centroids, all come in the very larger group of points. For example when we use the mean as the centroid. After points are assigned to a centroid, the centroids will be updated.
Again, the Figure for each step is showing the centroid at the initiating the step and the assignment of points to those centroids.
When the K- means cluster algorithm in figure (d), because no more changes occur, the centroids have identified the natural groupings of points.
+
+
+
+
+
+ +
(a) Iteration 1
(c) Iteration 3
+
+
+
+
+
+(b) Iteration 2
(d) Iteration 4
For some combinations of proximity function and types of centroids, K- means mostly converges to a solution. K- Means reaches a state in which numbers of points are shifting from one cluster to another hence, the centroids do not change. Because most of the problem occurs in the early steps, however, the condition on step 5 of the algorithm is often replaced by the weaker condition and repeat until only 1% of the changes on the clusters.
Consider each step of the K- means algorithm in more detail and then provide an analysis of the algorithm's space and time complexity.
X. Assigning Points To the closest centroid
Assign to points to the nearest, we need a proximity measure that quantifies the notion of nearest for the specific data point
under consideration. Euclidean distance is mostly used for data points on Euclidean space, while cosine similar is more appropriate for documents. However, there may be several types of proximity measures that are appropriate for a given type of data points.
Mostly, the similar measures used for K- means are easy and simple, since the algorithm one by one calculates the similarity of each point to each centroid. In some cases, however, such as when the data is in low dimensional Euclidean space, it is possible to avoid computing many of the similarities thus significantly speeding up the K- means algorithm.
Symbol Description
X An object
Ci The centroid of the cluster Ci
C The centroid of all points
K The number of clusters.
XII. Centroids and objective functions
In the 4th step of the K- means cluster algorithm was stated rather generally as recomputed the centroid of each cluster, since the centroid can vary, depending on the proximity measure for the data point object and the goal of the clustering. The aim of the clustering is typically expressed by an objective function that depends on the points to one another or to cluster centroids, minimizes the distance of each point to its closest centroid. We present the two best examples. When we have cleared a proximity measure and an objective function, the centroids that we should choose can often be determined mathematically concepts.
Conclusion
We present an efficient implementation of K-means clustering through this algorithm. We present an easy way to store the data in the database and to easy way to find the data.
use three-technique: K-Means, Agglomerative Hierarchical Clustering, and DBSCAN.
The Table showing, the partition of the data. Here we take some attribute, one of the attribute names is Age and in this Age column, we have selected two centroids, i.e., 23 and 45. Through this centroids we can easily store the data on the Cluster, centroids are used for minimize the distance between data object. Thought this table we have checked the
Distance between first centroid 23 to data object 10 i.e., data object 13. The same procedure is done by another data object, so we can see the distance between data point object and Centroid. After this procedure, we find all the distance
AGE Distance1 Distance2 Cluster1 Cluster2
10 13 35 1 0
15 8 30 1 0
23 0 22 1 0
40 13 5 1 ERROR 2
45 22 0 0 2
50 27 5 0 2
Centroid 23 45
Between data point object and centroid. According to the distance, the value will be stored in the cluster 1 and cluster 2.
A table showing the data object values which are closed to centroid 23, will store in the cluster 1 and the data object values which are closed to centroid 45, will store in the cluster 2. K-means cluster does not support the categorized system. K-mean only supports the binary form. Through the binary form data stored as true or false on the cluster. And last few year K mean cluster algorithm mostly use for the Big Data Analysis and Social Media, Data Mining etc.
References
1)Data Clustering: A Review by A.K. Jain, M.N. Murty and P.J. Flynn.
2)Clustering with Gaussian Mixtures by Andrew W. Moore. 3)Kernel K-means, Spectral Clustering and Normalized Cuts by Inderjit S. Dhillon, Yuqiang Guan and Brian Kulis. 4) A Comprehensive Overview of Basic Clustering Algorithms by Glenn Fung.
5)An Efficient K-means Clustering Algorithm: Analysis and Implementation by Tapas Kanungo, David M. Mount, Nathan S. Netanyahu, Christine D. PiatKo, Ruth Silverman and Angela Y. Wu.
6) An Efficient Minimum Spanning Tree based Clustering Algorithm by Prasanta K. Jana and Azad NaiK.
7) An Efficient K-means Clustering Algorithm by Khaled Alsabti, Sanjay RanKa and Vineet Singh.
8) Survey of Clustering Data Mining Techniques by Pavel BerKhin.
9) Graph Clustering and Minimum Cut Trees by Gary William FlaKe, Robert E. Tarjan, and Kostas TsioutsiouliKlis.