ABSTRACT
NGUYEN, VIVI LE. A Method to Quantify In-Situ Growth Rates of a Filament and a Floc-former Using Real-time Quantitative PCR. (Under the direction of Francis L. de los Reyes III).
Filamentous bulking is a common problem in activated sludge wastewater treatment
plants caused by the excessive growth of filamentous bacteria. To date, engineering controls
have not proven consistent in eliminating the problem; therefore focus has shifted in recent
years to investigating the mechanisms of floc-filament competition. Two models which
attempt to explain this competition are the kinetic selection theory and the diffusion
limitation model. The kinetic selection theory cites differences in kinetic parameters as the
cause of variation in filament/former ratio. At high substrate concentrations,
floc-formers out-compete filaments whereas filaments are favored at lower substrate
concentrations. The diffusion limitation model assumes equal kinetic parameters and cites
the difference in morphology as the mechanism for bulking.
The goal of this project is to develop a species-specific method to quantify the in-situ
growth rate of one filament and one floc-former in activated sludge. Growth rate is an
important parameter in modeling of activated sludge which has been, until now, estimated
using non-species specific methods. The method proposed here will allow future researchers
to determine the effect of different operating conditions on the growth rate of a given species,
It has been shown for a number of different organisms that RNA level increases as
growth rate increases. Chemostats were used to study pure cultures of Sphaerotilus natans,
as the representative filament, and Arthrobacter globiformis, as the representative
floc-former, to determine the relationship between growth rate and RNA:DNA ratio for each
species. Real-time qPCR and reverse transcription real-time qPCR were used to measure
DNA and RNA levels respectively. The relationship between RNA:DNA ratio and growth
rate was found to be positive and linear, R2 of 0.58 and 0.98 for S. natans and A. globiformis respectively. This relationship was used to determine in-situ growth rate of S. natans in
activated sludge from the aeration basin of the North Cary WWTP and in samples collected
from a previous study on the effect of different substrates on bulking. A. globiformis could
not be detected in any of the WWTP samples. This study represents the first time qPCR and
RT-qPCR have been used to quantify in-situ microbial growth rates in activated sludge.
A Method to Quantify In-Situ Growth Rates of a Filament and a Floc-Former Using
Real-Time Quantitative PCR
by
Vivi Le Nguyen
A thesis submitted to the Graduate Faculty of
North Carolina State University
In partial fulfillment of the
Requirements for the degree of
Master of Science
CIVIL ENGINEERING
Raleigh, NC
August 2007
Approved by:
__________________________ __________________________ Dr. Morton A. Barlaz Dr. Detlef R. U. Knappe (Advisory Committee) (Advisory Committee)
BIOGRAPHY
Vivi Le Nguyen was born in Lincoln, Nebraska, USA to parents Thanh Ngoc Nguyen
and Myle Nguyen in 1982. She happily spent the first 18 years of her life in Nebraska. In
fall of 2001, she began her college career at the University of Pennsylvania in Philadelphia,
PA as a chemical engineering major. It was during this time at UPENN that her passion for
environmental work came to life. Professors Wen K. Shieh and Manaf Farhan inspired her to
pursue a minor in Environmental Studies. In the spring of 2005, she received a Bachelor of
Science in Engineering in Chemical Engineering. During the summer of 2005, she worked
as an intern at the Environmental Protection Agency (EPA) office in Washington DC under
the direction of Nhan Nguyen, Branch Chief of the Chemical Engineering Branch under the
Office of Pollution Prevention and Toxics. In fall of 2005, she began work as a research
assistant at North Carolina State University under the direction of Dr. Francis L. de los Reyes.
At NCSU, she became heavily involved in Engineers Without Borders, a non-profit,
humanitarian organization devoted improving the quality of life for people in developing
countries through engineering solutions. Upon graduation she hopes to obtain a position as a
consulting engineer in water, wastewater treatment and one day hopes to be able to apply this
ACKNOWLEDGEMENTS
This research was funded by U.S. National Science Foundation (grant BES 009285).
This thesis would not have been possible without the contribution and support of the
following people:
• Dr. Francis de los Reyes for being my guide and role model throughout my time at
NCSU
• Drs. Detlef Knappe and Morton Barlaz for being on my advisory committee
• Research group mates Cesar Mota, Bryan Staley, In Chio Lou, and especially Pascal
Saikaly for all of their help, suggestions, criticisms and advice in the lab
• Mr. Steve Wade for construction and maintenance advice of the Plexiglas box for
chemostat reactors
• Gamze Gulez and Julia Keith for use of samples from their work for my project • Great friends made at NCSU Jason Tillotson, Ahmad Sadri, Hossain Azam, Andy Li,
Robert Tucker, Jimmy Summey, Lucas Sharkey for keeping me relatively sane, and
making this such a memorable time in my life
TABLE OF CONTENTS
LIST OF TABLES ...viii
LIST OF FIGURES ...ix
INTRODUCTION...1
1 LITERATURE REVIEW ...3
1.1 INTRODUCTION...3
1.2 FACTORS AFFECTING GROWTH RATE...3
1.3 TECHNIQUES TO CONTROL BULKING...4
1.4 COMPETITION MECHANISMS...5
1.5 MEASURING GROWTH RATE...6
1.5.1 DIRECT COUNTS...6
1.5.2 TURBIDITY...8
1.5.3 TOTAL PROTEIN...9
1.5.4 INCORPORATION OF LABELED NUCLEIC ACID PRECURSORS...9
1.5.4.1 Tritiated thymidine ... 10
1.5.4.2 Bromodeoxyuridine incorporation ... 13
1.5.4.3 Adenine ... 14
1.5.4.4 Leucine incorporation ... 16
1.5.5 FREQUENCY OF DIVIDING CELLS... 16
1.5.6 ADENYLATE ENERGY CHARGE... 17
1.5.7 RNA-BASED TECHNIQUES... 19
1.6 CONCLUSIONS... 21
2 DEVELOPING PCR ASSAYS TO QUANTIFY DNA & RNA OF ARTHROBACTER GLOBIFORMIS & SPHAEROTILUS NATANS... 23
2.1 COMPETITIVE PCR... 23
2.1.1 INTRODUCTION... 23
2.1.2 MATERIALS AND METHODS... 25
2.1.2.1 Bacterial strains and culture conditions ... 25
2.1.2.2 cPCR Primer Design... 26
2.1.2.3 Creating competitor ... 28
2.1.2.4 Cloning... 31
2.1.2.5 cPCR ... 33
2.1.2.6 Sequencing ... 33
2.1.3.1 Creating competitors... 35
2.1.3.2 Cloning competitors ... 36
2.1.3.3 Optimizing gel conditions ... 37
2.1.3.4 cPCR - DNA ... 39
2.1.3.5 RT-PCR preliminary results... 42
2.1.4 CONCLUSIONS... 42
2.2 DEVELOPING REAL-TIME QPCR AND RT-QPCRASSAYS... 44
2.2.1 INTRODUCTION... 44
2.2.2 MATERIAL AND METHODS... 47
2.2.2.1 Primer Design... 47
2.2.2.2 Real-time PCR and RT-PCR... 49
2.2.2.3 Creating Real-time PCR standards ... 50
2.2.2.4 Calculating copy number ... 51
2.2.3 RESULTS AND DISCUSSION... 52
2.2.3.1 Primer Design Optimization ... 52
2.2.3.2 Real-time DNA and RNA Standards... 63
2.2.3.3 Specificity of SNA real-time primers ... 68
2.2.4 CONCLUSIONS... 72
3 DETERMINING RNA:DNA VERSUS µ RELATIONSHIP FOR SPHAEROTILUS NATANS & ARTHROBACTER GLOBIFORMIS... 73
3.1 INTRODUCTION... 73
3.2 MATERIALS AND METHODS... 75
3.2.1 CHEMOSTAT SETUP... 75
3.2.2 CHEMOSTAT OPERATION... 80
3.2.3 MEASURING FLOW RATE... 80
3.2.4 DETERMINING SRT ... 81
3.2.5 COLLECTING SAMPLES... 81
3.2.6 NUCLEIC ACID EXTRACTION... 81
3.2.7 SOLIDS MEASUREMENTS... 82
3.2.8 RNA:DNA VERSUS µ RELATIONSHIP FOR SNA AND AGF ... 83
3.2.9 CALCULATING COPY NUMBER... 83
3.3 RESULTS AND DISCUSSION... 84
3.3.1 RNA:DNA VERSUS µ RELATIONSHIP FOR SNA AND AGF ... 84
3.3.2 CONCLUSIONS... 86
4 IN-SITU GROWTH RATE OF SNA AND AGF IN WASTEWATER ... 87
4.1 INTRODUCTION... 87
4.2 MATERIALS AND METHODS... 88
4.2.2 NUCLEIC ACID EXTRACTION... 88
4.2.3 SOLIDS ANALYSIS... 89
4.3 RESULTS AND DISCUSSION... 90
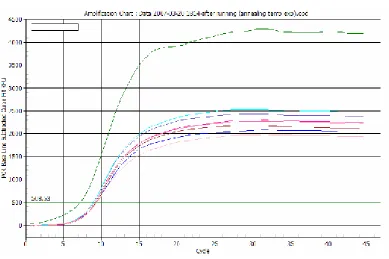
4.3.1 SAMPLE HOLDING TREATMENT STUDY... 90
4.3.2 IN-SITU GROWTH RATE... 91
4.4 CONCLUSIONS... 99
5 SUMMARY OF CONCLUSIONS... 100
6 RECOMMENDATIONS FOR FUTURE WORK ... 102
7 REFERENCES ... 104
8 APPENDIX A - SEQUENCES... 110
8.1 SPHAEROTILUSALIGNMENTSEQUENCES... 110
8.2 ARTHROBACTERALIGNMENTSEQUENCES ... 119
9 APPENDIX B – PROCESS FOR CREATING RNA STANDARD FOR CPCR.... 124
10 APPENDIX C – BLAST RESULTS ... 125
11 APPENDIX D – PROTOCOLS ... 142
11.1 POWERSOIL™DNAISOLATION KIT PROTOCOL FROM MOBIO... 142
11.2 POWERSOIL™RNAISOLATION KIT PROTOCOL FROM MOBIO... 144
12 APPENDIX E – RNA AND DNA EXTRACTION OPTIMIZATION EXPERIMENTS ... 146
12.1 COMPARING MOBIO AND QIAGEN DNA AND RNA EXTRACTION KITS... 146
12.1.1 INTRODUCTION... 146
12.1.2 MATERIALS AND METHODS... 146
12.1.2.1 Powersoil DNA ... 147
12.1.2.2 Qiagen RNA ... 147
12.1.2.3 Qiagen DNA... 148
12.1.3 RESULTS AND DISCUSSION... 149
12.1.3.1 Experiment 1 - RNA extraction using the MoBio Powersoil kit ... 149
13 APPENDIX F - RAW DATA ... 152
13.1 CHEMOSTAT -SNARNASTANDARD CURVE... 152
13.2 CHEMOSTAT -SNADNASTANDARD CURVE... 153
13.3 CHEMOSTAT -AGFDNASTANDARD CURVE... 154
13.4 CHEMOSTAT -AGFRNASTANDARD CURVE... 155
13.5 RNA:DNA VS GROWTH RATE CURVE AGFDNA ... 156
13.6 RNA:DNA VS GROWTH RATE CURVE AGFRNA ... 158
13.7 RNA:DNA VS GROWTH RATE CURVE AGF ... 160
13.8 RNA:DNA VS GROWTH RATE CURVE SNADNA... 161
13.9 RNA:DNA VS GROWTH RATE CURVE SNARNA... 163
13.10 RNA:DNA VS GROWTH RATE CURVE SNA ... 165
13.11 CHEMOSTAT RAW DATA –SNA... 165
13.12 CHEMOSTAT RAW DATA –AGF ... 165
13.13 NORTH CARY WWTP-SNA ... 166
13.14 NORTH CARY WWTP-AGF... 167
13.15 RAW DATA –SAMPLES FROM SUBSTRATE STUDY (13)–SNA GROWTH RATE... 168
13.16 RAW DATA –SAMPLES FROM SUBSTRATE STUDY (13)–AGF... 170
13.17 RAW DATA –SAMPLES FROM SURVEY STUDY (23)–SNA ... 171
13.18 RAW DATA –SAMPLES FROM SURVEY STUDY (23)–AGF... 173
LIST OF TABLES
TABLE 2.1-SEQUENCES USED FOR SNA PRIMER DESIGN... 27
TABLE 2.2-SEQUENCES USED FOR AGF PRIMER DESIGN... 28
TABLE 2.3- CPCRPRIMER SEQUENCES AND SPECIFICATIONS... 28
TABLE 2.4-MODIFIED REVERSE PRIMER SEQUENCES USED TO CREATE COMPETITORS... 30
TABLE 2.5-PRIMER SPECIFICATIONS FOR REAL-TIME PCR ... 48
TABLE 2.6-COMPARING SPECIES SPECIFICITY OF CPCR AND REAL-TIME PRIMERS... 52
TABLE 2.7-SNA PRIMER SET #2 DESIGNED FOR REAL-TIME PCR ... 52
TABLE 2.8-DESCRIPTION OF REAL-TIME PCR RUNS TESTING VARIOUS PARAMETERS... 53
TABLE 3.1-CHEMOSTAT PARTS AND DESCRIPTIONS... 77
LIST OF FIGURES
FIGURE 2.1-LINEAR AND LOOP PRIMERS FOR CREATING COMPETITOR... 30
FIGURE 2.2-VERIFICATION OF CREATING SNA COMPETITORS... 35
FIGURE 2.3-VERIFICATION OF CREATING AGF COMPETITORS... 36
FIGURE 2.4-GEL OF SNA CLONING RESULTS... 37
FIGURE 2.5-GEL OF AGF CLONING RESULTS... 37
FIGURE 2.6-OPTIMIZING GEL CONDITIONS FOR SNA CPCR1 ... 38
FIGURE 2.7-OPTIMIZING GEL CONDITIONS FOR SNA CPCR2 ... 38
FIGURE 2.8-OPTIMIZING GEL CONDITIONS FOR SNA CPCR3 ... 39
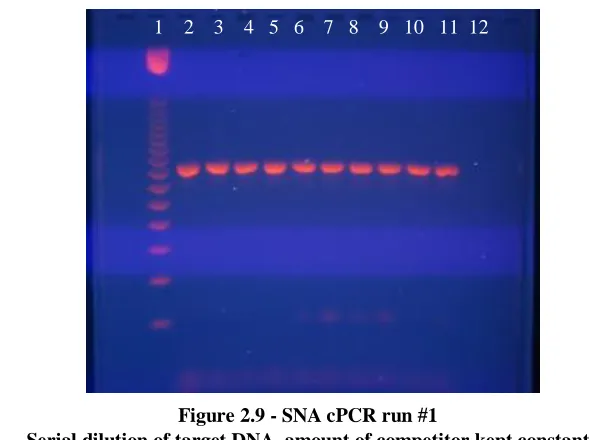
FIGURE 2.9-SNA CPCR RUN #1 ... 40
FIGURE 2.10-SNA CPCR RUN #2 ... 41
FIGURE 2.11- CPCRAGF CPCR RUN... 42
FIGURE 2.12-TROUBLESHOOTING SNA PRIMERS FOR REAL-TIME PCR,PCR RUN 1 ... 54
FIGURE 2.13-TROUBLESHOOTING SNA PRIMERS FOR REAL-TIME PCR,PCRRUN 2... 55
FIGURE 2.14-TROUBLESHOOTING SNA PRIMERS FOR REAL-TIME PCR,PCRRUN 3... 55
FIGURE 2.15-TROUBLESHOOTING SNA PRIMERS FOR REAL-TIME PCR,PCRRUN 4... 56
FIGURE 2.16-TROUBLESHOOTING SNA PRIMERS FOR REAL-TIME PCR,PCRRUN 5... 56
FIGURE 2.17-TROUBLESHOOTING SNA PRIMERS FOR REAL-TIME PCR,PCRRUN 6... 57
FIGURE 2.18-OPTIMIZING ANNEALING TEMPERATURE -SNA PRIMERS... 57
FIGURE 2.19-TROUBLESHOOTING SNA PRIMERS FOR REAL-TIME PCR ... 59
FIGURE 2.20-TROUBLESHOOTING SNA PRIMERS FOR REAL-TIME PCR ... 59
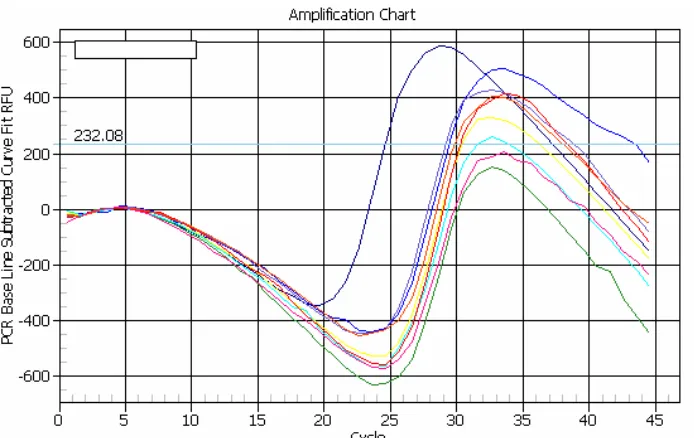
FIGURE 2.21-AMPLIFICATION CURVE... 60
FIGURE 2.22-TROUBLESHOOTING SNA PRIMERS -STANDARD CURVE... 60
FIGURE 2.23-OPTIMIZING ANNEALING TEMPERATURE OF AGF PRIMERS... 62
FIGURE 2.24-OPTIMIZING ANNEALING TEMPERATURE OF SNA PRIMERS... 62
FIGURE 2.25-REAL-TIME QPCR AND REAL-TIME RT-QPCR STANDARD CURVES... 65
FIGURE 2.26-AGFDNASTANDARD CURVE ATTEMPT... 66
FIGURE 2.27-SNADNASTANDARD CURVE ATTEMPT... 66
FIGURE 2.28-AGFRNASTANDARD CURVE ATTEMPT... 67
FIGURE 2.29-SNARNASTANDARD CURVE ATTEMPT... 67
FIGURE 2.30-PHYLOGENETIC TREE SHOWING SEQUENCES TARGETED BY SNA550R AND SNA417F PRIMERS... 69
FIGURE 2.31-MELT CURVE OF RT-QPCR OF N.CARY SAMPLES -AGF... 70
FIGURE 2.32-MELT CURVE OF RT-QPCR OF N.CARY SAMPLES WITH SNA PRIMERS... 70
FIGURE 2.33-MELT CURVE OF RT-QPCR OF SNA CHEMOSTAT SAMPLES -SNA ... 71
FIGURE 2.34-MELT CURVE OF RT-QPCR OF AGF CHEMOSTAT SAMPLES -AGF ... 71
FIGURE 3.1-DIAGRAM OF CHEMOSTAT SETUP... 78
FIGURE 3.2-OVERALL SETUP OF CHEMOSTAT REACTORS... 79
FIGURE 3.3-CLOSE-UP OF PUMP (TO SHOW FINE AND COARSE ADJUSTMENTS) ... 79
FIGURE 3.4-COOLER AND WATER BATH SETUP... 80
FIGURE 3.5-RNA:DNA RATIO VS. SPECIFIC GROWTH RATE OF AGF... 84
FIGURE 3.6-RNA:DNA RATIO VS. SPECIFIC GROWTH RATE OF SNA... 85
Introduction
Activated sludge for wastewater treatment is the most common use of biotechnology
in the world. Well settling, flocculated sludge is vital to the proper function of such systems.
Filamentous bulking is a major problem in activated sludge wastewater treatment caused by
excessive growth of filamentous organisms. Filaments prevent sludge from settling,
compacting, or both by bridging flocs or causing loosely formed flocs, depending on the
causative filament. Poorly settling sludge can lead to loss of solids in the aeration basin and
in severe cases, can cause solids overflow in the secondary clarifier and hydraulic overload
of solids separation equipment. Many studies have reported bulking problems in wastewater
treatment plants (WWTPs) worldwide (30).
To date, most studies have focused on engineering methods to solve the bulking
problems (19). Oxidation using chemicals such as chlorine and ozone is the most common
method of treating bulking sludge. However, these non-specific solutions only treat the
symptoms of the problem, and will therefore require continuous and consequently costly
treatment.
More knowledge about the microorganisms (identification, growth requirements, and
physiology) responsible for bulking, is needed in order to develop specific treatment methods.
As a result, work has recently shifted to molecular methods to study these microorganisms.
Methods such as fluorescence in-situ hybridization (FISH) and real-time PCR have opened
the doors to new understanding of these organisms by allowing researchers to study them
with species level specificity in-situ. FISH has been used extensively to study biofilms,
been used to correlate filament levels with bulking events (49) and to quantify Microthrix
parvicella (21) but to date, no one has used molecular methods to measure the in-situ growth
rate of filamentous bacteria in activated sludge.
The objective of this work was to develop and validate a method for measuring the
growth rate of Sphaerotilus natans (SNA), a filament, and Arthrobacter globiformis (AGF), a
floc-former, in activated sludge. The approach is to correlate growth rate with the 16S
rRNA:DNA ratio. RNA has been shown to be positively correlated with growth rate for a
number of microorganisms including E. coli, S. typhimurium (26), A. aerogenes (4), various
marine bacteria isolates (24) and resin-acid-degrading bacteria (34). The amount of DNA
within a cell does not change with growth rate and therefore serves as a measure of biomass
to normalize RNA content. RNA and DNA were quantified with qPCR and RT-qPCR
respectively. The thesis is divided into four sections: a literature review, qPCR and
RT-qPCR assay development, chemostat reactor experiments to determine the 16S rRNA:DNA
versus growth rate curve and using the assay to determine the in-situ growth rate of SNA and
AGF in activated sludge.
1 Literature Review
1.1 Introduction
Filamentous bulking is a potentially serious and costly problem in activated sludge
(AS) wastewater treatment plants (WWTPs). It has been estimated that bulking is a
prevalent problem in as many as half of the AS WWTPs worldwide (50). The literature
review is aimed at providing the reader with adequate background information to form a
basis of understanding for the work presented. Topics to be discussed are: factors affecting
growth rate of filamentous bacteria, techniques used to treat bulking, competition
mechanisms between filaments and floc-formers and a review of methods used to measure
bacterial growth rate.
1.2 Factors Affecting Growth Rate
The factors affecting growth of filamentous organisms are the same as those affecting
all other types of organisms in activated sludge. These can be categorized as wastewater
characteristics, process design parameters or treatment plant operation conditions.
Wastewater characteristics which affect bulking are: nutrient balance (N and P
concentrations) and the presence of certain substrates such as readily metabolizable soluble
organics, dissolved sulfide, lipids, and particulate substrates such as starch. Treatment plant
operating conditions which can affect bulking are dissolved oxygen (DO) concentration, pH
Process design parameters affecting bulking include: net growth rate (MCRT, F/M),
aeration basin configuration and redox conditions, wastewater feeding regime and upstream
biological treatment units, sewer surfaces and in-plant surfaces (19).
1.3 Techniques to Control Bulking
Techniques for controlling bulking include non-specific methods which affect all
microorganisms within the system, and specific methods targeting only filamentous
organisms through metabolic and physiological control. Non-specific bulking control
methods include: manipulation of return activated sludge (RAS) flow rates and aeration basin
feed points, addition of chemicals and inert solids to enhance activated sludge settling rates
and addition of various types of oxidants (chlorine, hydrogen peroxide, ozone,
filamenticides) (19).
Specific methods of bulking control require knowledge of the causative organisms so
that process design parameters and treatment plant operating conditions can be tailored to
select for floc-forming over filamentous bacteria. Techniques that have been used include
adjusting nutrient concentrations (nitrogen, phosphorous, sulfur), changing the aeration basin
configuration or feeding regime, and the use of metabolic selectors. The term selector was
devised by Chudoba et al. (7) to refer to an AS system configuration which contains
compartmentalized regions of differing conditions which select for certain groups of
organisms and against others. Selectors have been proven to successfully control bulking in
many cases, however they are not always successful, and more research is needed about the
1.4 Competition mechanisms
The engineering approaches discussed previously have had variable success in
eliminating bulking problems. A large body of literature explores competition between
floc-forming and filamentous organisms. Understanding the competition mechanism may unlock
the door to finding a cure for activated sludge bulking. The kinetic selection theory (KST) is
the most widely cited theory for explaining floc-filament competition. This theory, based on
Monod kinetics, presumes different growth constants (µmax and Ks) for different organisms.
Applied to activated sludge, this means that filaments should prevail at conditions with low
substrate concentration because they are low Ks organisms and vice versa for floc-forming
organisms. This theory necessitates the concept that at long, steady state incubations
competitive exclusion occurs and only one type of organism will eventually take over
completely (7).
Diffusion limitation theory states that filaments are always present within sludge flocs,
and that bulking occurs under low substrate conditions due to the ability of filaments to grow
outside the floc. In diffusion-based selection (DBS), kinetic parameters are presumed to be
equal for both types of organisms and bulking is explained by morphology. Under diffusion
dominated conditions (low substrate concentration), bulking occurs because filaments gain
an advantage by extending outside of the floc toward substrate. Under high substrate
1.5 Measuring Growth Rate
The terms metabolism, metabolic activity, activity and microbial growth have all
been used, sometimes interchangeably, in reference to the growth rate of bacteria.
Metabolism, metabolic activity, and activity are terms which refer to both anabolic and
catabolic reactions within the cell. Growth however refers to the ability of cells to divide and
create new biomass (40). Measuring metabolic activity is important for applications where
the interest is in degradation of substrates or consumption of a reactant. For applications in
which cell numbers or volume of biomass is the important factor, such as in filamentous
bulking, knowing the in-situ growth rate of a specific organism is most advantageous.
Numerous methods have been used to characterize growth rates of bacteria. These
methods can be categorized as either direct or indirect methods. Direct methods include
microscopy and plate counts. Indirect methods require correlation of growth rate with some
external factor which can be measured. This factor is quantified for environmental samples,
and growth rate is then determined using the correlation. Factors that have been used include
turbidity, biomass, total nitrogen or protein, incorporation of labeled nucleic acid precursors,
and amount of nucleic acids themselves, in particular RNA. The following sections provide
a review of direct and indirect methods for measuring growth rates of bacteria.
1.5.1 Direct counts
Microbial growth can be evaluated directly by counting cells under a microscope at
essentially a microscope slide with a chamber of known volume with a grid which has
specific dimensions so that the number of cells counted in a sample can be used to calculate
the concentration in the original culture. Though this method is used extensively to
enumerate bacteria in culture, it has severe shortcomings limiting usefulness for enumerating
cells in environmental samples. Considering the limited number of possible cell
morphologies versus the number of species of bacteria currently known, it is logical to see
that most cells are not different enough to be easily identifiable under a microscope. As such,
measuring growth rate of a single species within mixed cultures under a microscope is
practically impossible. In addition, microscopy cannot distinguish between live, dead and
live but not growing cells. Including dead and non-growing cells in the count will
underestimate the growth rate of the active population. Other limitations are that
concentrations under 106 cells/mL are generally too dilute to be counted, small cells are difficult to count, and cells prone to forming flocs or filaments cannot be distinguished and
therefore do not provide accurate numbers with this technique (29).
Fluorescent stains such as fluorescein diacetate (FDA), acridine orange (AO),
4,6-diamidino-2-phenylindole (DAPI) and fluorescein isthiocyanate (FITC) can enhance
microscopy by making cells easier to see and also by allowing for discrimination between
live and dead cells. Though using stains will increase accuracy of counting by making cells
easier to visualize, the stains act indiscriminately and will stain all types of cells, therefore
even with fluorescent staining, microscopy cannot be used for species specific measurements
Plate counts are an alternative to microscopy which does differentiate between live
and dead cells however, creates the great bias of only allowing enumeration of cultivable
cells. It has been estimated that only 1-10% (28) of microorganisms can be cultured under
laboratory conditions. Plate counts have been used for decades to enumerate bacteria,
however, this technique is not capable of accurately representing mixed culture
environmental samples.
1.5.2 Turbidity
Turbidity, a measure of the cloudiness of a liquid sample, is quantified with a
spectrophotometer. A spectrophotometer measures optical density (OD), which is the degree
to which a sample transmits light. Particles, or cells, within a liquid sample scatter light
therefore preventing some amount from passing through the sample. A direct relationship
(over a certain range of turbidities) exists between number of bacteria and amount of
scattered light. Using turbidity to measure the growth rate of bacterial cells requires
generation of a standard curve which relates some measure of cells (number or mass) to
optical density (OD). This method, though relatively quick and easy, inherently has many of
the same limitations as the direct methods. A spectrophotometer cannot differentiate
between live cells, dead cells or other material present in the sample nor can it differentiate
between different microorganism species. Turbidity is a useful measurement for
enumerating cells in pure culture but cannot be used to measure species specific growth rate
1.5.3 Total protein
Total protein can be used to quantify changes in biomass due to cell growth. The
three most common methods used for quantifying total protein are the Lowry, Bradford and
bicinchoninic acid (BCA)assays. All three assays are based on the binding of different
reagents with the protein in a sample. The reaction induces a color change which can be
detected spectrophotometrically. Choosing the best assay depends on the type of sample
being analyzed (pure or mixture of proteins) and the potential for interference by sample
components. The major limitation for use of total protein measurements for quantitation of
environmental samples is that none of the assays mentioned above can differentiate the
source of protein. Therefore protein in environmental samples coming from plants and
microscopic animals will also be detected. A more common method of determining growth
rate is by measuring rate of protein synthesis by leucine incorporation, discussed in Section
1.5.4.4.
1.5.4 Incorporation of labeled nucleic acid precursors
Incorporation of labeled nucleic acid precursors is an established method for
measuring the in-situ growth rate of microorganisms. Among the labeled precursors used are
tritiated thymidine, tritiated adenine, tritiated leucine and bromodeoxyuridine.
Except for leucine, which is incorporated into protein, the general principle is that
microorganisms favor incorporation of exogenous nucleic acid precursors over de novo
synthesis and the rate of incorporation of these precursors is proportional to nucleic acid
manner, the growth rate of the bacteria can be determined by measuring the rate of nucleic
acid synthesis.
1.5.4.1 Tritiated thymidine
The tritiated thymidine growth assay is perhaps the most well known method of this
type (2, 11, 32, 48). This method quantifies the amount of [3H]thymidine incorporated into DNA to determine the increase in new bacterial cells per unit time (growth). Cells are
incubated with [3H]thymidine for a short period of time, then DNA is extracted, and the amount of [3H]thymidine is quantified with a scintillation counter.
Bacterial growth rates are calculated from the assumptions that thymine bases are
approximately 25% of total DNA bases and that the average genome size of DNA of bacteria
are 4 X 10-15 g DNA per cell (31). The factor converting [3H]thymidine incorporation to new cells has been determined both empirically and theoretically, the mean value of which is 2 x
109 cells nmol-1 (32, 40).
The tritiated thymidine method requires short incubation periods to reduce artifacts
created by extended incubation of environmental samples. This requirement also makes it
convenient for field studies. Thymidine kinase is the enzyme which converts thymidine to
dTMP. It is required in order for the labeling of DNA to occur to significant extent. Fungi,
microalgae and cyanobacteria and many eucaryotic organisms do not have thymidine kinase,
therefore, unlike with protein measurements, this assay is specific for bacteria. Perhaps the
independent, which means it can be used to evaluate the growth rate of microorganisms
in-situ.
Though the technique is well accepted, it is not without limitations which are
discussed in great detail in Measurements of Bacterial Growth Rates (31) and will be
summarized here.
Dilution of the labeled thymidine incorporated into DNA occurs because of de novo
synthesis of dTTP precursors. The degree of dilution can be measured with dilution
experiments in which different amounts of non-labeled thymidine are added to a constant
amount of labeled thymidine, then the amount of label incorporated into DNA is measured.
Pollard and Moriarty (41) found that adding labeled thymidine in a high enough
concentration (usually 20 nM in water) suppresses de novo synthesis so that dilution
experiments do not have to be performed for every sample. A method to determine the
concentration at which de novo synthesis is insignificant is to add increasing amounts of
tritiated thymidine at the same activity until no additional incorporation occurs.
It is possible for non-bacterial organisms to take up the radio-labeled substrate
through degradation of thymidine to thymine then further breakdown of thymine. The
tritium label enters the pool of general metabolites and can thus be incorporated into DNA.
However, these reactions take time, and if the incubation period is kept short (usually under 1
A few species of Pseudomonas have been shown to be unable to take up
[3H]thymidine. This is hypothesized to be due to the lack of mechanisms for efficient transport of nucleosides or bases within the cell. It is proposed that bacteria with very
limited nutrient requirements such as chemolithotrophic and sulfate-reducing bacteria also
lack such mechanisms and explaining the reason for poor [3H]thymidine incorporation into their DNA. Bacteria which are unable to take up [3H]thymidine cannot be assessed using this method.
Disturbing the interactions between different microorganisms and their environment
during experimental manipulation can affect rate of DNA synthesis. This limitation applies
mostly to analysis of sediment samples because the sediment needs to be mixed to
incorporate the [3H]thymidine so that all bacteria in the sample will have access. Moriarty explains that disturbances affect the rate of DNA synthesis less rapidly than either protein or
phospholipid synthesis because the regulation of DNA is complex. It is dependent on many
other factors such as energy generation and protein synthesis. Cells take up [3H]thymidine much faster than it can be used. As a result, DNA synthesis rate is independent of the
amount of thymidine added and sediments can be disturbed without having a large impact on
the rate of DNA synthesis (32).
One of the limitations of the tritiated thymidine method is that it is incapable of
assessing species specific in-situ growth rates. This limitation was addressed by Pollard by
combining the tritiated thymidine method with a reverse probe DNA hybridization technique
was quantified using this method. Though the method provides a way of measuring in-situ
growth rates of microorganisms in mixed cultures, the limitations associated with the tritiated
thymidine method still hold. In addition, a new host of issues introduced by the reverse DNA
hybridization technique, including cross hybridization and hybridization efficiency, prevent
the method from becoming widely adopted.
1.5.4.2 Bromodeoxyuridine incorporation
Bromodeoxyuridine (BrdU), a thymidine analogue, is detected via
immunocytochemistry. Instead of calculating growth rate from a conversion factor, a
standard curve correlating fluorescence intensity to specific growth rate is required.
BrdU offers several advantages over [3H]thymidine. It is non-radioisotopic and also offers greater specificity of detection because the antibodies will not detect chemicals formed
from metabolism of BrdU. The assay is able to preserve microspatial growth information
and can distinguish between closely located individual cells unlike microautoradiography
(15).
Though the advantages over [3H]thymidine make the assay useful for certain types of studies, BrdU still has some of the same limitations as [3H]thymidine. It is not species specific, though it could be if combined with an identification method such as fluorescence
in-situ hybridization (FISH) (38). Also, like thymidine, not all bacteria are capable of
Additional limitations of BrdU, not associated with the thymidine method are cell
permeability, BrdU’s mutagenic properties and metabolism of BrdU.
BrdU is a fixed cell method. Extensive optimization is required to treat cells so that
cell walls and membranes are permeable enough for penetration of the enzyme to bind to
labeled DNA. Pernthaler and Hamasaki demonstrate this for marine bacteria, but the process
would need to be optimized specifically for each type of assay. Additionally, the
permeabilization method often leads to high levels of species-specific cell loss (38).
BrdU is known to undergo tautomeric shifts that allow it to bind to guanine instead of
adenine. Upon replication, DNA polymerase recognizes the mismatch and eliminates one of
the two bases (38) potentially causing a mutation which can affect growth rate. BrdU also
increases susceptibility of DNA to inactivation by UV or visible light, requiring incubations
to take place in the dark which would make the technique not viable for phototrophic bacteria.
The optimized amount of BrdU addition is 1 µM in natural seawater (15) and at this
concentration, stimulation of growth by BrdU metabolism may become significant resulting
in misleading growth rate estimates.
1.5.4.3 Adenine
Similar to thymidine incorporation into DNA, adenine incorporation into RNA has
also been investigated as a measure of growth rate. Adenine nucleotide pool turnover is
another radiolabeling technique used to measure growth rate of bacteria in-situ. The
pools (i.e., ATP, TTP, UTP, etc.), is in equilibrium with the removal of the triphosphate
precursors required for cellular biosynthesis which is directly related to growth rate (µ). The
adenine nucleotide (AN) pool does not systematically vary with changes in growth rate.
Therefore the turnover rate of the intracellular AN pool must vary in direct proportion to the
rates of nucleic acid synthesis. Therefore, a positive correlation is expected to exist between
cellular AN flux and µ. AN pool turnover time can be calculated by monitoring the change
in the specific activity of the ATP pool with incubation time. One turnover is the time
required for the ATP pool to achieve a specific radioactivity that is equal to 50% of the value
at isotopic equilibrium. The growth rate is calculated from AN pool turnover as follows (22):
• Specific activity of the ATP pool at any time (SAt) = 1 - (2-N), where N = # of
turnover cycles
• AN pool turnover time (T) = t/N, where t = incubation period • T = 2.5% of generation time (Td) irrespective of growth rate
• Therefore, the growth rate (µ) = 1/Td x ln 2
The limitations of this technique are similar to the tritiated thymidine assay. It is not
weakness of the assay is that it requires a large number of independent assumptions; should
any of these be proven not applicable, the method would be invalid for that particular system.
1.5.4.4 Leucine incorporation
[3H]leucine or [14C]leucine is used to measure the rate of protein synthesis similarly to [3H]adenine incorporation into RNA or [3H]thymidine into DNA. The rate of protein synthesis gives a more direct measure of cell biomass and can be correlated with growth rate
(32). Riemann and Bell (42) found that the [3H]leucine and [3H]thymidine give equivalent results, but that the [3H]leucine had the added advantages of increased sensitivity (cells incorporate 10 times more leucine during growth than thymidine) and also increased
specificity. Incorporation of leucine in molecules other than protein is less likely than
thymidine being incorporated into non-DNA molecules. Though there is increased
specificity as far as incorporation into only protein, there is less specificity in this method due
to the fact that the leucine is incorporated into all protein, algae and bacteria alike. Size
fractionations have been suggested as a method of differentiating the growth rates (42).
1.5.5 Frequency of dividing cells
The frequency of dividing cells (FDC) is a method of estimating bacterial growth by
counting the number of dividing cells at a given point in time. Hagstrom et al. (14) used the
method to determine bacterial growth rates in water samples from the Baltic Sea. Cells were
preserved with formaldehyde and stained with acridine orange. Dividing bacteria were
Growth rate was determined from a graph by knowing temperature and percentage of
dividing cells.
Riemann et al. (42) found good correlation between FDC and thymidine
incorporation for bacteria in coastal environments. However, the FDC method assumes all
bacteria are active. When FDC estimates of biomass were corrected for percent active
bacteria determined from microautoradiography, production rates increased by 28%. If a
significant portion of the population is not active, the FDC method will underestimate the
production rate of the active portion.
The greatest advantage of this method is that it is relatively basic, requiring only a
microscope. However, as a result, FDC has many of the same limitations as microscopy
counting of cells. It is difficult to distinguish dividing cells using only epifluorescence
microscopy, scanning electron microscopy (SEM) solves this problem, but is too tedious to
employ for frequent measurements. Also, FDC curves have only been determined for a small
number of environments and can only determine the average growth rate of the community
being analyzed. Unless combined with an identification technique such as 16S rRNA FISH,
FDC cannot be used for evaluation of species-specific growth rates.
1.5.6 Adenylate energy charge
ATP is a molecule synthesized as a means of short-term energy storage for cells. The
level of ATP has been found to be proportional to growth rate. Relative abundance of ATP
formed. The adenylate energy charge (AEC) is the most commonly used expression of this
ratio (52):
AEC = (ATP + ½ ADP) / (ATP + ADP + AMP)
Chapman (6) measured AEC during different growth stages of E.coli and found that
actively growing cells had an AEC of 0.8, while viability is maintained at AEC from 0.8-0.5
and dying cells have AEC lower than 0.5.
Wiebe and Bancroft (52) used AEC to measure the growth state of marine bacteria
both in water and sediment. Jewson and Dokulil (20) measured AEC of freshwater bacteria
and Webster et al. (51) measured AEC during the growth of Bacillus stearothermophilus.
All three groups recognized the largest limitation of the method to be the difficulty of
extracting ATP without changing the AEC. Filtration and especially centrifugation
significantly lower AEC. Wiebe and Bancroft found that filtration lowered the AEC to the
point of not being able to distinguish between bacteria in the stationary versus log phase.
Additionally, AEC can only vary from 0 to 1, and since most active cells have an AEC > 0.5,
this parameter does not have a wide enough range to accurately describe the possible range
of growth rates of microorganisms. Therefore, the AEC can only be used to describe growth
rate generally (9). Another limitation is that all organisms contain ATP, and therefore the
method cannot be made to target specific organisms or even types of organisms. Though
there is the benefit of no incubation or added substrate requirements, the limitations of this
1.5.7 RNA-based techniques
RNA has long been thought to be positively correlated with growth in cells. Caldwell,
Mackor and Hinshelwood (4) found this to be true for Aerobacteraerogenes in 1950. DNA
per cell was found to be constant regardless of growth conditions. Schaechter, Maaloe and
Kjeldgaard (44) also showed this relationship to be true for Salmonellatyphimurium in 1958.
Dortch et al. (9) assembled a compilation graph of growth rate versus RNA:DNA
ratio for a number of these early studies on Aerobacter aerogenes, Salmonella typhimurium
and Escherichia coli. Applying a single linear correlation to all of the data, an R2 value of 0.634 was obtained. The RNA:DNA ratios for these organisms all fall in the range of
approximately 3-14, for a growth rate range of 0.2-2.4 h-1.
More recently, Muttray and Mohn used modified orcinol and diphenylamine reactions
to study the relationship between growth rate and RNA:DNA ratio of five isolates of resin
acid-degrading bacteria in activated sludge treating pulp and paper mill wastewater. Four of
the five isolates showed positive, linear correlation between growth rate and RNA:DNA ratio
(r2 > 0.9) (34). One strain was examined by slot-blot hybridization and also showed positive correlation between growth rate and RNA:DNA ratio (33).
Kemp, Lee and LaRoche (24) found high correlations for marine bacterial isolates
from the Sargasso Sea and Georges Bank water columns and also Georges Bank sediment.
RNA:DNA ratio (r = 0.93-0.99). RNA content per cell vs. cell volume was not at all
correlated.
Kerkhof and Ward (25) compared ethidium bromide (EtBr) fluorometry and
membrane hybridization for determining the relationship for another marine bacteria,
Pseudomonasstutzeri. The EtBr method measured only relative fluorescence of RNA and
DNA; absolute quantities were not determined. Growth rates ranged from approximately
0.01-0.125 (h-1) and RNA:DNA ratios ranged from approximately 1.98-2.7 for fluorometry and 0.5-1.5 for membrane hybridization. The suspected cause of the lower ratios for
membrane hybridization was inefficient detection of rRNA versus the rRNA gene. This
group also compiled historical data set using the same A. aerogenes and S. typhimurium but
different E.coli data sets as Dortch et al. (9) and also including P.stutzeri data from their
study and interestingly obtained an r2 = 0.922 for a least squares fit of all the data points.
Ribosomal RNA has been targeted extensively in microbial ecology because of its
characteristics. It is structurally conserved across all three domains: Eucarya, Bacteria and
Archaea, but also contains regions which are highly specific allowing for species level
identification. Of the three subunits of ribosomal RNA, the 16S is the most targeted. The 5S
is too small to offer enough variability, and the 23S, due to its size, has not been sequenced
much and the database of 23S sequences is not very extensive in comparison with the 16S
database. Though the 16S database offers a lot more information, this gene may not be
specific enough to differentiate between sub-species. Those looking for this level of
relationship to growth rate (5, 37). Though pre 16S rRNA is much more specific, it is also
much more labile, and the relationship to growth rate needs more investigation.
Many methods are available for quantitating RNA and DNA within the context of
determining species-specific growth rate. EtBr fluorometry (25, 24), membrane
hybridization (33), FISH (17), competitive PCR (35) and most recently real-time PCR are
among the most popular techniques. Of these, real-time PCR offers the greatest sensitivity
with a theoretical detection limit of one gene copy, the largest dynamic detection range of up
to 108 fold and also the highest throughput, up to 384 samples simultaneously depending on the system, with results in a matter of hours.
1.6 Conclusions
Bulking is a serious problem in WWTP worldwide caused by overgrowth of
filamentous bacteria. Determining the in-situ growth rate of these organisms would lead to
vast opportunities in understanding more about these organisms to develop more effective
ways of controlling the problem. An easy, accurate and straightforward method to measure
in-situ growth rate of microorganisms with species level specificity has eluded
microbiologists for decades. With the exception of the DNA hybridization/thymidine assay
and RNA based techniques, the methods described are only capable of assessing the growth
rate of pure cultures or the average growth rate of a community.
The method proposed here is to use real-time PCR to quantitate RNA and DNA to
ability to relatively simply and accurately determine the in-situ growth rate of a particular
2 Developing PCR Assays to Quantify DNA & RNA of Arthrobacter globiformis &
Sphaerotilus natans
2.1 Competitive PCR
2.1.1 Introduction
The Polymerase Chain Reaction (PCR) is a powerful method used in biotechnology.
At its core, PCR is essentially a method of making many copies of a given target sequence of
DNA. A typical PCR reaction mix requires buffer, primers, dNTPs, DNA template and DNA
polymerase, usually Taq polymerase. The reaction takes advantage of DNA’s
thermodynamic properties by defining the three steps of the reaction by different
temperatures: denature (95°C), anneal (50-60°C) and elongate (72°). The value of the
technique is in its versatility. Depending on the design of the primers, different parts of DNA
can be manipulated and amplified. Some applications of PCR include species identification,
cloning and site-directed mutagenesis. In combination with other molecular techniques, the
questions to be answered using this technique are limitless.
Though conventional PCR is an invaluable technique in the biotechnology world, its
use is limited to qualitative purposes. During the initial cycles of the PCR reaction, the
efficiency is very near to 100% which means that the number of copies of the amplicon is
doubled each cycle. As the reaction progresses, efficiency decreases due to a number of
reasons which could include breakdown of enzyme and reactant limitations. The number of
every reaction, even in replicates, and makes it impossible to quantify species specific DNA
in the original sample based on final concentrations.
Competitive PCR (cPCR) is a method which allows for quantitation of DNA by using
an internal standard. The standard, or competitor, is amplified by the same primers as the
target sequence but differs from the target enough to be detected in end point analysis. Since
the competitor and target DNA are amplified by the same set of primers, they compete for
the primers during the PCR reaction. The target and competitor oligonucleotides are
co-amplified in the same tube therefore the factors thought to affect PCR amplification
efficiency such as salt concentration and presence of inhibitors affect both oligonucleotides
equally.
The original amount of target in the sample can be back calculated from the formula:
i i N i N i f f C T e) (1 C e) (1 T C T = + + = (1)
where ‘T’ and ‘C’ are the concentrations of target and competitor DNA respectively, ‘e’ is
the reaction efficiency, ‘N’ is the number of cycles, and the ‘i’ and ‘f’ subscripts refer to
initial and final concentrations (18). The final quantities of target and competitor DNA are
known as well as initial quantity of competitor. Since the efficiency for target and
competitor DNA and number of cycles are equal for both target and competitor, the initial
quantity of target DNA can be calculated from a simple ratio.
The objective of this work was to develop cPCR assays to accurately quantify RNA
2.1.2 Materials and methods
2.1.2.1 Bacterial strains and culture conditions
Sphaerotilus natans (SNA) was chosen as the representative filament for a number of
reasons. It is historically the most studied bulking organism and has been shown to cause
bulking in activated sludge wastewater treatment plants worldwide (50). Additionally,
previous work has shown that wastewater treatment plants in Raleigh and Cary, North
Carolina contain SNA and have the potential to bulk (23). The SNA strain, obtained from
ATCC (15291), was isolated from paper-mill slime and was grown in CYGA medium (pH 8)
on a shaker at 26°C. One liter of CYGA medium contains 5 g casitone (BD 225930), 10 g
glycerol, 1 g yeast extract, 1 liter of distilled water (1). Arthrobacter globiformis (AGF) was
chosen as the representative floc-former for this project. The AGF strain, also obtained from
ATCC (8010), was grown on nutrient broth (Difco 234000) at 26°C. Glycerol stocks of both
cultures were made for long-term storage. These stocks were made according to the
following protocol:
1. Grow bacteria overnight in liquid media at 26°C
2. Centrifuge 15 mL of cell culture and decant liquid
3. Resuspend cell pellet in 0.85 mL of fresh, sterile media
4. Transfer mixture to a sterile 2 mL centrifuge tube
5. Add 150 µL of sterile glycerol, vortex to mix
2.1.2.2 cPCR Primer Design
PCR primers targeting the 16S rRNA gene were designed for both SNAand AGF by
creating an alignment of all known sequences of the respective organism from the GenBank
database (36). In addition to the sequences retrieved from GenBank, two sequences from
MWG Biotech, Inc. were also included in the alignment. PCR product amplified from
genomic DNA with bacterial primers 8F and 1492R were prepared and sent for sequencing
as described in Section 2.1.2.6. Two aliquots of the same purified PCR product were sent,
one to be sequenced with the 8F primer, the other with the 1492R primer. Two aliquots were
sent because the maximum DNA length that can be analyzed is approximately 700 bp. The
sequence from the 8F primer was inserted into the alignment as returned from MWG. The
reverse complement of the 1492R sequence was used in the alignment.
Table 2.1 lists the accession number and description of all sequences used in the SNA
alignment. Full sequences can be found in Appendix A. Eikelboom1701 and Leptothrix
mobilis are close relatives of SNA; these sequences were included in the alignment as a
negative check. Regions of the gene sequence that targeted all of the SNA sequences but not
Eikelboom nor Leptothrix were chosen as potential priming sites. Potential priming sites
were then screened using the Ribosomal Database Project (RDP). Sites that had the highest
specificity in RDP were then Blasted against sequences in GenBank. Trial and error was
used to find the most specific primers possible. All primers were ordered from Integrated
AGF primers were designed in a similar fashion. Table 2.2 shows the sequences used
for the alignment, SNA along with L. mobilis, M. luteus, A. rhombi and B. rhamnosum
sequences were added as negative checks. The results of the primer design are show in Table
2.3 and RDP search and Blast results of each primer as of July 11, 2007 are shown in
Appendix C.
Table 2.1 - Sequences used for SNA primer design
Seq # Accession Description
00 Z18534 S.natans 16S ribosomal DNA
01 AB087568 Sphaerotilus sp. L19 gene for 16S rRNA, partial sequence 02 AB087567 Sphaerotilus sp. L13 gene for 16S rRNA, partial sequence 03 AB087566 Sphaerotilus sp. L12 gene for 16S rRNA, partial sequence 04 AB087564 Sphaerotilus sp. L7 gene for 16S rRNA, partial sequence 05 AB087563 Sphaerotilus sp. L6 gene for 16S rRNA, partial sequence 06 AB087560 Sphaerotilus sp. L1 gene for 16S rRNA, partial sequence 07 AB087565 Sphaerotilus sp. L8 gene for 16S rRNA, partial sequence 08 AB087561 Sphaerotilus sp. L2 gene for 16S rRNA, partial sequence 09 AB087562 Sphaerotilus sp. L3 gene for 16S rRNA, partial sequence 10 AF072915 Sphaerotilus sp. IF5 16S ribosomal RNA gene, partial
sequence
11 AF072914 Sphaerotilus sp. IF4 16S ribosomal RNA gene, partial sequence
12 AF072916 Sphaerotilus sp. IF9 16S ribosomal RNA gene, partial sequence
13 AF072917 Sphaerotilus sp. IF14 16S ribosomal RNA gene, partial sequence
14 AB072236 Sphaerotilus natans gene for 16S rRNA, partial sequence 15 L33980 Sphaerotilus natans 16S ribosomal RNA (16S rRNA)
16 L33978 Sphaerotilus natans 16S ribosomal RNA (16S rRNA) 17 L33977 Sphaerotilus natans 16S ribosomal RNA (16S rRNA) 18 L33976 Sphaerotilus natans 16S ribosomal RNA (16S rRNA) 19 L79964 Eikelbloom type 1701 ribosomal RNA gene, complete
sequence
20 X97071 L.mobilis 16S rRNA gene
21 --- S.natans MWG sequence from 8F primer
22 --- S.natans MWG sequence from 1492 (reverse complement) 23 AJ534666 Uncultured beta proteobacterium partial 16S rRNA gene,
Table 2.2 - Sequences used for AGF primer design
Seq # Accession Description
00 AB089841 Arthrobacter globiformis gene for 16S rRNA
01 AB098573 Arthrobacter globiformis gene for 16S rRNA, partial sequence
02 F321068 Arthrobacter globiformis strain U17 16S ribosomal RNA gene, partial sequence
03 X80736 A.globiformis 16S rDNA
04 AY561601 Arthrobacter sp. RG-39 16S ribosomal RNA gene, partial sequence
05 Z18534 S.natans 16S ribosomal DNA 06 X97071 L.mobilis 16S rRNA gene
07 AJ409095 Micrococcus luteus 16S rRNA gene, strain D7
08 AJ415376 Brachybacterium rhamnosum partial 16S rRNA gene, type strain LMG 19848T
09 AY509239 Arthrobacter rhombi strain S189 16S ribosomal RNA gene, partial sequence
10 --- AGF sequence from MWG (8F)
11 --- AGF sequence from MWG (1492R – reverse complement)
Table 2.3 - cPCR Primer sequences and specifications
primer
name
Sequence
length
(bp)
Tm1 GC% location
Accession
No.
SNA229F CTACCAAGCCTGCGATCTGTAGCT 24 60.50 54.20 229-252 AB087568 SNA550R GGGGATTTCACATCTGTCTTATGGAA 26 56.70 42.30 550-575 AB087568 AGF946F TGGACCGGACCGCCGCAGAAATGTG 25 67.20 64.00 946-970 AB089841 AGF1066R CCCATGAGTCCCCGCCATTACGCG 24 66.00 66.70 1082-1105 AB089841 1
Calculated using OligoAnalyzer 3.0 (47)
2.1.2.3 Creating competitor
The competitor for each species was created using conventional PCR with modified
reverse primers using genomic DNA as template. For SNA, two modified reverse primers
base pair tail which was composed of a 24 base insertion sequence which included cutting
sites for HindIII and BamHI restriction enzymes.
The loop primer was named such because the primer is designed so that the 24 base
insertion forms a loop when the primer initially anneals to the target sequence (see Figure
2.1). The SNARlinear primer was designed for SNA such that the 17 bases were
complementary to a region 24 bases upstream of the 24 bases that are complementary to the
target DNA (see Figure 2.1). The forward primers used to create competitors are the same as
those used for cPCR. The competitors designed in this way will have the same priming sites
as the target DNA, but will be distinguishable on an agarose gel because they will be 24
bases longer. The size of the insertion for the competitor is somewhat arbitrary. It is
assumed that 24 bases are large enough to differentiate on regular agarose gels, while still
small enough to not greatly affect PCR efficiency. Sequences of primers for creation of
competitors are shown in Table 2.4.
The 25 µL PCR reaction contained 15 µL of PCR buffer mix, 0.5 µL of forward
primer, 0.5 µL of the modified reverse primer, 8.2 µL of sterile water, 0.3 µL Taq
polymerase and 0.5 µL of extracted genomic DNA as template. The PCR cycle had an initial
denaturing step for 5 min at 94°C, then 30 cycles of denaturing for 1 min at 95°C, annealing
for 50 s at 55°C and extension for 1 min at 72°C and a final extension step for 20 min at
72°C. The FailSafe PCR System from Epicentre Biotechnologies with PreMix E was used
Genomic DNA was obtained for PCR by growing SNA culture overnight, pelleting
cells, then extracting with the Powersoil DNA Isolation Kit from MoBio (Cat. No 12888-50).
The manufacturer’s instructions were followed with no modifications.
Figure 2.1 - Linear and loop primers for creating competitor
Table 2.4 - Modified reverse primer sequences used to create competitors
primer name Sequence
SNARloop
GGGGATTTCACATCTGTCTTATGGAAAAGCTTAGTCATAGAACT GGATCCCCGCCTGCGCACGCTTT
SNARlinear
GGGGATTTCACATCTGTCTTATGGAAAAGCTTAGTCATAGAACT GGATCCGTAATTCCGATTAACGC
AGFloop
CCCATGAGTCCCCGCCATTACGCGAAGCTTAGTCATAGAACTG GATCCCTGGCAACATGGAACGA
AAGCTT – Cutting site for Hind III GGATCC – Cutting site for Bam HI
ATAGAA – 24 base insertion (not complementary to template DNA) 3’
3’ 5’
5’ Forward primer
reverse primer 17 bp
24 bp Insertion
3’
3’ 5’
5’ Forward primer
reverse primer 17 bp
RNA competitors were created by in vitro transcription of the DNA competitor. SNA
DNA competitors were linearized with EcoRV restriction enzyme (Promega) at 37°C for 1.5
hours. The enzyme was then inactivated by heating for 15 min at 80°C. Each 20 µL digest
contained 13.3 µL of sterile water, 2 µL of 10X RE Buffer, 0.2 µL of Acetylated BSA (10
µg/ µL), 3 µL of DNA (1 µg/ µL) and 0.5 µL of EcoRV (10 U/ µL). The results were
verified on a gel and quantified with a spectrophotometer. Next, the linearized competitor
DNA was in vitro transcribed to produce RNA with the AmpliScribe™ T7 High Yield
Transcription kit from Epicentre. The RNA from in vitro transcription was quantified using
a spectrophotometer, then was reverse transcribed to produce cDNA using the RETROscript
® kit from Ambion. PCR is then run on the cDNA.
2.1.2.4 Cloning
Copies of the competitor were made by cloning to reduce the chance of sequence
errors introduced by Taq Polymerase. Cloning was carried out using an Invitrogen TA
Cloning kit. Each 10 µL ligation mix contained 1 µL of competitor PCR product, 1 µL 10X ligation buffer, 2 µL of PCR vector 2.1, 5 µL of sterile water and 1 µL of T4 DNA Ligase.
The mix was incubated at 14°C overnight, then stored at -20°C until the transformation
reaction. The plasmid was transfected into chemically competent E.coli cells according to
the following protocol (adapted from the Invitrogen TA Cloning Manual, (16)):
1. Thaw One Shot® cells on ice.
2. Pipette 1-2 μl of each ligation reaction into cells and stir gently with pipette tip to
3. Incubate the vials on ice for 30 minutes.
4. Heat shock for 30 seconds at 42°C without shaking. Transfer vials to ice.
5. Add 250 μl of S.O.C. medium to each vial.
6. Shake the vials at 37°C for 1 hour at 225 rpm.
7. Plate 10 μl to 200 μl from each transformation vial on an LB plate containing
100-μg/ml ampicillin.
8. Incubate plates overnight at 37°C.
Thirteen and ten colonies were chosen for SNA and AGF respectively for PCR
verification of presence of the competitor. The cells were diluted in sterile water and 0.5 µL
of the dilution was used as template in whole-cell PCR. Each 12.5 µL reaction contained
6.25 µL of 2X buffer, 0.15 µL of Taq DNA polymerase, 4.975 µL of sterile water, 0.3125 µL
of the forward and reverse primers, and 0.5 µL of template. The PCR products were verified
on a 1% agarose gel run for 1 hour at 100V. After the gel, five clones were grown overnight
at 37°C then pelleted, and plasmid was extracted using the Wizard Plus SV Minipreps DNA
Purification System from Promega (Cat. No. A1330). Aliquots of the extracted plasmids
were sequenced for confirmation of the presence of the correct competitor sequence. Once
the sequence was confirmed, one clone was chosen and grown in a large amount of LB
media overnight to obtain enough competitor plasmid for use during all future experiments.
Plasmid was extracted from pelleted cells, quantified using a spectrophotometer and stored
2.1.2.5 cPCR
Each cPCR run consists of many individual PCR reactions containing a constant
amount of environmental sample with serial dilutions of the competitor. Each 25 µL mix
contained 12.5 µL of buffer, 0.5 µL of each primer (0.5 µM), 0.3 µL of Taq polymerase, 0.5
µL template, 0.5 µL of one part of the serial dilution of competitor plasmid.
The cycling parameters of the reaction are as follows: 94°C for 5 min, then 30 cycles
of 94°C for 50 s, 60°C for 45 s, and 72°C for 1 min, then 72° for 7 min and a final hold at
4°C.
SNA PCR products were visualized on a 3% agarose gel stained with ethidium
bromide for 4 hours at 80V. AGF PCR products were visualized on 2% agarose gels for 1.5
hours at 105 volts. Each cPCR run included a positive control of genomic DNA of SNA or
AGF and a negative control with deionized water.
Gel-Pro Analyzer software from Media Cybernetics was available to quantify bands
on gels.
2.1.2.6 Sequencing
Clones were sequenced by MWG Biotech, Inc. to verify the presence of the
competitor. Additionally, SNA and AGF samples were sequenced occasionally to verify the
log-phase then pelleted. Plasmid DNA was extracted from the pellet, quantified via
spectrophotometry and diluted to MWG’s specifications, then mailed and sequenced.
To verify purity of cultures, bacteria were grown to mid-log phase then pelleted.
DNA was extracted from the pellet and PCR amplified with bacterial primers 8F and 1492R.
The PCR product was purified with Qiagen’s QIAquick PCR Purification kit (Cat. No.
28104), quantified with a spectrophotometer, diluted to MWG’s specifications, then 2
aliquots were mailed and sequenced, one with the 8F primer and the other with 1492R. The
2.1.3 Results and discussion
2.1.3.1 Creating competitors
Conventional PCR was run to create competitors. Figures 2.2 and 2.3 show the
creation of SNA and AGF competitors respectively. Competitors were created with normal
forward primers and modified reverse primers. Target DNA refers to genomic DNA of each
species amplified with cPCR primers. Though the target and competitor DNA appear to be
the same size in Figure 2.2, this is because the 1% gel was only run for 1 hour at 95 volts.
Further experiments (Section 2.1.3.3) were performed to optimize gel conditions for
separation of SNA competitor and target DNA. The SNA competitor created with the loop
primer was used for all future experiments. The loop primer method was also employed for
creating the AGF competitor.
Figure 2.2 - Verification of creating SNA competitors
Lane 1 – Ladder; lane 2 – competitor created with loop primer; lane 3 – NTC; lane 4– competitor created with linear primer; lane 5 – SNA target DNA
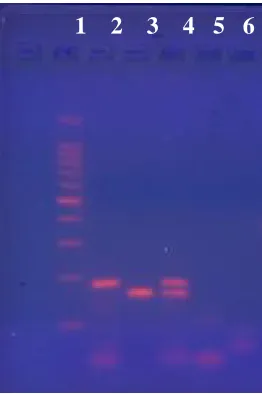
Figure 2.3 - Verification of creating AGF competitors
Lane 1 – ladder, lane 2 – AGF competitor; lane 3 – AGF target; lane 4 – mix of AGF competitor and target; lane 5 – NTC with competitor primers; lane 6 – NTC with target primers
2.1.3.2 Cloning competitors
Copies of competitors were made by cloning instead of additional PCR to avoid
sequence errors introduced by Taq polymerase. The steps of cloning and verification of
cloning products were:
1. Ligation of plasmid with PCR 2.1 vector
2. Transfection of ligation product into competent E.coli cells
3. Plate cells and grow overnight
4. Pick at least 10 colonies to analyze for plasmid
5. Perform whole cell PCR on cells from chosen colonies with cPCR primers
6. Visualize PCR products on an agarose gel
Clones containing competitor sequence should show a bright band, clones with no
competitor should show no band. Figures 2.4 and 2.5 show the cloning results of SNA and
AGF respectively. Thirteen SNA and ten AGF clones were chosen for analysis, all of which
contained competitor plasmid.
Figure 2.4 - Gel of SNA cloning results
Lanes 1 and 13 – 50 bp step ladder; lanes 2 – 12, 14 and 15 – PCR product of SNA clones showing presence of competitor
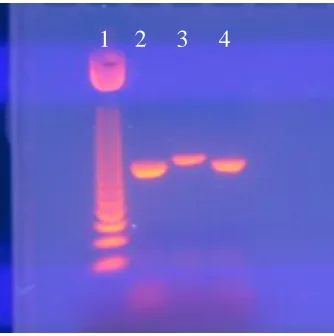
Figure 2.5 - Gel of AGF cloning results
Lane 1 – 50 bp step ladder; lanes 2-11 – PCR product of AGF clones showing presence of competitor; lane 12 – no template negative control
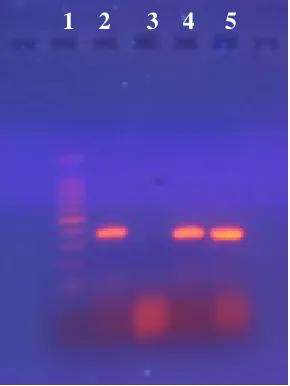
2.1.3.3 Optimizing gel conditions
Several experiments were run to optimize the gel conditions for separating SNA
target DNA from SNA competitor DNA. Agarose concentration, time and amount of DNA
1 2 3 4 5 6 7 8 9 10 11 12
13 14 15
were tested. Figures 2.6-2.8 show three of these runs. Each run had one lane of target DNA,
one lane of competitor DNA (PCR amplicon, not competitor plasmid), and a mix of target
and competitor DNA. After many attempts, the conditions chosen for cPCR were 3%
agarose run for 4 hours at 80V.
Figure 2.6 - Optimizing gel conditions for SNA cPCR 1
2% agarose, 2 hours, 80V; Lane 1 – 50 bp step ladder (5 µL); lane 2 – target SNA DNA (4 µL); lane 3 – SNA competitor DNA (4 µL); lane 4 – mix of target and competitor DNA (4 µL of each)
Figure 2.7 - Optimizing gel conditions for SNA cPCR 2
2% agarose, 2 hrs, 80V; Lane 1 – 50 bp step ladder (2.5 µL); lane 2 – target SNA DNA (1 µL); lane 3 – SNA competitor DNA (1 µL); lane 4 – mix of target and competitor DNA (1 µL of each)
1 2 3 4