Abstract— Crossbars are main components of communication switches used to construct interconnection networks. Scheduling algorithm controls contention in switch architecture. Several scheduling algorithms were proposed for input-queued crossbar switch architectures. This paper suggests a Dynamic Scheduling Algorithm (DSA). This algorithm changes the priority rotation dynamically based on two parameters: queue occupancy and quality of service of input and output. DSA efficiently utilizes the buffers and at the same time gives good service to the selected inputs and outputs. The simulation results show that DSA saves loss of the cells due to buffer overflow and thus increases the throughput by 2% to 4% compared to its counter part. DSA reduces the latency for prescribed Quality of Service class input output and increases the average latency.
Index Terms—: Crossbar switches, QoS (Quality of Service), Scheduler, VOQ (Virtual output Queuing)
I. INTRODUCTION
Crossbars (NxN) switches play a major role in the design of high speed interconnection networks. Architecture of a single-stage, non-blocking switch fabric has three basic parts as shown in figure 2.
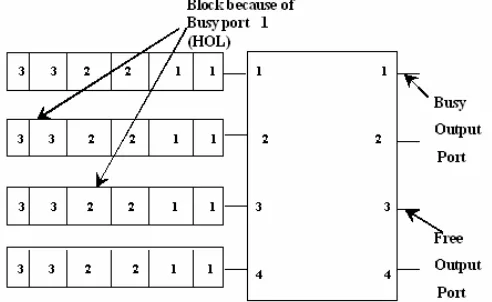
1. Queue Structure – Input queuing is increasingly used for high bandwidth switches and routers. If an input-queued switch employs a single FIFO queue at each input, as shown in figure 1 then Head of Line blocking (HOL) problem limits the throughput to 58.6% [3].
In figure 1 HOL blocking occurs when a cell at the head of queue waiting for a busy output, blocks a cell behind it that is destined to an idle output. To solve the HOL problem,VOQ is used.[2], [6], [8].
Manuscript received February 23, 2007. Mihir V Shah is with EC department, L.D.College of Engineering, Ahmedabad 380015,INDIA. He is also a Ph.D Student at Electrical Department, Faculty of technology and Engineering, kalabhavan, M.S. University, Vadodara, INDIA ([email protected]).
Mehul C. Patel is with EC department, L.D.College of Engineering, Ahmedabad 380015, INDIA ([email protected]).
Dinesh J. Sharma is with L&T Limited, Vadodara, INDIA. ([email protected] ).
[image:1.612.328.574.193.344.2]Ajay I. Trivedi is with Electrical Engineering Department,Faculty of Technology and Engineering, Kalabhavan, M.S. University of Baroda, Vadodara, INDIA. ([email protected])
Figure 1. An input buffered single FIFO queue switch. Each input maintains N FIFO VOQs, one for each output. Qij denotes the VOQ at input i containing cells destined to output j as shown in figure 2.
2. Crosspoint Switch (Switch Fabric) – A crossbar switch can transfer cells between multiple ports simultaneously by operating multiple cross points.
3. Scheduler – It is a clever device selecting configurations for the switch fabric to transfer cells from inputs to outputs. Scheduler manages cell transfer and solves contentions within the switching fabric. Switch throughput can be increased from 58.6% to 100% with a centralized scheduling algorithm [6].
Figure 2. NxN crossbar switch with VOQ structure
Dynamic Scheduling Algorithm for
input-queued crossbar switches
Mihir V. Shah, Mehul C. Patel, Dinesh J. Sharma, Ajay I. Trivedi
[image:1.612.332.542.550.681.2]In this implementation, it is assumed that the fabric handles fixed size cells but variable sized cells can also be routed by using some sort of cell dissembler and assembler.
Each input port competes for multiple output ports but can communicate with only one at a time. Likewise, each output port vies for multiple input ports but can communicate with only one at a time. Hence, scheduling process is symmetric with respect to inputs and outputs.
The scheduling problem for NxN crossbar switch with VOQ is defined as follows: for each input port i, there are n request lines going to the scheduler: Ri,1; Ri,2 ; ; ; Ri,n. Ri,j = 1 indicates that there is a request from input port i to switch a cell to output port j. Correspondingly, there are n grant lines produced by the scheduler: Gi,1; Gi,2; ; ; ; Gi,n. Gi,j = 1 means that the scheduler has granted the request from input port i to switch a cell to output port j depending on the scheduling algorithm. To ensure that each input delivers at most one cell into the crossbar fabric, and that each output receives at most one cell, the conditions Σn
j =1 Gi,j ≤ 1; for 1 ≤ i ≤ n and Σni =1 Gi,j ≤ 1; for 1 ≤ j ≤ n must hold, respectively. [4]
The paper presents the simulation of 4x4, 8x8, 16x16, and 32x32 crossbar switches with Round Robin Matching (RRM), iSLIP, Rectilinear Propagation Architecture(RPA), Diagonal Propagation Architecture(DPA), Modified Diagonal Propagation Architecture( m-DPA) and Dynamic Scheduling Architecture(DSA), scheduling algorithms. Paper also presents the design and implementation of 4x4 and 8x8 crossbar switches with DPA, m-DPA and DSA scheduling algorithms.
Rest of the paper first discusses related work in section 2, and then describes DSA algorithm in detail in section 3, simulations in section 4, and implementations in section 5. Section 6 describes conclusion. Section 7 presents our references.
II. RELATED WORK A. DPA architecture
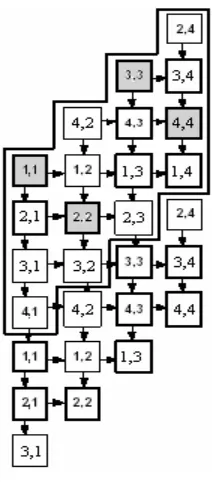
Diagonal Propagation Architecture was design by Hurt, A. May, X. Zhu, and B. Lin as shown in figure 3.[4] The N cross points of any NxN crossbar switch fabric are guaranteed not to conflict since they are all on different rows and columns. If the scheduling process begins with all N cross points lined upon a diagonal, then granting one of them cannot disable granting others because they are independent of each other. As shown in figure 3 for 4x4 crossbar switch case, there are 4 such diagonal groups:
G1: (1, 1); (4, 2); (3, 3); (2, 4) G2: (2, 1); (1, 2); (4, 3); (3, 4) G3: (3, 1); (2, 2); (1, 3); (4, 4) G4: (4, 1); (3, 2); (2, 3); (1, 4)
[image:2.612.391.497.47.288.2]At a time, N cross points are switched in DPA. So, arbitration cycle of DPA will finish in nearly NT time units. In DPA there are N possible priorities. Normal DPA rotates the priority in round robin fashion.
Figure 3 DPA architecture.
B. Modified DPA architecture (m-DPA) Stage
It is a modification of DPA in which instead of rotating the priority order in round robin fashion, m-DPA rotates it depending upon queue occupancy of the diagonal group.
Suppose buffer size in each VOQ is k and if buffer size of any cell reaches k then that cell enters into red-zone. During each time slot, numbers of cells whose buffers are in the red-zone for each diagonal group are calculated and priority is given to the group with maximum number of cells having red-zone buffers. In case if diagonal groups having equal number of red-zone cells are found, then priority vectors will rotate as usual in round robin fashion. Thus, the most urgent diagonal group which is likely to loose the packet is routed through the switch first, and so on. This way, scheme for priority order selection has a propensity towards saving cell loss in case of buffer overflows. Intuitively, benefit of the scheme will be puffed-up in cases of unevenly distributed and bursty traffics. Hence, throughput of the crossbar switch will be increased. This gain comes from the very basic fact that the hoard of every cell augments throughput. [9]
III. DYNAMICSCHEDULINGALGORITHM This paper proposes a Dynamic Scheduling Algorithm, DSA. The priority order is varied dynamically with respect to following corresponding parameters:
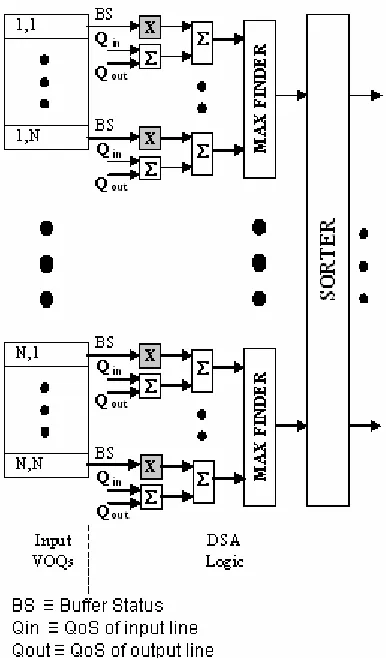
Figure 4. DSA Scheduler Architecture
Figure 4 depicts the architecture of DSA scheduler. QoS of a cross-point is obtained by summing QoS of corresponding input (Qin)and output(Qout) lines. Buffer status signal of a VOQ indicates the present percentage occupancy of the VOQ in terms of number of packets. It is multiplied by a variable factor (say K). This feature imparts dual behavior to the DSA. There are two cases; viz. BS < 100% and BS = 100%, for which K may assume one of the values given in table-I.
Table I: Values of K
Case K Behavior
< 2 Strong capitalistic = 2 Fair
BS < 100 %
> 2 Socialistic
BS = 100 % > 2 Socialistic and Cautious
For simulation and analysis purposes, it is assumed that K is 2 when BS was less than 100% and is 4 when BS was equal to 100%. That is, when queues are not overflowing, QoS and queue occupancy enjoy equal weightage (k=2). Thus, DSA decides priority in a dynamic order determined by QoS and queue occupancy. When any of the queues is fully occupied, i.e. it has reached into red zone [9] and is likely to loose packets, then; weightage of queue occupancy for that particular queue is doubled (k=4) compared to weightage of QoS. That is, DSA takes up a cautious step to avoid packet loss and to decrease packet latency by discouraging QoS and select
socialistic approach. This dual behavior (normally capitalistic and after buffer is full socialistic) of DSA makes it more dynamic and robust to different traffic models.
IV. SIMULATION RESULTS
RRM, iSLIP, RPA, DPA, m-DPA and DSA scheduling algorithms are simulated for 4x4, 8x8, 16x16, and 32x32 crossbar switches with four different traffic models ( A,B,C and D) using MATLAB 7.0. For each traffic model, algorithms were simulated for 10000 time slots and results were taken by averaging the outcomes for 100 times.
A. With i.i.d. Bernoulli arrivals and uniformly distributed destinations.
B. With i.i.d. Bernoulli arrivals and non-uniformly distributed destinations.
The effect of burstiness on DSA using an on-off arrival process is illustrated in traffic pattern C and D.
C. With bursty arrivals and uniformly distributed destinations.
D. With bursty arrivals and non-uniformly distributed destinations.
10 20 30 40 50 60 70 80 90 100
65 70 75 80 85 90 95 100
Offered load(%)
T
hr
oug
hpu
t E
ff
ic
ie
nc
y(
%
)
RRM RPA iSLIP DPA m-DPA DSA Bernoulli Arrivals Uniformly Distributed Destinations
[image:3.612.71.273.522.602.2]10 20 30 40 50 60 70 80 90 100 0 5 10 15 20 25 30 35 40 45 Offered load(%) A ver ag e L at en cy ( T im e s lo ts ) RRM RPA iSLIP DPA m-DPA DSA Bernoulli Arrivals Non-uniformly Distributed Destinations
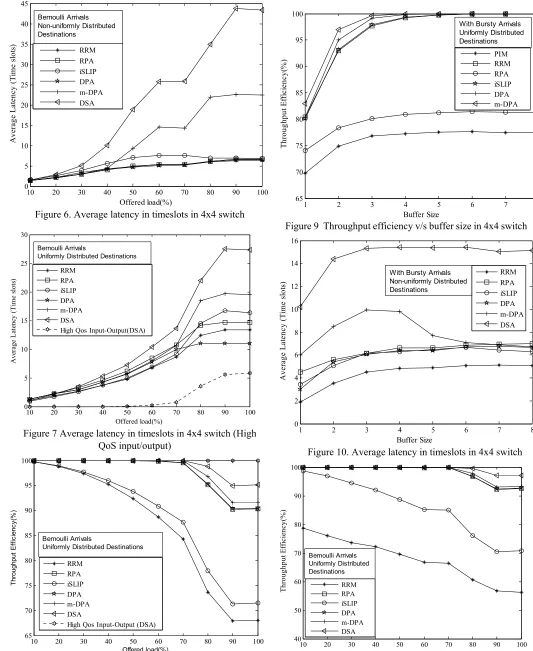
Figure 6. Average latency in timeslots in 4x4 switch
10 20 30 40 50 60 70 80 90 100 0 5 10 15 20 25 30 Offered load(%) A ver ag e L at en cy ( T im e s lo ts ) RRM RPA iSLIP DPA m-DPA DSA
High Qos Input-Output(DSA) Bernoulli Arrivals
Uniformly Distributed Destinations
Figure 7 Average latency in timeslots in 4x4 switch (High QoS input/output)
10 20 30 40 50 60 70 80 90 100
65 70 75 80 85 90 95 100 Offered load(%) T hr oug hpu t E ff ic ienc y( % ) RRM RPA iSLIP DPA m-DPA DSA
High Qos Input-Output (DSA) Bernoulli Arrivals
[image:4.612.47.309.53.257.2]Uniformly Distributed Destinations
Figure 8 Throughput efficiency v/s offered load for in 4x4 switch(High QoS input/output )
1 2 3 4 5 6 7 8
65 70 75 80 85 90 95 100 Buffer Size T hr oughput E ff ic ie nc y( %
) PIMRRM
[image:4.612.48.300.257.705.2]RPA iSLIP DPA m-DPA With Bursty Arrivals Uniformly Distributed Destinations
Figure 9 Throughput efficiency v/s buffer size in 4x4 switch
1 2 3 4 5 6 7 8
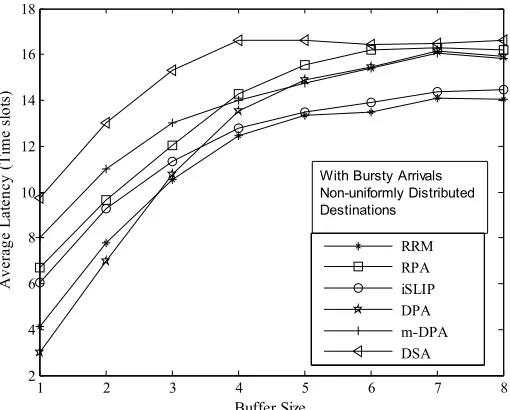
0 2 4 6 8 10 12 14 16 Buffer Size A ver age L at en cy ( T im e s lot s) RRM RPA iSLIP DPA m-DPA DSA With Bursty Arrivals
Non-uniformly Distributed Destinations
Figure 10. Average latency in timeslots in 4x4 switch
10 20 30 40 50 60 70 80 90 100 40 50 60 70 80 90 100 Offered load(%) T hr oughput E ff ic ie nc y( % ) RRM RPA iSLIP DPA m-DPA DSA Bernoulli Arrivals Uniformly Distributed Destinations
[image:4.612.318.570.276.711.2]As shown in figure 9, throughput of DSA as a function of buffer size increases by 1% to 3% compared to DPA and m-DPA for traffic model C. As shown in figure 10, average latency of DSA as a function of buffer size increases with buffer size. As shown in figure 11, throughput of DSA as a function of offered load increases by 1% to 3% compared to DPA and m-DPA for traffic model A for 8x8 switch.
1 2 3 4 5 6 7 8
2 4 6 8 10 12 14 16 18
Buffer Size
A
ver
ag
e L
at
en
cy
(
T
im
e s
lo
ts
)
[image:5.612.319.563.50.245.2]RRM RPA iSLIP DPA m-DPA DSA With Bursty Arrivals Non-uniformly Distributed Destinations
Figure 12. Average latency v/s buffer size in 8x8 switch As shown in figure 12, average latency of DSA as a function of buffer size increases by 5 to 8 timeslots compared to DPA and m-DPA in 8x8 switch.
10 20 30 40 50 60 70 80 90 100 65
70 75 80 85 90 95 100
Offered load(%)
T
hr
oug
hpu
t E
ff
ic
ie
nc
y(
%
)
RRM RPA iSLIP DPA m-DPA DSA
Bernoulli arrivals uniformly distributed destinations
Figure 13. Throughput v/s offered load in 16x16 switch As shown in figure 13, throughput of DSA as a function of offered load increases by 2% to 5% compared to DPA and m-DPA for traffic model A for 16x16 switch.
10 20 30 40 50 60 70 80 90 100
0 10 20 30 40 50 60 70 80 90 100
Offered load(%)
A
ver
ag
e
L
at
en
cy
(
T
im
e s
lo
ts) RRM
RPA iSLIP DPA m-DPA DSA Bernoulli arrivals uniformly distributed Destinations
Figure 14. Average latency in timeslots in 16x16 switch As shown in figure 14, average latency of DSA as a function of offered load increases by 15 to 35 timeslots compared to DPA and m-DPA in 16x16 switch.
V. IMPLEMENTATION
4x4 and 8x8 ATM crossbar switches with DPA, m-DPA and DSA algorithms are implemented using ALTERA’S QUARTUS II tool in EP20k1500EFC33 -2x device.
[image:5.612.52.307.150.355.2]Based on the implementations, Table II and III present the area analyses of DPA, m-DPA and DSA.
Table II: DPA/ m-DPA area analysis for 4x4 ATM switch
DPA m-DPA DSA
Logic cells 6299 6487 6907 Table III: DPA/ m DPA area analysis for 8x8 ATM switch
DPA m-DPA DSA
Logic cells 24091 24498 25558
VI. CONCLUSION
[image:5.612.53.301.436.635.2]VII. REFERENCES
[1] F. A. Tobagi, “Fast cell switch architectures for broadband integrated services digital networks,” Proc. of the IEEE, vol. 78, January 1990, pp. 133-178.
[2] T. E. Anderson, S. S. Owicki, J. B. Saxe, and C. P. Thacker, “High speed switch scheduling for local area networks,”
ACM Transactions on Computer Systems, pp. 319-352, November 1993.
[3] M. J. Karol, M. G. Hluchyj and S. P. Morgan, “Input vs. output queueing on a space-division cell switch”, IEEE Transaction on Communications, Vol. 35, No. 12, pp. 1347-1356, 1987.
[4] J. Hurt, A. May, X. Zhu, and B. Lin, “Design and implementation of high-speed symmetric crossbar schedulers,” Proc. IEEE International Conference on
Communications (ICC’99), Vancouver, Canada, June
1999, pp. 253-258.
[5] A. Mekkittikul and N. McKeown, “A practical scheduling algorithm to achieve 100% throughput in input-queued switches,” Proc. IEEE INFOCOM 1998, vol. 2, Apr. 1998, San Francisco, pp. 792-799.
[6] N. McKeown, V. Anamtharam, and J. Warland, “Achieving 100% throughput in an input-queued switch,”
Proc. INFOCOM’96, San Francisco, March 1996, pp.
296-302.
[7] H. S. Chi and Y. Tamir, “Decomposed arbiters for large crossbars with multi-queue input buffers” Proc. of
International Conference on Computer Design,
Cambridge, Massachusetts, October 1991, pp. 233-238. [8] Y. Tamir and H.C. Chi, “Symmetric crossbar arbiters for
VLSI communication switches,” IEEE Transactions on Parallel and Distributed Systems, vol. 4, no. 1, pp. 13-27, January 1993.
[9] Shah M.V., Sharma D.J, Trivedi A.I., “Modified Algorithm for High Speed Symmetric Crossbar Switch” proceeding of the international Conference on next generation networks cp25.1-cp25.5,February 2006.
[10] Etamar Elhanany “ A comparative view of the GLIMPS Sheduling algorithms” teracross, October 2002.