Abstract— This paper focuses on the effect of air-fuel ratio on the engine performance of single cylinder hydrogen fueled port injection internal combustion engine. GT-Power was utilized to develop the model for port injection engine. One dimensional gas dynamics was represented the flow and heat transfer in the components of the engine model. The governing equations are introduced first, followed by the performance parameters and model description. Air-fuel ratio was varied from stoichiometric limit to a lean limit. The rotational speed of the engine was varied from 2500 to 4500 rpm while the injector location was considered fixed in the midway of the intake port. The acquired results show that the air-fuel ratio is greatly influence on the performance of hydrogen fueled engine. It is shown that the brake mean effective pressure (BMEP) and brake thermal efficiency decreases with increases of the air-fuel ratio however the brake specific air-fuel consumption (BSFC) increases with increases of the air-fuel ratio. The cylinder temperature decreases with the increase of air-fuel ratio. The present model emphasizes the ability of retrofitting the traditional engines with hydrogen fuel with minor modifications.
Index Terms— hydrogen fueled engine, port injection, air fuel ratio, engine performance, single cylinder.
I. INTRODUCTION
The status of the availability of the fossil fuels is critical and the prices have been jumped to levels that never been reached before. Furthermore, the environmental problems are serious and the politics all over the world applied severe conditions for the automotive industry. Researchers, technologists and the automobile manufacturers are increasing their efforts in the implementation of technologies that might be replaced fossil fuels as a means of fueling existing vehicles. Hydrogen, as alternative fuel, has unique properties give it significant advantage over other types of fuel. However, the widespread implementation of hydrogen for vehicular application is still
Manuscript received August 10, 2008. This work was supported by the Universiti Malaysia Pahang.
M. M. Rahman is with the Faculty of Mechanical Engineering, Universiti Malaysia Pahang, Tun Abdul Razak Highway, 26300 Gambang, Kuantan, Pahang, Malaysia (phone: 609-5492207; fax: 609-5492244; e-mail: [email protected]).
Mohammed K. Mohammed is with the Faculty of Mechanical Engineering, Universiti Malaysia Pahang, Tun Abdul Razak Highway, 26300 Gambang, Kuantan, Pahang, Malaysia .
Rosli A. Bakar is with the Faculty of Mechanical Engineering, Universiti Malaysia Pahang, Tun Abdul Razak Highway, 26300 Gambang, Kuantan, Pahang, Malaysia
waiting several obstacles to be solved. These obstacles are standing in the production, transpiration, storage and utilization of hydrogen. The most important one is the utilization problems. Hydrogen induction techniques play a very dominant and sensitive role in determining the performance characteristics of the hydrogen fueled internal combustion engine (H2ICE) [1]. Hydrogen fuel delivery
system can be broken down into three main types including the carbureted injection, port injection and direct injection [2].
The port injection fuel delivery system (PFI) injects hydrogen directly into the intake manifold at each intake port rather than drawing fuel in at a central point. Typically, hydrogen is injected into the manifold after the beginning of the intake stroke [2]. Hydrogen can be introduced in the intake manifold either by continuous or timed injection. The former method produces undesirable combustion problems, less flexible and controllable [3]. But the latter method, timed port fuel injection (PFI) is a strong candidate and extensive studies indicated the ability of its adoption [4]-[6]. The calling sounds for adopting this technique are supported by a considerable set of advantages. It can be easily installed only with simple modification [7] and its cost is low [8]. The flow rate of hydrogen supplied can also be controlled conveniently [9]. External mixture formation by means of port fuel injection also has been demonstrated to result in higher engine efficiencies, extended lean operation, lower cyclic variation and lower NOx production [10]-[12]. This is
the consequence of the higher mixture homogeneity due to longer mixing times for PFI. Furthermore, external mixture formation provides a greater degree of freedom concerning storage methods [13]. The most serious problem with PFI is the high possibility of pre-ignition and backfire, especially with rich mixtures [14]-[15]. However, conditions with PFI are much less severe and the probability for abnormal combustion is reduced because it imparts a better resistance to backfire [2]. Combustion anomalies can be suppressed by accurate control of injection timing and elimination of hot spots on the surface of the combustion as suggested by Lee et al. [7]. Verhelst [16] recommended very late injection. With PFI and stoichiometric mixture operation, engine loads up to indicated mean effective pressure (IMEP) of 9 bar can be achieved with optimized injection and valve timing [17]. Knorr et al. [18] have reported acceptable stoichiometric operation with a bus powered by liquid hydrogen. Their success was achieved by the following measures:
• formation of a stratified charge by timed injection of the hydrogen into the pipes of the intake manifold with a defined pre-storage angle. At the beginning
Effect of Air Fuel Ratio on Engine Performance
of Single Cylinder Port Injection Hydrogen
Fueled Engine: A Numerical Study
of the intake stroke a rich, non-ignitable mixture passes into the combustion chamber,
• injection of hydrogen with a relatively low temperature of 0-10°C so that the combustion chamber is cooled by the hydrogen, and finally
• lowering of the compression ratio to 8:1.
One of the main conclusions drawn from the experimental study of Ganesh et al. [14] was the possibility of overcoming the problem of backfire by reducing the injection duration. Sierens and Verhelst [19] examined four different junctions of the port injection position (fuel line) against the air flow. Based on the results of their CFD model, the junction that gives the highest power output (Y-junction) was different from the junction that gives the highest efficiency (45-deg junction). Finally a compromise was suggested. The present contribution introduces a model for a single cylinder, port injection H2ICE. GT-Power software code is used to build
this model. The main task of this model is to investigate the effect of air fuel ratio on the performance characteristics of this engine. The emphasis is paid for the trends with the air fuel ratio and engine speed.
II. HYDROGEN ENGINE MODEL A. Engine Performance Parameters
The brake mean effective pressure (BMEP) can be defined as the ratio of the brake work per cycle Wb to the cylinder volume displaced per cycle Vd, and it can be expressed as in (1).
d b
V
W
=
BMEP
(1)Equation (1) can be rewrite for the four stroke engine as in (2). d b
NV
P
2
BMEP
=
(2)where Pb is the brake power, and N is the rotational speed. Brake efficiency (ηb) can be defined as the ratio of the
brake power Pb to the engine fuel energy as in (3):
(
LHV)
m P
f b
b =
η (3)
where
m
fis the fuel mass flow rate and LHV is the lower heating value of hydrogen.The brake specific fuel consumption (BSFC) represents the fuel flow rate
m
fper unit brake power output and can be expressed as in (4):b f
P
m
BSFC
=
(4) The volumetric efficiency (ηv) of the engine defines as themass of air supplied through the intake valve during the
intake period (
m
a) by comparison with a reference mass, which is that mass required to perfectly fill the swept volume under the prevailing atmospheric conditions, and can be expressed as in (5):d ai a v
V
m
ρ
η
=
(5)where
ρ
ai is the inlet air density.The in-cylinder heat transfer is calculated by a formula which closely emulates the classical Woschni correlation. Based on this correlation, the heat transfer coefficient (hc) can be expresses as in (6):
8 . 0 55 . 0 8 . 0 2 . 0
26
.
3
B
p
T
w
h
c− −
=
(6)where B is the bore in meters, p is the pressure in kPa, T is temperature in K and w is the average cylinder gas velocity in m/s.
The combustion burn rate (Xb) using Wiebe function, can be expressed as in (7):
⎥
⎥
⎦
⎤
⎢
⎢
⎣
⎡
⎟
⎠
⎞
⎜
⎝
⎛
Δ
−
−
−
=
+1exp
1
n i ba
X
θ
θ
θ
(7)where
θ
is the crank angle,θ
iis the start of combustion,θ
Δ
the combustion period; and a and n are adjustable parameters.B. Engine Model
[image:2.595.305.553.647.779.2]A single cylinder, four stroke, port injection hydrogen fueled engine was modeled utilizing the GT-Power software. The injection of hydrogen was located in the midway of the intake port. The model of the hydrogen fueled single cylinder four stroke port inject engine is shown in Fig. 1. The specific engine parameters are used to make the model which is listed in Table 1. It is important to indicate that the intake and exhaust ports of the engine cylinder are modeled geometrically with pipes. Firstly, an attribute “heat transfer multiplier” is used to account for bends, roughness, and additional surface area and turbulence caused by the valve and stem. Also, the pressure losses in these ports are included in the discharge coefficients calculated for the valves.
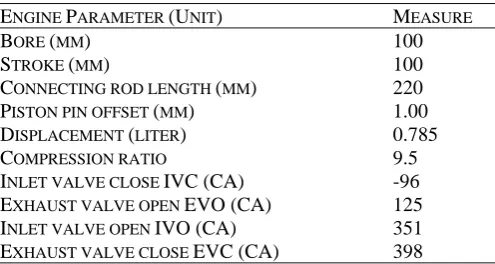
Table 1. Hydrogen fueled engine parameters ENGINE PARAMETER (UNIT) MEASURE
BORE (MM) 100
STROKE (MM) 100
CONNECTING ROD LENGTH (MM) 220
PISTON PIN OFFSET (MM) 1.00
DISPLACEMENT (LITER) 0.785
COMPRESSION RATIO 9.5
Fig. 1 Model of single cylinder, four stroke, port injection hydrogen fueled engine
III. RESULTS AND DISCUSSION
It is worthy to mention that one of the most attractive combustive features for hydrogen fuel is its wide range of flammability. A lean mixture is one in which the amount of fuel is less than stoichiometric mixture. This leads to fairly easy to get an engine start. Furthermore, the combustion reaction will be more complete. Additionally, the final combustion temperature is lower reducing the amount of pollutants.
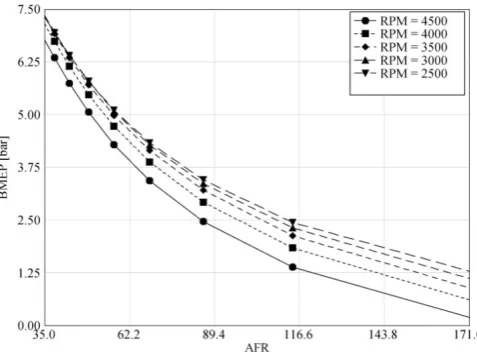
Fig. 2 shows the effect of air-fuel ration on the brake mean effective pressure. The air-fuel ratio AFR was varied from stoichiometric limit (AFR = 34.33:1 based on mass where the equivalence ratio, ϕ = 1) to a very lean limit (AFR =171.65 based on ϕ = 0.2) and engine speed varied from 2500 rpm to 4500 rpm. BMEP is a good parameter for comparing engines with regard to design due to its independent on the engine size and speed. If torque used for engine comparison, a large engine was always seem to be better when considering the torque, however, speeds become very important when considered the power [20]. It can be seen that the decreases of the BMEP with increases of AFR and speed. It is obvious that the BMEP falls with a non-linear behavior from the richest condition where AFR is 34.33 to the leanest condition where the AFR is 171.65. The differences of BMEP are increases with the increases of speed and AFR. The differences of the BMEP are decreases 6.682 bar at speed of 4500 rpm while 6.12 bar at speed 2500 rpm for the same range of AFR. This implied that at lean operating conditions, the engine gives the maximum power (BMEP = 1.275 bar) at lower speed 2500 rpm) compared with the power (BMEP = 0.18 bar) at speed 4500 rpm. Due to dissociation at high temperatures following combustion, molecular oxygen is present in the burned gases under stoichiometric conditions. Thus some additional fuel can be added and partially burned. This increases the temperature and the number of moles of the burned gases in the cylinder. These effects increases the pressure were given increase power and mean effective pressure [21].
Fig. 3 shows the variation of the brake thermal efficiency with the air fuel ratio for the selected speeds. It is seen that the brake power (useful part) as a percentage from the intake fuel
energy. The fuel energy are also covered the friction losses and heat losses (heat loss to surroundings, exhaust enthalpy and coolant load). Therefore lower values of ηb can be seen
in the Fig.3. It can be observed that the brake thermal efficiency is increases nearby the richest condition (AFR ≅ 35) and then decreases with increases of AFR and speed. The operation within a range of AFR from 49.0428 to 42.91250 (ϕ = 0.7 to 0.8) give the maximum values for for all speeds. Maximum ηb of 31.8% at speed 2500 rpm can be
seen compared with 26.8% at speed 4500 rpm. Unaccepted efficiency ηb of 2.88% can be seen at very lean conditions
with AFR of 171.65 (ϕ = 0.2 for speed of 4500 rpm while the efficiency was observed 20.7% at the same conditions with speed of 2500 rpm. Clearly, rotational speed has a major effect in the behavior of ηbwith AFR. Higher speeds lead to
higher friction losses.
Fig. 2 Variation of brake mean effective pressure with air fuel ratio for various engine speeds
[image:3.595.308.547.489.665.2]Fig. 3 Variation of brake thermal efficiency with air fuel ratio Fig. 4 depicts the behavior of the brake specific fuel consumption BSFC with AFR. The AFR for optimum fuel consumption at a given load depends on the details of chamber design (including compression ratio) and mixture preparation quality. It varies for a given chamber with the part of throttle load and speed range [21]. It is clearly seen from Fig. 4 that the higher fuel is consumed at higher speeds and AFR due to the greater friction losses that can occur at high speeds. It is easy to perceive from the figure that the increases of BSFC with decreases in the rotational speed and increases the value of AFR. However, the required minimum BSFC were occurred within a range of AFR from 38.144 (ϕ = 0.9) to 49.0428 (ϕ = 0.7) for the selected range of speed. At very lean conditions, higher fuel consumption can be noticed. After AFR of 114.433 (ϕ =0.3) the BSFC goes up rapidly, especially for high speed. At very lean conditions with AFR of 171.65 (ϕ = 0.2), a BSFC of 144.563 g/kW-h was observed for the speed of 2500 rpm while 1038.85g/kW-h for speed of 4500 rpm. The value BSFC at speed 2500 rpm was observed around 2 times at speed 4000 rpm however around 7 times at speed 4500 rpm. This is because of very lean operation conditions can lead to unstable combustion and more lost power due to a reduction in the volumetric heating value of the air/hydrogen mixture. This behavior can be more clarified by referring to Fig. 3, where the brake efficiency reduced considerably at very lean operation conditions.
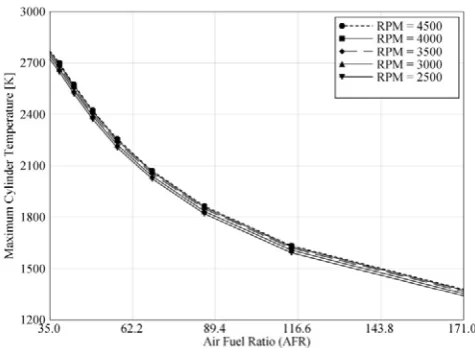
Fig. 5 shows how the AFR can affect the maximum temperature inside the cylinder. In general, lower temperatures are required due to the reduction of pollutants. It is clearly demonstrated how the increase in the AFR can decrease the maximum cylinder temperature with a severe steeped curve. The effect of the engine speed on the relationship between maximum cylinder temperatures with AFR seems to be minor. At stoichiometric operating conditions (AFR= 34.33), a maximum cylinder temperature of 2752.83 K was recorded. This temperature dropped down to 1350 K at AFR of 171.65 (ϕ = 0.2). This lower temperature inhibits the formation of NOx pollutants. In fact this feature is
[image:4.595.51.289.54.232.2]one of the major motivations toward hydrogen fuel.
Fig. 4 Variation of brake specific fuel consumption with air fuel ratio for different engine speed
Fig. 5 Variation of maximum cylinder temperature with air fuel ratio
IV. CONCLUSIONS
The present study considered the performance characteristics of single cylinder hydrogen fueled internal combustion engine with hydrogen being injected in the intake port. The emphasis was paid to the effects of engine speed, AFR. The instantaneous behavior was also studied. The following conclusions are drawn:
(i) At very lean conditions with low engine speeds, acceptable BMEP can be reached, while it is unacceptable for higher speeds. Lean operation leads to small values of BMEP compared with rich conditions.
(ii) Maximum brake thermal efficiency can be reached at mixture composition in the range of (ϕ = 0.7 to 0.8) and it decreases dramatically at leaner conditions. (iii) The desired minimum BSFC occurs within a mixture
composition range of (ϕ = 0.7 to 0.9). The operation with very lean condition (ϕ < 0.2) and high engine speeds (> 4500) consumes unacceptable amounts of fuel.
[image:4.595.307.545.276.450.2]In general, the behavior of the most studied parameters is similar to that of gasoline engine. This gives a great chance to retrofit gasoline engines with hydrogen fuel with minor modifications. Further future experimental work will be done to emphasize this simulation and get more details.
ACKNOWLEDGMENT
The authors would like to express their deep gratitude to Universiti Malaysia Pahang (UMP) for provided the laboratory facilities and financial support.
REFERENCES
[1] N. Suwanchotchoung, “Performance of a spark ignition dual-fueled engine using split-injection timing,” Ph.D. Thesis, Vanderbilt University, Mechanical Engineering. 2003. Available: http://202.28.18.234/multim/3085799.pdf
[2] COD (College of the Desert), “Hydrogen fuel cell engines and related technologies, module 3: Hydrogen use in internal combustion engines,” Rev. 0, 2001, pp. 1-29.
[3] L. M. Das, “Fuel induction techniques for a hydrogen operated engine,” Int. J. Hydro. Ener., vol. 15, no. 11, 1990, pp. 833-842. [4] L. R. Das, R. Gulati and P. Gupta, “A comparative evaluation of the
performance characteristics of a spark ignition engine using hydrogen and compressed natural gas as alternative fuels,” Int. J. Hydro. Ener., vol 25, no. 8, 2000, pp. 783-793.
[5] L. M. Das, “Hydrogen engine: research and development (R&D) programmes in Indian Institute of Technology (IIT), Delhi,” Int. J. Hydro. Ener., vol. 27, no. 9, 2002, pp. 953-965.
[6] X. Tang, D. M. Kabat, R. J. Natkin, W. F. Stockhausen and J. Heffel, “Ford P2000 hydrogen engine dynamometer development.,” SAE Paper No. 2002-01-0242.
[7] S. J. Lee, H. S. Yi and E. S. Kim, “Combustion characteristics of intake port injection type hydrogen fueled engine,” Int. J. Hydro. Ener., vol. 20, no. 4, 1995, pp. 317-322.
[8] H. Li, and G. A. Karim, “Hydrogen fueled spark-ignition engines predictive and experimental performance,” J. Eng. Gas Turbines Power, ASME, vol. 128, no. 1, 2006, pp. 230-236. [9] R. Sierens, and S. Verhelst, “Experimental study of a hydrogen-fueled
engine,” J. Eng. Gas Turbines Power, ASME, vol. 123, no. 1, 2001, pp. 211-216.
[10] H. Rottengruber, M. Berckmüller, G. Elsässer, N. Brehm and C. Schwarz, “Direct-injection hydrogen SI-engine operation strategy and power density potentials,” SAE Paper No. 2004-01-2927. [11] H. S. Yi, K. Min and E.S. Kim, “The optimised mixture formation for
hydrogen fuelled,” Int. J. Hydro. Ener., vol. 25, no. 7, 2000, pp. 685-690.
[12] Y. Y. Kim, J. T. Lee and J. A. Caton, “The development of a dual-Injection hydrogen-fueled engine with high power and high efficiency,” J. Eng. Gas Turbines Power, ASME, vol. 128, no. 1, 2006, pp. 203-212.
[13] S. Verhelst, R. Sierens and S. Verstraeten, “A critical review of experimental research on hydrogen fueled SI engines,” SAE Paper No. 2006-01-0430.
[14] R. H. Ganesh, V. Subramanian, V. Balasubramanian, J. M. Mallikarjuna, A. Ramesh and R. P. Sharma, “Hydrogen fueled spark ignition engine with electronically controlled manifold injection: An experimental study,” Ren. Ener.,vol. 33, no. 8, 2008, pp. 1324-1333. [15] D. M. Kabat and J. W. Heffel, “Durability implications of neat
hydrogen under sonic flow conditions on pulse-width modulated injectors,” Int. J. Hydro. Ener., vol. 27, no. 10, 2002, pp. 1093-1102. [16] R. Sierens, S. Verhelst and S. Verstraeten, “An overview of hydrogen
fueled internal combustion engines,” Proc. Int. Hydro. Ener. Cong. and Exhib., IHEC 2005, Istanbul, Turkey, 13-15 July, 2005. [17] F. Meier, J. Karhler, W. Stolz, W. H. Bloss and M. Al-Garni,
“Cycle-resolved hydrogen flame speed measurement with high-speed Schlieren technique in a hydrogen direct injection SI engine,” SAE Paper No. 942036.
[18] H. Knorr, W. Held, W. Prümm and H. Rüdiger, “The man hydrogen propulsion system for city buses,” Int. J. Hydro. Ener., vol. 23, no. 3, 1997, pp. 201–208.
[19] R. Sierens, and S.Verhelst, “Influence of the injection parameters on the efficiency and power output of a hydrogen fueled engine,” J. Eng. Gas Turbines Power, ASME, vol. 125, no. 2, 2003, pp. 444–449.
[20] W. W. Pulkrabek, “Engineering fundamentals of the internal combustion engines,” 2nd ed., New York: Prentice Hall, 2003. [21] J. B. Heywood, “Internal combustion engine fundamentals,” 1st ed.,