Munich Personal RePEc Archive
Wage and Price Setting in Macedonia:
Evidence from Survey Data
Ramadani, Gani and Naumovski, Nikola
National Bank of the Republic of Macedonia
September 2014
Online at
https://mpra.ub.uni-muenchen.de/70171/
National Bank of the Republic of Macedonia
Research Paper
2015
Wage and Price Setting in Macedonia: Evidence from
Survey Data
Gani Ramadani
Nikola Naumovski1
Abstract: This paper presents the main findings of a survey on wage and price formation of firms in Macedonia conducted in the first half of 2014. The main objective was to identify some relevant characteristics about the dynamics of wages and prices in Macedonia, clarifying the relationship between them, and to draw some conclusions on
firms’ response to various adverse shocks in adjusting labour costs, prices and their various components. The most important conclusions are that: i) wages tend to remain unchanged longer than prices; ii) the most significant factor producing frequent wage adjustment is tenure rather than inflation; iii) time concentration of wage and price changes is significantly lower in Macedonia than in the surveyed EU countries as a result of the considerably low automatic indexation of wages and large share of firms that operate in highly price competitive pressures; iv) downward nominal wage rigidity could be considered relatively high associated with the extent of permanent contracts, and is more important compared to the low downward real wage rigidity; v) there is a weak price-wage link which corresponds with inflation being the least important factor driving wage changes; and vi) in case of adverse shocks firms tend to adjust costs and prices rather than margins and output.
Key words: survey data, wage and price setting, wage rigidity, indexation, Macedonia
JEL classification:D21, E30, J31
1 National Bank of the Republic of Macedonia, Monetary Policy and Research Department, [email protected]; National Bank
2 Table of Contents
1. Introduction ... 3
2. Literature overview ... 5
3. Survey design... 7
3.1. Survey questionnaire ... 7
3.2. Sample and the implementation of the survey ... 8
3.3. Main features of the surveyed firms ... 10
4. Features of wage setting and price duration ... 13
4.1. Frequency of wage and price changes ... 14
4.2. Time dependence and synchronisation of wage changes ... 17
4.3. Indexation and adjustment of wages to inflation ... 19
4.4. Wages of newly hired workers ... 20
4.5. Downward wage rigidities ... 23
4.6. Alternative means to adjust labour cost... 26
5. Responses to shocks ... 28
6. Price and wage dynamics ... 31
6.1. Synchronisation of wage and price changes ... 31
6.2. How wages feed into prices ... 33
7. Different channels through which the crisis affected firms’ activity ... 34
8. Concluding remarks ... 35
3
1.
Introduction
The appropriate design of economic policies in general and monetary policy in
particular, requires deep understanding of the sources and features of wage and labour cost
dynamics. For a small open economy like Macedonia with a fixed exchange rate regime and
imperfect capital mobility, wage flexibility becomes an important requirement for providing
an adequate adjustment to shocks. According to Yamaguchi (2005), one of the key
determinants of the allocative efficiency of the labour market is wage flexibility, which is an
important driver of overall labour market outcome, and if wages are flexible, the absorption
of shocks or the adjustment to structural changes become easier, ensuring more accurate
signals for labour reallocation.
In this paper, we summarize the results of a representative survey on wage and
price setting mechanisms in Macedonian enterprises from the manufacturing, construction,
trade and market services sectors. Analyses of survey results based on micro-level data are
focused only at a descriptive level. We link and cross tabulate some answers of firms about
wage and price setting with their sector, size, market competition, collective agreement,
labour cost share, in order to explain some of the behaviour of firms related with their wage
and price decisions.
The survey on wage and price setting behaviour at a firm level in Macedonia was
conducted by the National Bank of the Republic of Macedonia for the first time in the first
half of 2014, while in selected EU countries, the survey was carried out between the end of
2007 and the first half of 2008. The EU survey is part of the activities of the Wage Dynamics
Network (WDN) that has two specific objectives. The first one is identifying the sources and
features of wage and labour cost dynamics that are most relevant for monetary policy, while
the second objective aims at clarifying the relationship between wages, labour costs and
prices at both the firm and macro-economic level. The network consists of 23 central banks
from the EU and is coordinated by the European Central Bank. The network developed the
WDN Survey on wage and pricing policies at the firm level, which was carried out by 17
national central banks.
The findings for the EU, mentioned in the literature review section below, refer to
4 moderate levels of inflation), while evidence for firms in Macedonia reflects firms’ behaviour
in a period of sluggish economic recovery from the global economic and financial crisis.
Besides these differences in the observation periods, still, most of the findings for the
surveyed EU countries can apply to Macedonia as well. Based on the information from the
survey, this paper presents a number of stylised facts on wage and price dynamics in
Macedonia, some of which are summarised below.
The results from the survey show that 29.4% of the firms in Macedonia are
characterised by a low degree of wage indexation. At the same time, slightly more than half
of the employees are covered by collective wage agreements, signed at a sector or firm
level. The surveyed companies have a high labour cost share (41.2%), related to a high
proportion of low skilled (blue-collar) workers. Wages of employees tend to remain
unchanged on average for almost 16 months, which is somewhat longer, compared with the
average wage duration in the surveyed EU countries (15 months). When wages change,
tenure stands out as the most important factor producing wage adjustment. The frequency
of wage changes driven by inflation is the lowest.
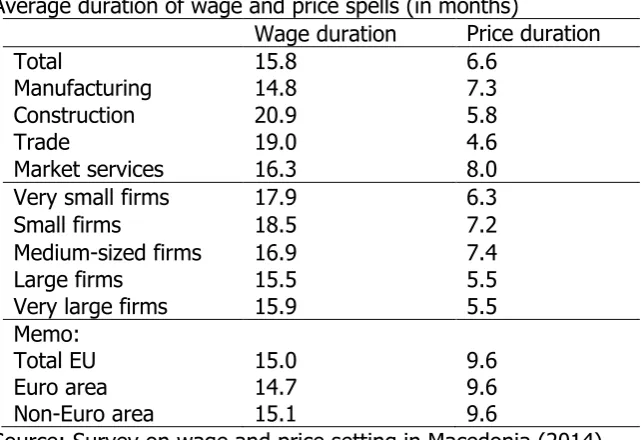
Analysing inflation and the price dynamics, prices tend to remain unchanged for 7
months due to high share of firms that experience severe or strong price competition. This
implies that changes in wages occur less frequently than changes in prices, thus the average
duration of wages is considerable 9 months longer than the average duration of prices.
Looking at the deeper relationship between the price and wage dynamics, (1) in
Macedonia, the downward nominal wage rigidity is more important compared to downward
real wage rigidity. This is true also for the surveyed non-euro area countries. Compared to
the figures of surveyed EU firms, downward nominal wage rigidity is higher, while downward
real wage rigidity is more modest in Macedonia. (2) The time dimension shows weak
synchronisation between the timing of price and wage changes, with only 22% of firms
recognising that a relationship does exist (40% in surveyed EU countries). The weak
price-wage link in Macedonia corresponds with the results that inflation is the lowest important
factor driving wage changes, which is striking difference from the EU, where inflation is the
main driving factor of frequent changes in wages (though in both cases there is low-inflation
environment). Although, the pass-through from wages to prices observed after an
5 The remaining part of the paper is structured in the following way. The literature
review in Section 2 gives an overview of the consulted research papers that have dealt with
the results from the WDN survey. Section 3 describes the survey design, providing
information on the questionnaire, the sample of the survey and the way the survey was
conducted, as well as a review of some of the firms’ characteristics. Section 4 provides an
overview of the survey results on the different aspects of wage and price rigidity, including
frequency of wage and price changes, possible determinants of wage changes and their
indexation, time concentration of wage changes, wages of new hires, downward wage
rigidities and alternative measures of labour cost adjustment. Section 5 looks at the reaction
of firms to different types of shocks with respect to unanticipated slowdown in demand,
increase in intermediate input prices (e.g. oil price increase) and permanent increase in
wages. Section 6 deals with the extent of price-wage link and pass-through of wage shock
to prices. The different channels through which the crisis affected firms’ activity are
presented in Section 7. The closing section provides concluding remarks of the paper.
2.
Literature overview
When writing this paper and analysing the survey results from the Macedonian firms,
we have consulted research papers that have analysed WDN survey results from EU
countries, as well as the Final Report of the Wage Dynamics Network which summarises the
results of the network.
Druant et al. (2009) find that EU firms adjust wages less frequently than prices,
where wages tend to remain unchanged for about 15 months on average, while prices are
unchanged for around 10 months. Differences are more evident among the different sectors,
where the authors find that prices set by business services firms are unchanged for 11
months, while prices of the trade sector and financial services are more flexible (unchanged
for 7 and 8 months, respectively). Similarly, they find that in the construction sector wage
duration is 13 months, while in the trade sector it is 15 months. With a multivariate analysis
of the determinants of price rigidity, the authors find that at the firm level more frequent
price adjustments are associated with higher intensity of competitive pressures and
exposure to foreign markets, as well as with a lower share of labour costs on total costs. On
the other side, besides on inflationary outlook, wage adjustments are dependent on each
6 Babecky et al. (2009a) in their paper present the frequency of downward wage
rigidity in both real and nominal terms in EU countries. The authors define downward
nominal wage rigidity on the basis of the frequency of nominal wage freezes, thus, frozen
wages are considered to be subject of nominal wage rigidity. Similarly, they define
downward real wage rigidity on the basis of wage indexation, achieved with an automatic
link to either past or expected inflation. Similar to Druant et al (2009), they find that country
effects and institutional differences are significant determinants to downward wage
rigidities. In addition, their results indicate that downward wage rigidity is related to
workforce composition at the establishment level in a manner that is consistent with related
theoretical models. Both types of rigidity are positively correlated with the share of
high-skilled white-collars2, meaning that firms employing a larger proportion of high-skilled
white-collar workers are more likely to be subject to downward wage rigidities, both in real and
nominal terms. Furthermore, their results reveal that wage rigidity also depends on the
labour market institutional environment, while collective bargaining coverage is positively
related with downward real wage rigidity, measured on the basis of wage indexation.
In another paper by Babecky et al. (2009b), they further investigate the wage rigidity
in EU companies in terms of base wages, by examining six strategies firms use to cut labour
costs. Namely, wage rigidity does not strictly imply rigid labour costs, as firms have other
margins of adjustment of their labour costs, such as flexible pay components (bonuses or
fringe benefits), re-organisation of production (change shifts), slow promotions of
employees, or labour turnover (cheaper hires or early retirement) as a tool to adjust labour
costs in economic activity. Therefore, they find that firms subject to some form of wage
rigidity use alternative strategies of adjusting labour costs, and at the same time firms
subject to nominal wage rigidities are much more likely to use each of the six cost-cutting
strategies. Therefore, their results indicate a certain degree of substitutability between wage
flexibility and other labour cost flexibility.
Similarly, Bertola et al. (2010) consider other aspects of reaction and adjustment of
prices, wages and employment to the economic environment. Moreover, focusing on the
pass-through of cost shocks to prices, they find that firms facing strong competition are less
likely to increase prices and more likely to reduce costs after a wage shock, and the
2 Classification of employees is made according to the International Standard Classification of Occupations (ISCO-08), where
7 presence of collective wage agreements (at industry or national level) makes the price
increase more likely. Also, their results show that price increases are more likely in countries
with a high degree of employment protection legislation.
3.
Survey design
3.1.
Survey questionnaire
The survey on wage and price formation in Macedonian enterprises uses the harmonised survey applied within the WDN project of the Eurosystem. The first section of the survey focuses on information on wage setting practices, on the frequency and timing of wage changes, as well as on wage setting practices of new workers relative to existing workers. The second section addresses the issues of downward wage adjustments and the adjustment (with respect to wages, prices, total costs, employment and margins) to different shocks. The third section of the survey is aimed at the price-setting behaviour of firms and on the frequency of price changes. The fourth section addresses the consequences of the economic and financial crises. The final, fifth, section of the survey acquires firm-specific data in regards to the period of operation of the company, the number of employees, age structure, their ages and skills, employee turnover, and the share of labour costs in total costs.
The survey design has implemented the survey questions from the first WDN survey for the EU (2007-2008 survey) together with the questions from the limited follow-up WDN survey of 2009. Additionally, the survey on wage and price formation in Macedonian enterprises includes a section regarding the consequences of the economic and financial crises, the business activity of firms during this period, as well as the benefits of the
government’s anti-crisis measures. The survey questionnaire was answered by senior
management of the firms. The questions in the survey deal with firms’ "normal conditions
8
3.2.
Sample and implementation of the survey
The survey was conducted in the period February-May 2014, in the form of face-to-face interviews. The implementation of the survey was based on a representative sample of 514 enterprises (employing 32,932 employees) of four economic sectors: manufacturing, construction, trade and market services3. The survey covered firms employing from 1 to more than 250 employees. The following sectors of the statistical classification of economic activities (NACE REV.2) were targeted:
Manufacturing (activities 10-33);
Construction (activities 41-43);
Trade (activities 45-47);
Market services (activities 49-63 and 68-82).
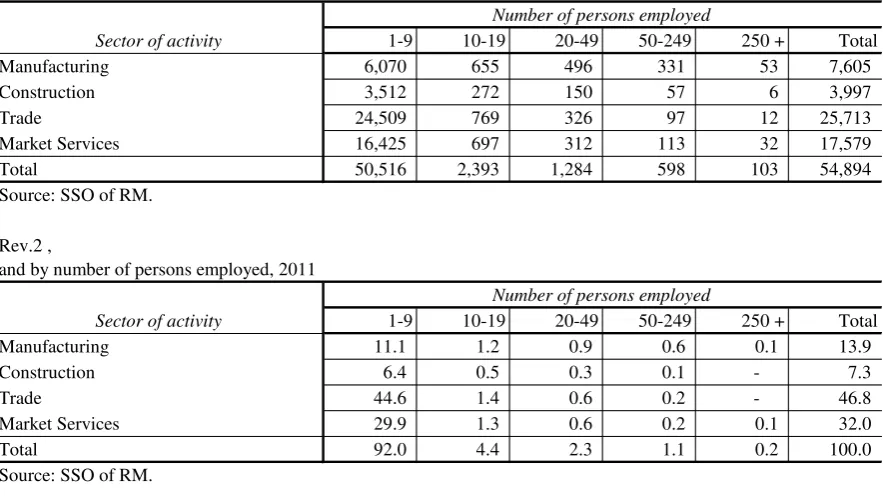
[image:9.595.75.517.458.707.2]The parameters of the total population of firms in the four sectors were based on official data from the State Statistical Office of the Republic of Macedonia (SSORM) as of end-2011. The composition of the total population of firms (by sector and firm size) is presented below (Table 3.1).
Table 3.1
Sector of activity 1-9 10-19 20-49 50-249 250 + Total Manufacturing 6,070 655 496 331 53 7,605 Construction 3,512 272 150 57 6 3,997 Trade 24,509 769 326 97 12 25,713 Market Services 16,425 697 312 113 32 17,579 Total 50,516 2,393 1,284 598 103 54,894 Source: SSO of RM.
Sector of activity 1-9 10-19 20-49 50-249 250 + Total Manufacturing 11.1 1.2 0.9 0.6 0.1 13.9 Construction 6.4 0.5 0.3 0.1 - 7.3 Trade 44.6 1.4 0.6 0.2 - 46.8 Market Services 29.9 1.3 0.6 0.2 0.1 32.0 Total 92.0 4.4 2.3 1.1 0.2 100.0 Source: SSO of RM.
Total Population of selected sectors: Number of active business entities by sectors of activity according to NACE Rev.2 and by number of persons employed, 2011
Number of persons employed
Number of persons employed
Total Population of selected sectors: Percent of active business entities by sectors of activity according to NACE Rev.2 ,
and by number of persons employed, 2011
3 Companies that provide Market services under NACE Rev.2 are classified as companies performing the following activities:
9 The sample of 514 firms (targeted sample was 500) according to their activity is
employment weighted by the number of employees that are employed in the population of
54,894 firms. For example, in the original category (from the SSO) of 1 to 9 persons
employed, there are 109,166 employees (Table 3.2), or 35.7% of the surveyed population,
which means the targeted sample of 500 firms would need to consist of 35.7% of firms
which employ from 1 to 9 persons. Similarly, firms employing over 250 persons include
61,293 (or roughly 20%) of the 305,992 employees in the four sectors. Meaning, the
targeted sample of 500 firms would need to survey 100 firms that employ over 250
employees (or almost the whole population of 103 active business entities as of end of
2011). Therefore, in constructing the survey (assuming a 30% response rate), this category
was reduced to a targeted sample of at least 30 large firms and the remainder of 70 firms
would be distributed among the rest of the 4 size categories (according to their proportional
weights in the targeted sample).
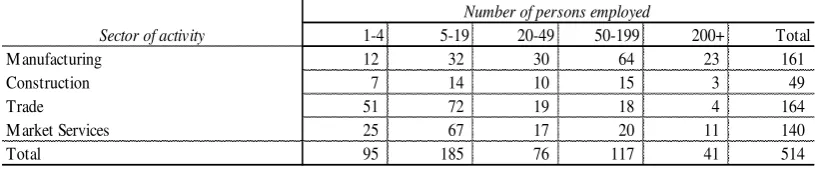
After the survey was carried out, the final sample in the survey includes 161
manufacturing firms, 49 construction firms, 164 firms from the trade sector, and 140 firms
from the business services sector. Since the grouping categories from the SSO on the size of
the firm (according to number of employees) was not comparable with the grouping
categories from the WDN surveys, the grouping according to size of the firm was
accordingly adjusted after the survey was carried out (Table 3.3). Therefore, the size of the
firm, according to number of persons employed, is divided in the following 5 categories:
from 1-4 employees, 5-19 employees, 20-49 employees, 50-199 employees, and 200+
employees. In terms of firm size, small companies (with less than 20 employees) dominate
the sample, accounting for 54 percent of all firms, while only 8 percent of surveyed firms
employ more than 200 employees. The total number of employees covered in the sample is
32,932, with 48.7% of them in manufacturing, 24.6% in market services, 14% in trade, and
12.8% in construction. In the analysis presented in the paper, the results are
employment-weighted (employment in the firm relative to the total number of employees in the sample)
so as to ensure that a higher weight is given to the larger firms, as their decisions on wage
and price-setting are more important for the economy4
. Non-responses are excluded.
4 Employment-weighted results are also reported for the countries that participated in the WDN survey which allows
10 Table 3.2
S ecto r o f activity 1-9 10 -19 2 0 -4 9 50 -2 4 9 2 50 + To tal M anufacturing 13 ,6 71 8 ,50 9 15,157 3 8 ,3 6 0 2 6 ,6 0 5 10 2 ,3 0 2 Co ns tructio n 7,53 8 3 ,54 4 4 ,79 2 6 ,0 8 5 5,6 6 4 2 7,6 2 3 Trad e 50 ,9 4 0 10 ,3 9 3 9 ,9 4 7 9 ,114 7,9 10 8 8 ,3 0 3 M arket Services 3 7,0 17 9 ,6 52 8 ,9 3 4 11,0 4 7 2 1,114 8 7,76 4 To tal 10 9 ,16 6 3 2 ,0 9 8 3 8 ,8 3 0 6 4 ,6 0 6 6 1,2 9 3 3 0 5,9 9 2 So urce: SSO o f RM .
Numb er o f Emp lo yees b y s ecto rs o f activity acco rd ing to NACE Rev.2 , and b y numb er o f p ers o ns emp lo yed , 2 0 11
Numb er o f p ers o ns emp lo yed
Table 3.3
Sector of activity 1-4 5-19 20-49 50-199 200+ Total
M anufacturing 12 32 30 64 23 161
Construction 7 14 10 15 3 49
Trade 51 72 19 18 4 164
M arket Services 25 67 17 20 11 140
Total 95 185 76 117 41 514
Sector of activity 1-4 5-19 20-49 50-199 200+ Total M anufacturing 2.3 6.2 5.8 12.5 4.5 31.3 Construction 1.4 2.7 1.9 2.9 0.6 9.5 Trade 9.9 14.0 3.7 3.5 0.8 31.9 M arket Services 4.9 13.0 3.3 3.9 2.1 27.2 Total 18.5 36.0 14.8 22.8 8.0 100.0 Source: Survey on wage and price setting in M acedonia (2014).
Sample size: Number of business entities by sectors of activity according to NACE Rev.2 , and by number of persons employed
Number of persons employed
Sample size: Percent of business entities by sectors of activity according to NACE Rev.2 , and by number of persons employed
Number of persons employed
3.3.
Main features of the surveyed firms
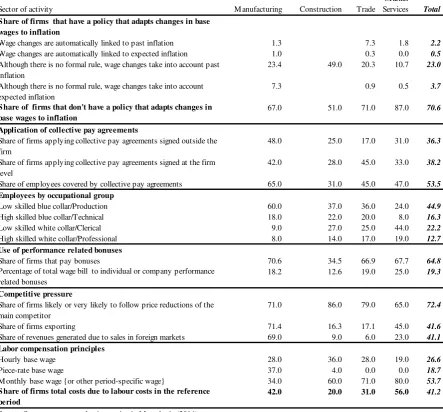
The survey results provide answers to the sets of questions regarding the firms'
characteristics and institutional settings (Table 3.4), such as labour compensation practices
and market competition, in which they operate. In terms of labour composition, most of the
employees fall into the category of low-skilled (blue-collar) employees (45%). Manufacturing
is an economic sector with largest share of blue-collar employees (60% of the employees
are low-skilled blue-collar workers). On the other hand, the number of high-skilled
white-collar employees is only 12.7% in the whole sample, with market services being the
[image:11.595.68.480.405.487.2]11 The survey questionnaire analyses specifically the practice of adjusting wages to
prices. Тhe survey results reveal that 29.4% of the Macedonian firms surveyed have a
policy for adjusting wages to inflation, while the respective share from the survey of WDN
EU countries is 35%. Inflation indexation is more widespread in the construction sector
(49%), with manufacturing sector and trade sector (33% and 29%, respectively)
dominating the services sector (13%).
The compensation of workers is then further examined from different aspects in the
survey, in terms of the compensation practices they apply, the flexible wage share and the
coverage of collective wage agreements of their employees. Regarding the first aspect, the
most common practice in all sectors is the practice of paying monthly base wages. Slightly
over a quarter of the firms use hourly based remuneration, while one fifth of the firms use
piece-rate remuneration as the main form of employee compensation. In the manufacturing
sector, the distribution of remuneration practices is more evenly spread out among the
firms, while in the other three sectors there is a significant difference in favour of
monthly-based wages.
Regarding the flexible wage share, firms provided information on the share of
performance-related benefits as a percent of the total wage bill. Results of the survey show
that the benefits are rather important as a form of compensation. Almost two thirds of the
firms use flexible wage components (performance-related bonuses) which account for
19.3% of the total wage bill of the surveyed firms. The highest share of wages paid through
performance-related bonuses is observed in the manufacturing sector (70.6% of firms),
followed by the market services and trade sector (around 67%), while the construction
sector has the least share (34.5% of the firms).
The third aspect of the labour compensation is the coverage of collective wage
agreements, which influences firms' wage-setting behaviour. In the surveyed firms, more
than half of the employees (53.5%) are covered by a collective wage agreement (either at
the firm level, or outside the firm level), which represents moderate coverage. However,
the effective negotiation power of Macedonian trade unions is weak and corresponds with
the World Bank difficulty of redundancy index, which confirms the relatively loose
employment protection in Macedonia (WB, 2011). Among the different sectors, the
construction sector has the lowest coverage rate, i.e. 31% of the employees are covered by
12 the manufacturing sector. With respect to the firms, 38.2% percent of all firms surveyed
apply collective pay agreements signed at the firm level, while collective pay agreements
signed outside the firm is slightly less present (36.3 %). Analysed individually at the firm
level or outside the firm level, the coverage by a collective wage agreement is relatively low.
Therefore with the wage bargaining process being decentralised and thus predominantly
organised at the firm level, this explains the low level of wage indexation to inflation (at
around 30%), which is in line with the findings of the WDN survey, where in 17 countries,
the wage indexation was implemented by one-third of the firms (WDN Final Report, 2009).
Having in mind the price dynamics in an international setting, the survey
questionnaire also covers the competitive pressures faced by the Macedonian firms. The
survey reveals that exporting manufacturing firms generate the highest share of their
revenue (69%) from exports5, followed by exporting firms in the services sector (23%),
while revenues from exports of the construction and trade firms are in the single digit
territory. As a response to competitive pressures (both domestic and foreign), 72.4% of
firms are very likely, or likely, to reduce prices when their main competitor does so. This
strategy is implemented the most by the construction sector (86%), followed by the trade
sector (79%), manufacturing sector (71%), and it is least used in the services sector (65%).
5 The share of exports in total sales among the exporting firms could be used as an indicator of the degree of competitive
13 Table 3.4
Selected indicators of the surveyed firms (in percent)
Sector of activity M anufacturing Construction Trade
M arket Services Total
S hare of firms that have a policy that adapts changes in base wages to inflation
Wage changes are automatically linked to past inflation 1.3 7.3 1.8 2.2
Wage changes are automatically linked to expected inflation 1.0 0.3 0.0 0.5
Although there is no formal rule, wage changes take into account past inflation
23.4 49.0 20.3 10.7 23.0
Although there is no formal rule, wage changes take into account expected inflation
7.3 0.9 0.5 3.7
S hare of firms that don't have a policy that adapts changes in base wages to inflation
67.0 51.0 71.0 87.0 70.6
Application of collective pay agreements
Share of firms applying collective pay agreements signed outside the firm
48.0 25.0 17.0 31.0 36.3
Share of firms applying collective pay agreements signed at the firm level
42.0 28.0 45.0 33.0 38.2
Share of employees covered by collective pay agreements 65.0 31.0 45.0 47.0 53.5
Employees by occupational group
Low skilled blue collar/Production 60.0 37.0 36.0 24.0 44.9
High skilled blue collar/Technical 18.0 22.0 20.0 8.0 16.3
Low skilled white collar/Clerical 9.0 27.0 25.0 44.0 22.2
High skilled white collar/Professional 8.0 14.0 17.0 19.0 12.7
Use of performance related bonuses
Share of firms that pay bonuses 70.6 34.5 66.9 67.7 64.8
Percentage of total wage bill to individual or company performance related bonuses
18.2 12.6 19.0 25.0 19.3
Competitive pressure
Share of firms likely or very likely to follow price reductions of the main competitor
71.0 86.0 79.0 65.0 72.4
Share of firms exporting 71.4 16.3 17.1 45.0 41.6
Share of revenues generated due to sales in foreign markets 69.0 9.0 6.0 23.0 41.1
Labor compensation principles
Hourly base wage 28.0 36.0 28.0 19.0 26.6
Piece-rate base wage 37.0 4.0 0.0 0.0 18.7
M onthly base wage {or other period-specific wage} 34.0 60.0 71.0 80.0 53.7
S hare of firms total costs due to labour costs in the reference period
42.0 20.0 31.0 56.0 41.2
Source: Survey on wage and price setting in M acedonia (2014).
4.
Features of wage setting and price duration
This section reviews the survey results on the features of wage setting and price
duration, including: (4.1) frequency of wage and price changes, (4.2) time dependence and
synchronisation of wage changes, (4.3) prevalence and features of indexation and
adjustments of wages to inflation, (4.4) wage setting of new hires, (4.5) downward wage
14
4.1.
Frequency of wage and price changes
The frequency of wage changes provides an indication of the degree of wage
stickiness, which is an important parameter for macroeconomic analyses. The survey
delivers information on the frequency of both wage and price changes at the firm level. The
frequency of wage change is analysed through three different aspects: the wage changes
stemming from moves in inflation, changes deriving from tenure and those related to other
factors. Using these three aspects, one composite measure (following the approach of
Martins (2011)) was calculated, defined as the highest frequency of wage change for each
firm, irrespective of the specific determining factor.
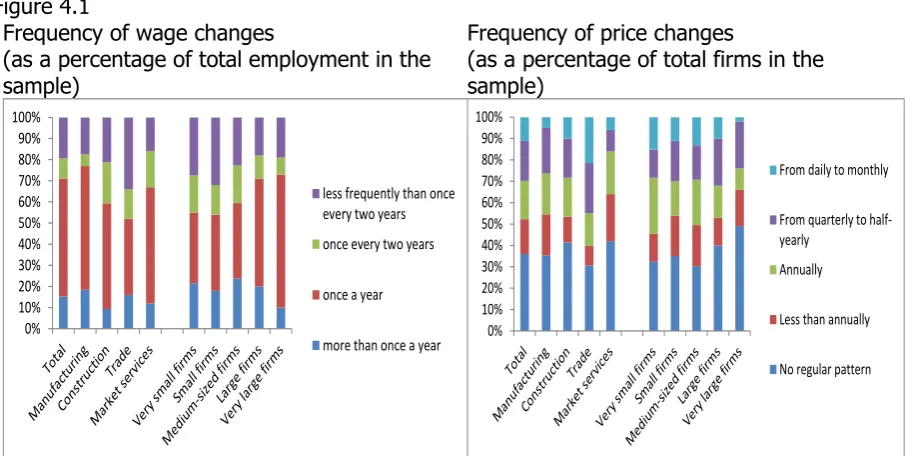
The finding derived from the surveyed firms is that wages are adjusted less
frequently. Results show that around 85% of the base wages of workers are changed once
per year or less often, while only 15% of wages change more often (see Figure 4.1). When
analyzing the frequency of price changes, the survey shows that in general firms change
prices more frequently than they change wages. Only 34% of firms report that they change
prices once a year or less frequently, 30% do it more often, while 36% do not have a
particular pattern.
The analysis by sector reveals that there is some variation across sectors in the
adjustment frequency of workers base wage. Wage changes are least frequent in
construction and market services, more frequent in trade and most frequent in
manufacturing sector. However, even in manufacturing, the base wages of around 59% of
workers are adjusted with a yearly frequency and only 19% are adjusted with a higher
frequency.
As regards to prices, firms in trade sector adjust prices much frequently than those in
manufacturing, market services and construction. Construction and market services are
sectors with the highest fraction of firms reporting no regular time-dependent pattern in
15 Figure 4.1
Frequency of wage changes
(as a percentage of total employment in the sample)
Frequency of price changes
(as a percentage of total firms in the sample)
Source: Survey on wage and price setting in Macedonia (2014).
In order to simplify the comparison, in Table 4.1 we report similar information on the
flexibility of wage and price changes, but now, in terms of number of months for which they
remain unchanged (“duration”). Following the approach of Martins (2011), a composite measure for the average duration of wage and price spells was computed. The computation
is based on firms’ answers to questions regarding the frequency of wage and price changes and by simply multiplying each point category by its respective frequency. Most answers
were directly translated into durations (e.g. “once а year” translates to duration of 12
months), while for those categories expressed through intervals, the mid-point was
assumed6.
Prices tend to remain unchanged on average for almost 7 months7. Looking at
sectoral differences, our results reveal that prices set by manufacturers and services firms
tend to remain unchanged on average for almost 8 months, whereas those set in trade and
construction are more flexible (with duration up to 5 and 6 months, respectively). When
comparing with other EU countries as a part of WDN, average price duration in Macedonia is
shorter which can be attributed to the high share of firms that experience severe or strong
competition and follow competitor’s price changes (as described in section 3).
6 Druant et al. (2009) use other more complex distribution-based technique to assess the robustness of these durations for EU
countries. They show that the results vary somewhat with the distributional assumptions, and conclude that those differences were qualitatively of minor significance.
7 Firms that answered that they have no regular pattern of changing the price of their main product (about 36% of firms) are
excluded from the calculation.
0% 10% 20% 30% 40% 50% 60% 70% 80% 90% 100%
less frequently than once every two years
once every two years
once a year
more than once a year 0% 10% 20% 30% 40% 50% 60% 70% 80% 90% 100%
From daily to monthly
From quarterly to half-yearly
Annually
Less than annually
16 As expected, durations are longer for wages, as they remain unchanged on average
for almost 16 months. There is evidence of some variation across sectors, but when looking
to firms’ size, the variation becomes smaller. Average wage duration is somewhat longer in Macedonia than in other EU countries, as a result of lower formal or informal indexation
scheme to inflation and still moderate coverage in sector or firm-level collective wage
[image:17.595.76.398.221.441.2]agreement.
Table 4.1
Average duration of wage and price spells (in months)
Wage duration Price duration
Total 15.8 6.6
Manufacturing 14.8 7.3
Construction 20.9 5.8
Trade 19.0 4.6
Market services 16.3 8.0
Very small firms 17.9 6.3
Small firms 18.5 7.2
Medium-sized firms 16.9 7.4
Large firms 15.5 5.5
Very large firms 15.9 5.5
Memo:
Total EU 15.0 9.6
Euro area 14.7 9.6
Non-Euro area 15.1 9.6
Source: Survey on wage and price setting in Macedonia (2014).
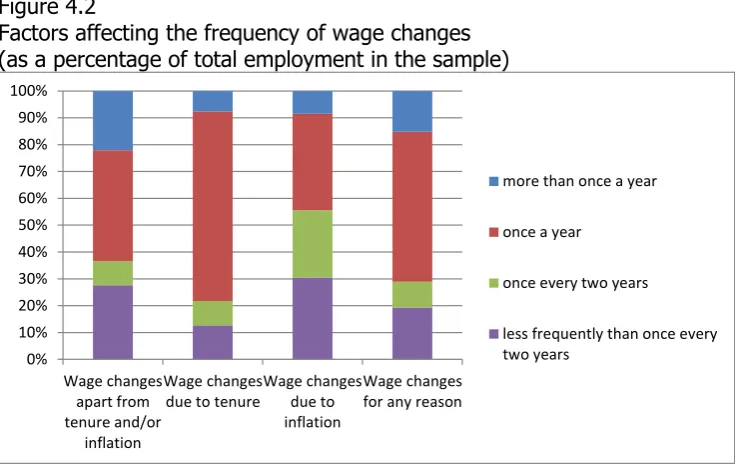
As for the reasons driving wage changes, when asking firms about the frequency of
wage changes due to inflation, tenure or other sources, it is remarkable that tenure stands
out as the most important factor producing frequent wage adjustment (on an annual or infra
annual basis). The frequency of wage changes driven due to inflation is the lowest (see
Figure 4.2). These results are somewhat different from the WDN Final Report results for the
surveyed EU countries where inflation is the most important factor driving the frequent
wage adjustment for the most EU countries. One possible explanation for this is the
relatively low share of firms applying wage indexation in Macedonia compared to the
surveyed firms in the EU. Survey results regarding indexation and adjustment of wages to
17 Figure 4.2
Factors affecting the frequency of wage changes (as a percentage of total employment in the sample)
Source: Survey on wage and price setting in Macedonia (2014).
4.2.
Time dependence and synchronisation of wage changes
Another relevant aspect of nominal wage rigidities, apart from the frequency of wage changes, is the timing of wage adjustments. In order to account for the fact that firms do not change wages in response to every shock, the literature has modelled firms’ strategies either as a time-dependent process, where the timing of the adjustment of wages does not depend on the state of the economy, or as a state-dependent one when it does8. In the presence of shocks, time-dependent rules typically lead to greater wage rigidity.
As Figure 4.3 shows and having in mind the moderate incidence of collective bargaining and dominant use of firm-level collective agreements, the survey results suggest that there is weak regular pattern in the timing of wage changes in Macedonia. Indeed, only small fraction of the surveyed firms (22.2%) report that wage changes are concentrated in a specific month. This seems to be closer with non-euro area figures (34%), while it is far lower compared to the respective share (61%) of the euro area firms surveyed that adopt time-dependent wage rules. The low degree of concentration of wage changes can also be explained by considerable low automatic indexation of wages (more details in subsection 4.3) and by the fact that tenure is the main factor that drives wage changes which are assumed to occur throughout the year. Among the firms in Macedonia that declare such a
“time-dependent” pattern, wage changes are mostly concentrated in June, July, August and January (Figure 4.3).
8 It is not necessary that firms in case of positive/negative shock in economy increase/decrease wages of employees.
0% 10% 20% 30% 40% 50% 60% 70% 80% 90% 100%
Wage changes apart from tenure and/or
inflation
Wage changes due to tenure
Wage changes due to inflation
Wage changes for any reason
more than once a year
once a year
once every two years
18 Figure 4.3
Concentration of wage setting decisions
(as a percentage of total firms in the sample; unweighted results)
Source: Survey on wage and price setting in Macedonia (2014). The sum of percentages exceeds the proportion of firms that change wages in specific months as they could choose more than one month.
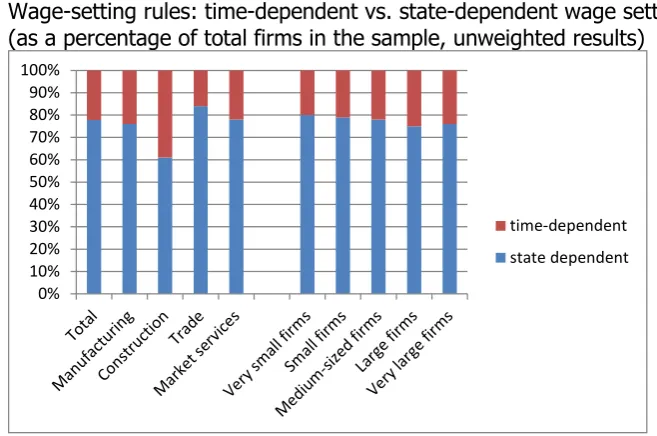
The sectoral analysis shows that firms in construction sector tend to concentrate more often their wage decisions in a particular month compared with the firms from other sectors, while differences of wage concentration across firms’ size seem to be negligible (Figure 4.4). Firms’ operations in construction sector depend on seasonal factors, and their time concentration of wage decisions come exactly from seasonality, which particularly occur in the peak of construction works.
Figure 4.4
Wage-setting rules: time-dependent vs. state-dependent wage setting (as a percentage of total firms in the sample, unweighted results)
Source: Survey on wage and price setting in Macedonia (2014).
0 1 2 3 4 5 6 7 8
Jan Feb Mar Apr May Jun Jul Aug Sep Oct Nov Dec
22.2% of firms state that wage changes are concentrated in particular month(s)
0% 10% 20% 30% 40% 50% 60% 70% 80% 90% 100%
time-dependent
[image:19.595.68.397.467.685.2]19
4.3.
Indexation and adjustment of wages to inflation
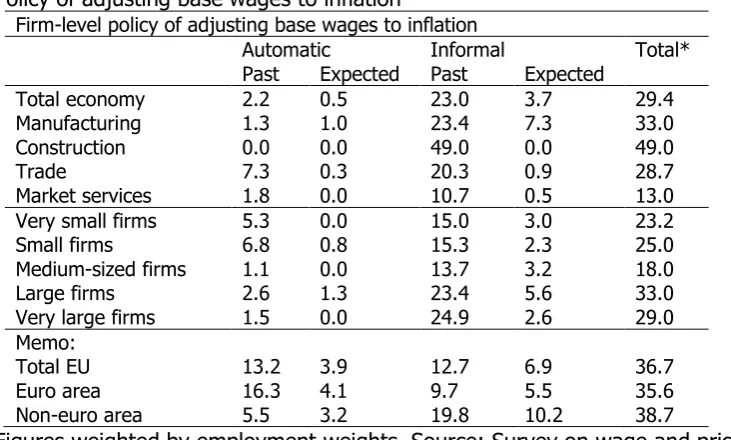
Survey on wage setting in Macedonia collected information on the prevalence of firm policies to adjust wages to inflation at the firm level. Firms were asked whether they have a policy that adapts changes in base wages to inflation or not. If so, firms were asked to report whether the adjustment is automatic or not, whether it is subject to a formal rule or not, and whether it refers to past or expected inflation. On average almost 30% of 514 firms surveyed do have an internal policy that adapts base wages to inflation, which put Macedonia in the group of countries with low level of indexation (EU is in the same group, with 37%) (Table 4.2). Of these 30%, nearly 91% has a policy that adapts wages to inflation (mostly based on past inflation) without applying any formal rule. The rest of them adopt an automatic indexation mechanism, mostly based on past inflation.
[image:20.595.75.441.427.647.2]Firms’ policies of adjusting base wages to inflation are somewhat less common in Macedonia, when compared with the surveyed firms in the EU countries. The differences are more evident in the mechanisms of indexation, where nearly half of EU surveyed firms that adapt base wages to inflation adopt an automatic indexation mechanism, and the other half has a policy that adapts wages to inflation with informal rule.
Table 4.2
Policy of adjusting base wages to inflation
Firm-level policy of adjusting base wages to inflation
Automatic Informal Total*
Past Expected Past Expected
Total economy 2.2 0.5 23.0 3.7 29.4
Manufacturing 1.3 1.0 23.4 7.3 33.0
Construction 0.0 0.0 49.0 0.0 49.0
Trade 7.3 0.3 20.3 0.9 28.7
Market services 1.8 0.0 10.7 0.5 13.0
Very small firms 5.3 0.0 15.0 3.0 23.2
Small firms 6.8 0.8 15.3 2.3 25.0
Medium-sized firms 1.1 0.0 13.7 3.2 18.0
Large firms 2.6 1.3 23.4 5.6 33.0
Very large firms 1.5 0.0 24.9 2.6 29.0
Memo:
Total EU 13.2 3.9 12.7 6.9 36.7
Euro area 16.3 4.1 9.7 5.5 35.6
Non-euro area 5.5 3.2 19.8 10.2 38.7
Figures weighted by employment weights. Source: Survey on wage and price setting in Macedonia (2014) and Druant, et al. (2009). (*) Percentage of workers covered by wage indexations clauses: Very low: 0-25%; Low: 26-50%; Moderate: 51-75%; High: 76-100% (Source: Du Caju et al, 2008.).
Looking across sectors, there is evidence of some variability, where firm’s policies
20 construction, which is in line with other EU countries. Predominant cases across each sector
are the ones where the link of indexation of base wages to inflation is not formal and tends
to be backward looking.
4.4.
Wages of newly hired workers
In the previous section, we outlined that base wages of employees in Macedonia are
somewhat rigid and less flexible. Having this in mind, it is very important to analyse the
flexibility of wages of new hires, as it could serve as additional cost-cutting strategy to
economic shocks. The literature has argued that wages offered to newly hired employees
may respond differently to aggregate labour market conditions than those of employees in
ongoing employment relationships. For example, Pissarides (2009) concludes that, on
average, a one-percentage point rise in the unemployment rate is associated with a 3%
decline in new workers’ wages9, whereas the corresponding elasticity for those in ongoing employment relationships is only about one-third of that.
In order to provide new evidence in that respect, the survey on wage setting in
Macedonia includes a question asking firms about the most relevant factor in determining
the entry wage of newly hired employees. In addition, firms are asked whether they would
consider the existing conditions on the labour market (abundance or shortage of workers)
when setting the wages of new workers.
The results from these questions suggest that the wage of newly hired workers
follow the internal rather than the external pay structure of the firm or market conditions. In
fact, as in most of the surveyed EU firms, around 89% of the surveyed firms report that
internal factors, such as the collective agreement or the wages of similar employees in the
firm, are the most important factors driving wages of newly hired employees (Table 4.3).
Comparing the results with a sample of 12 EU countries presented in Galuscak et al. (2010),
the difference can be noticed for the collective pay agreements factor, which is less
significant factor for Macedonian firms when setting the wages of new employees. The
possible explanation of this behaviour of surveyed firms in Macedonia can be the wage
bargaining process, which is predominantly organised at the firm level rather than at sector
or national level, as was observed in the previous section. The analysis across sectors shows
negligible differences.
21 Table 4.3
Importance of internal and external labour market conditions in wages of newly hired employees
(as per cent of employees in the sample)
Collective pay agreement Wages in the firm Internal factors Wages outside the firm Labour supply External
factors Total
Total 24.8 63.9 88.7 2.9 8 10.9 100
Manufacturing 35 50 85 4 11 15 100
Construction 7 85 92 3 4 7 100
Trade 22 69 91 4 6 10 100
Market
services 16 77 93 1 5 6 100
Memo:
EU 40.5 46 86.5 6.5 7 13.5 100
Source: Survey on wage and price setting in Macedonia (2014) and Galuscak et al. (2010).
The choice of internal factors (collective agreement or wages of similar employees)
as more important factors driving wages of newly hired employees is explained with fairness
considerations and the need to prevent a negative impact on effort. These two reasons are
also more common in EU surveyed firms when they set-up similar wages for newly hired
workers. In Macedonia, the concern that higher wages of new hires would inflict negative
work effort on ongoing workers appears to be stated less frequently (13.7% of firms) as a
reason preventing such practice, than in the surveyed EU countries (35.3% of the firms).
[image:22.595.74.469.508.659.2]The same concern is true with the lower wages of newly hired employees (Table 4.4).
Table 4.4
Reasons preventing different wage for new hires from incumbents
Macedonia EU
lower wage higher wage lower wage higher wage
Unfair/bad reputation 38.9 49.8 32.9 39.2
Negative impact on effort 20.6 13.7 36.2 35.3 Labour regulation/Collective
agreement 17.4 11.2 28.1 11.7
Unions would contest such action 0.4 - 1.6 - Possible pressure for wage
increases - 2.3 - 13
Other 6.2 4.4 2.9 2.6
Source: Survey on wage and price setting in Macedonia (2014) and Galuscak et al. (2010).
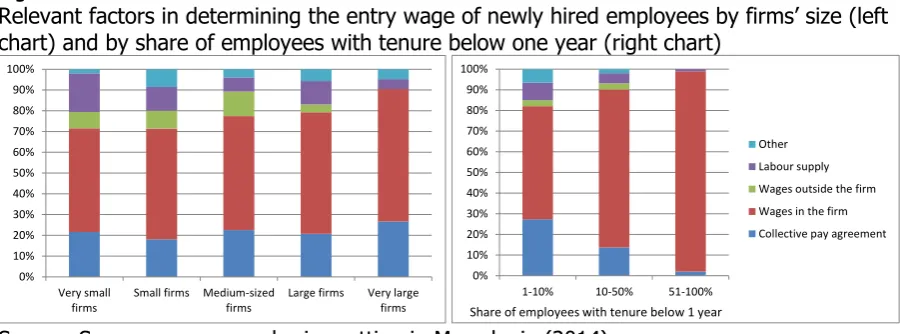
When analysing data of internal and external labour market conditions in wages of
22 because wage-setting mechanisms are more formalized in larger organizations (see Figure
4.5, left chart).
The Bewley (1999) hypothesis that external factors are used more often for wages of
new hires in secondary jobs10 is confirmed by the results from surveyed firms in the EU.
Contrary to these findings, the results from the surveyed firms in Macedonia show that when
the share of workers with tenure below one year is higher, firms do not consider at all
[image:23.595.73.527.249.416.2]external factors for wage setting of newly hired employees (see Figure 4.5, right chart).
Figure 4.5
Relevant factors in determining the entry wage of newly hired employees by firms’ size (left
chart) and by share of employees with tenure below one year (right chart)
Source: Survey on wage and price setting in Macedonia (2014).
The composition of labour force and competitive pressures should also be considered
when accounting for the practices of wage-setting of new hires in Macedonia. For example,
surveyed firms with highest share of high-skilled workers appears to be associated with a
higher dependence of wages of new hires on external factors, such as the abundance of
job-seekers, and on wages prevailing on the market in Macedonia. Still, the internal pay
structure for these firms remains the key factor in determining the wages of new hires (see
Figure 4.6, left chart). Then, we look for practices of firms with different intensity of price
competition in determining the wage of newly hired employees. In the survey, the intensity
of price competition is gauged indirectly by the question that examines whether firms are
likely to decrease prices if their main competitor decreases its own prices. Surveyed firms in
Macedonia that answer positively to that question are deemed to face more competitive
pressures, and at the same time, these firms determine the wages of new hires within their
internal pay structure (Figure 4.6, right chart).
10 Bewley (1999) distinguishes between primary and secondary jobs. Primary jobs are usually long-term and full-time, whereas
secondary jobs are often short-term and part-time.
0% 10% 20% 30% 40% 50% 60% 70% 80% 90% 100% Very small firms
Small firms Medium-sized firms
Large firms Very large firms 0% 10% 20% 30% 40% 50% 60% 70% 80% 90% 100%
1-10% 10-50% 51-100%
Other Labour supply Wages outside the firm Wages in the firm Collective pay agreement
23 Figure 4.6
Relevant factors in determining the entry wage of newly hired employees by share of high-skilled white collars in total employees (left chart) and by likelihood to follow competitor's price reduction (right chart)
Source: Survey on wage and price setting in Macedonia (2014).
4.5
Downward wage rigidities
In line with the existing literature, two types of downward rigidity were considered in
the survey questionnaire, nominal and real wage rigidity. Downward nominal wage rigidity
relates to the inability of firms to implement (and, correspondingly, the reluctance of
workers to accept) reductions in nominal wage rates. Similarly downward real wage rigidity
reflects the inability of firms to increase wages at rates below the prevailing rate of
inflation11.
Following the pioneering work of Blinder and Choi (1990), Babecky et al. (2009a)
present an alternative approach to assess nominal and real wage rigidity using WDN survey
data. In their work, downward nominal wage rigidity is defined as the share of firms that
state that they have frozen wages at least once in the past five years. The assumed
hypothesis is similar to the one used by Dickens et al. (2007), who assumed that firms that
freeze their workers’ wage would, in the absence of nominal rigidity, be accepting a cut in wage. This hypothesis assumes, of course, that those firms that never froze their workers’
wages over the five years prior to the survey do not consider the impossibility of reducing
nominal wages as an active restriction. In relation to real rigidity of wages, Babecky et al.
(2009a) consider the percentage of firms that accept the existence of an automatic
connection between the variation of their wages and inflation (past or expected) as a
measure.
11 Obviously, in the case of zero inflation, the two concepts become indistinguishable.
0% 10% 20% 30% 40% 50% 60% 70% 80% 90% 100%
1-5% 6-10% 11-25%26-50%51-75% 76+%
Other Labour supply Wages outside the firm Wages in the firm Collective pay agreement
Share of high-skilled white collars in total employees
0% 10% 20% 30% 40% 50% 60% 70% 80% 90% 100%
Very likely Likely Not likely Not at all Other Labour supply Wages outside the firm Wages in the firm Collective pay agreement
24 The important evidence from the survey is that nominal wage cuts among
Macedonian firms are relatively rare. The data show that around 12% of firms declared that
wages were ever been cut during the previous five years. On the other hand, the
percentage of firms that reported that wages were frozen during the previous five years is
somewhat higher (18.5%). This, in one way, is evidence of higher downward wage rigidity
in Macedonia as compared to the EU countries. Namely, 9.6% of the surveyed firms in the
EU reported wage freezes. The percentage is slightly higher for non-euro area countries,
where 13.4% of the firms reported wages freezes. The differences in observation periods
when surveys were conducted could be one of the explanations of discrepancies of wage
freezes in Macedonia and non-euro area countries.
The results in Table 4.5 show that nominal downward rigidity is markedly more
widespread in the firms under review than real downward rigidity (very low 2.6%).
According to the data from the surveyed firms and findings of Messina et al. (2009), the
explanation for stronger downward nominal than real wage rigidity could be the dominant
use of firm-level collective agreements, which allows firms to adjust wages downwards,
when business cycles are negative12. Thus, the use of firm-level collective agreements can
result in smaller real wage rigidity. Another explanation for relatively stronger downward
nominal than real wage rigidity is the extent of permanent contracts13, which are positively
associated with the downward nominal wage rigidity. Also, the very low real downward
wage rigidity is associated with the low automatic indexation of wages. These findings
obtained from surveyed firms in Macedonia are different from those found in many EU
countries, but are closer to surveyed firms outside the European monetary union. It is
noteworthy that there are sizeable differences across the EU countries in the incidence of
downward wage rigidity (see Babecky et al. (2009a). Overall, non-euro area countries in the
sample are almost twice as likely to experience downward nominal wage rigidity compared
to euro area countries, and the reverse is true for real wage rigidity.
12 Moreover, labour market conditions in Macedonia imply relatively weak effective negotiation power from trade unions. 13 Survey results on wage and price setting in Macedonia show that 92.4% of employees had a permanent job contract at the
25 Table 4.4
Downward nominal and real wage rigidity Wage freezes (downward
nominal wage rigidity)
Indexation (downward real wage rigidity)
Total 18.5 2.6
Manufacturing 17 2.3
Construction 8 0.0
Trade 10 7.5
Market services 31 1.8
Very small firms 21 5.3
Small firms 23 7.5
Medium-sized firms 23 1.1
Large firms 14 4.0
Very large firms 20 1.5
Collective agreement:
Yes 14 4.2
No 23 0.7
Memo:
EU 9.6 17.1
Euro area 8.1 20.4
Non-euro area 13.4 8.7
Source: Survey on wage and price setting in Macedonia (2014) and Babecky et al. (2009a). Results weighted by employment.
Surveyed Macedonian firms that apply collective wage agreements seem to freeze
wages less often than firms which are not covered by such agreements. Moreover, the
practice of cutting wages appears to be less widespread among firms that apply collective
wage agreements. The survey also allows investigating the importance of various reasons
preventing wage cuts. The findings obtained from our survey are in line with the EU
countries and show that the two most important causes for avoiding base wage cuts were
the possibility that the most productive workers would leave and the resulting reduction in
work morale. The other two reasons preventing nominal wage cuts in Macedonia are the
increasing costs of hiring and training new workers and the possibility of wages to become
26 Table 4.5
Main obstacles to base wage cuts
(firms answering "relevant" or "very relevant"*, percentages)
Reasons Percent Reasons Percent
Wage agreements and legislation 59.5 Hiring and training costs of new
workers 87.7
Impact on workers’ performance 80.8 Difficulties in attracting new
workers 82.6
Impact on workers’ morale 89.4 Impact from unexpected changes
in wages 80.2
Impact on firm’s reputation 81.6 Wages may become non
competitive 86.4
Risk of losing the best workers 93.0
Source: Survey on wage and price setting in Macedonia (2014). Results weighted by employment.
*Firms were required to place a qualitative value (from not relevant to very relevant).
4.6
Alternative means to adjust labour cost
The importance of wage rigidity clearly depends on the availability of other mechanisms through which firms can reduce their labour costs without changing the base wages. The information obtained from the survey provides evidence on the relevant importance of those alternative mechanisms. These mechanisms include the possibility to reduce or eliminate bonus payments, reduce or eliminate non-pay benefits, change shift assignments or shift premia, slowdown or freeze the rate at which promotions are filled, recruit new employees at lower wage level than those who left voluntarily, and encourage early retirement to replace high wage employees with entrants with lower wages. The firms had the chance to choose more than one of these options.
The results show that around 46% of the firms have used at least one of these strategies to reduce labour costs other than reducing base wages in the recent past, and 44% have used at least one of the six margins explicitly identified in the survey. The percent of firms that use at least one strategy to reduce labour costs is higher in manufacturing, in medium-sized and larger firms and in those firms that apply collective wage agreements and exposed to more intense competition (Table 4.7). The comparative analysis shows that the percentage of firms in Macedonia that use at least one strategy to reduce labour costs is lower compared with the EU countries. This reflects labour market conditions in Macedonia, where the practice of employers is to use mostly the base wage as compensation for employees, and therefore the adjustment mechanisms such as bonuses, benefits, promotions, or early retirement14 are used sparingly. This explanation is confirmed and
14 For example, according to legislation, the early retirement in Macedonia is allowed, but is not paid until retired employee
27 supported with survey results, which show that change in shift assignments, or shift premia, is the most frequent and dominantly used alternative as cost cutting strategy. Particularly, this strategy is more used in manufacturing, as this margin is more flexible in the production process and in medium-sized and larger firms. Other mechanisms used by firms when trying to reduce cost, but rarely compared with change in shift assignments, include taking longer over promotions or introducing a freeze on promotions, the use of cheaper hires to replace workers who leave the firm, and reduction of bonuses.
Table 4.6
Alternative strategies to reduce labour costs (in percent)
Reduce bonuses
Reduce benefits
Change shifts
Slow promotions
Cheaper hires
Early retirement
Use at least
one strategy
Total 11.0 9.6 28.2 11.5 11.1 6.9 45.9
Manufacturing 18.0 17.0 40.0 18.0 15.0 12.0 62.9
Construction 1.0 1.0 3.0 4.0 1.0 0.0 7.1
Trade 4.0 6.0 18.0 7.0 4.0 2.0 27.8
Market services 7.0 2.0 23.0 6.0 12.0 2.0 42.6
Firms' size Very small
firms 10.0 8.0 17.0 10.0 11.0 7.0 38.0
Small firms 9.0 12.0 20.0 14.0 10.0 3.0 33.0
Medium-sized
firms 15.0 21.0 31.0 15.0 12.0 9.0 49.5
Large firms 18.0 14.0 25.0 17.0 13.0 11.0 46.7
Very large
firms 6.0 5.0 31.0 7.0 10.0 4.0 46.3
Collective agreement:
Yes 14.0 13.0 24.0 16.0 13.0 11.0 47.0
No 8.0 6.0 33.0 6.0 8.0 2.0 44.6
Competitive pressure:
Severe 12.3 8.0 26.8 12.1 15.5 5.0 47.7
Strong 10.1 10.9 35.7 13.2 7.6 6.2 49.0
Weak 14.7 11.7 9.7 2.5 17.0 20.4 39.2
No competition 4.6 5.5 4.9 9.2 1.9 0.0 16.6
Memo:
Total EU 22.8 14.8 15.7 19.7 31.8 16.0 63.1
EA 20.8 14.7 15.4 22.9 37.7 19.3 64.4
Non EA 26.7 14.9 16.3 13.4 20.7 9.7 60.4
28
5.
Responses to shocks
The survey also includes questions regarding the reaction of firms to three
unanticipated shocks: a slowdown in demand and two supply shocks, an increase in
intermediate input prices (such as the rise of crude oil prices) and a permanent increase in
wages (for example, legislation that changes the required minimum wage). Firms were
required to place a qualitative value (from not relevant to very relevant) on the following
shock-absorbing strategies: 1. adjustment of prices, 2. reduction of profit margins, 3.
reduction of output, and 4. reduction of other costs. If firms state that the cost reduction
strategy is of any relevance, the options available for the responses are cutting non-labour
costs or cutting labour costs (lowering base wages and flexible wage components, reduction
of temporary or permanent employees, or reduction of working hours). Different
shock-absorbing strategies imply different effects of these shocks with regards to price and wage
[image:29.595.77.402.400.498.2]setting.
Table 5.1
Demand shock
Cost-push shock
Wage shock
Demand shock
Cost-push shock
Wage shock
Adjust prices 50.5 65.6 59.2 68.8 62.5 50.1
Reduce margins 56.6 53.5 49.8 56.4 54.3 40.7
Reduce output 49.9 21.4 22.5 60.5 44.6 34.1
Reduce costs 78 67.6 59 78.9 71.5 65.7
Source: WDN Final Report 2009, Survey on wage and price setting in Macedonia (2014).
EU Macedonia
Adjustment strategies to shocks
(percent of firms answering relevant or very relevant)
The reactions of the surveyed firms to the three shocks seem to resemble those of
the EU WDN survey participants (See Table 5.1). Namely, like the surveyed EU countries,
majority of Macedonian firms prefer to adjust to shocks by reducing their costs. The share of
firms pursuing cost reduction strategy is more dominant, of which a large share is absorbed
(around 75%, Table 5.2) by reducing non-labour costs during a supply side shock, thus
possibly reflecting wage stickiness. Half of the firms' pass-through wage increases to prices,
which could reflect the high labour cost share (see section 6.2 below) and the moderate
29 Table 5.2
Cost adjustment after shocks (% of firms choosing the adjustment strategy)
Demand shock
Cost shock
Wage shock
Demand shock
Cost shock
Wage shock Reduce non-labour costs 39.7 53.9 50 65.6 75.7 74.2 Adjust the amount of labour
Reduce number of temporary/other employees 25.1 17.9 19.9 14 10 10 Reduce number of permanent employees 15.1 10.6 11.1 4.7 3.7 4.8 Reduce hours worked per employee 8.4 6.9 7.4 9.2 3.3 4.9 Adjust wages
Reduce flexible wage components 10.5 9.5 11.6 5 6.5 6.1 Reduce base wages 1.2 1.2 - 1.4 0.8 -Figures weghted by employment weights, rescaled excluding non-responses.
Source: WDN Final Report 2009, Survey on wage and price setting in M acedonia (2014). M acedonia EU
Overall, among the various cost adjustment strategies, majority of firms in
Macedonia, similarly to firms in the EU, prefer reducing non-labour costs as opposed to
labour costs (adjusting the amount of labour or wage). However, the share of companies
following this strategy in Macedonia is much larger compared to EU firms, making the
amount of labour adjustment the second more preferable strategy, while willingness to
adjust wages was the least favourable strategy, showing little pass-through of the shocks to
employees’ wages (Table 5.2). Unlike the findings of the WDN final report, about one third of the Macedonian companies (from 24% to 34%) in the survey report that they are willing
to adjust the labour cost (amount of labour and wages), while in the case of the WDN EU
survey, the share of firms varies from 46% to 60%. Although significantly smaller, the
majority of the shock (supply and demand) is absorbed by adjusting the number of
temporary employees (between 10% and 14%), while less than 5% is absorbed by reducing
the number of permanent employees. These findings support the evidence of Bertola et al.
(2009) and the WDN final report that the “institutional framework affects the cost cutting strategy in response to shocks,” therefore as a result of rigid wages and the collective wage
agreements, demand and supply shocks are absorbed by adjusting the number of temporary
employees (Table 5.2). In case of a demand shock, firms are more willing to reduce hours
worked than to reduce number of permanent employees. The share of the surveyed
Macedonian firms willing to reduce flexible wage components during the three shocks is
lower (between 5% and 6,5%) than that of the EU firms, while the Macedonian firms, same
as the EU firms, very rarely cut costs by reducing base wages (below 2%).
The general finding is that the dominant and most relevant strategy of Macedonian
30 5.3). This finding holds regardless of whether employees are covered, or not, by a collective
wage agreement. Differences in absorbing the shocks are more evident when firms have to
resort to an alternative strategy different from cost reduction and if those firms apply
collective pay agreements. Thus, when faced with the three shocks, firms with collective pay
agreements are more likely to reduce profit margins or adjust prices. However, the
alternative strategy of adjusting prices is more dominant (compared to profit margins and
output) in firms where there is no presence of collective pay agreement. At the same, firms
with collective agreements are willing to adjust output, however this strategy appears to
have the least relevance compared to the previous three strategies (reduction of costs, price
[image:31.595.70.404.293.487.2]adjustment and profit margin reduction).
Figure 5.1
Response to wage shock
(percentage of firms stating that the strategy is very relevant/relevant)
Source: Survey on wage and price setting in Macedonia (2014).
Figure 5.2
Response to intermediate cost shock
(percentage of firms stating that the strategy is very relevant/relevant)
Source: Survey on wage and price setting in Macedonia (2014).
0 10 20 30 40 50 60 70
Yes No
Adjust prices Reduce margins Reduce output Reduce costs
Presence of collective pay agreement
0 10 20 30 40 50 60 70 80
Yes No
Adjust prices Reduce margins Reduce output Reduce costs
[image:31.595.73.407.519.706.2]