ISSN Online: 2162-2086 ISSN Print: 2162-2078
DOI: 10.4236/tel.2019.96124 Aug. 27, 2019 1955 Theoretical Economics Letters
Developing an Economic Model for Donations:
Theoretical Analysis and Policy Implication
Tin-Chun Lin
School of Business and Economics, Indiana University Northwest, Gary, IN, USA
Abstract
In developing an economic model for public donations, we applied the theory of consumer choice, and with the derived model, verified two propositions: 1) higher price elasticity of demand for a product may lead consumers to de-mand more for it but less for other products given the total budget; and 2) a tax return rate based on donations positively influences consumer well-being, while the sales tax rate negatively affects it. After looking at the policy impli-cations of public school finance, we suggest that the government should in-crease the tax return rate based on public donations instead of increasing sales tax rate to collect more funding to finance public schools.
Keywords
Donations, Tax Return Rate, Sales Tax Rate, Price Elasticity of Demand, Consumer Behavior, Consumer Wellbeing
1. Introduction
While both taxation and donation take money out of people’s pockets, their economic impacts on consumer behavior are different. Taxation is required by the government—consumers do not have a choice about paying taxes, while do-nation is not required by the government—individuals make a voluntary choice to give money to a cause or causes.
Let’s look at the case of public schools. The government uses taxes (e.g., sales taxes, property taxes, etc.) to finance our public schools. While the funding sources of public schools mainly come from taxes, a small percentage of public school funding comes from donations that can be used to pay for teachers’ bo-nuses/awards/grants or students’ scholarships/awards. Although donations do not have significant weight in public school funding, they do play an essential role in teachers’ bonuses/awards/grants and students’ scholarships/awards by
How to cite this paper: Lin, T.-C. (2019) Developing an Economic Model for Dona-tions: Theoretical Analysis and Policy Im-plication. Theoretical Economics Letters, 9, 1955-1966.
https://doi.org/10.4236/tel.2019.96124
Received: July 14, 2019 Accepted: August 24, 2019 Published: August 27, 2019
Copyright © 2019 by author(s) and Scientific Research Publishing Inc. This work is licensed under the Creative Commons Attribution International License (CC BY 4.0).
http://creativecommons.org/licenses/by/4.0/
DOI: 10.4236/tel.2019.96124 1956 Theoretical Economics Letters serving as an important incentive in improving teaching achievements and en-hancing students’ learning performance. For this reason, we should examine the importance of donations.
The issues relating to and framework for taxes (e.g., sales taxes, local taxes, etc.) have been broadly investigated and discussed by several researchers (e.g., Mikesell, 1970 [1]; Fisher, 1980 [2]; Mikesell and Zorn, 1986 [3]; Wong, 1996
[4]; and Lin and Couch, 2014 [5]). Some economics researchers (e.g., Andreoni, 1989 [6] and 1990 [7]) applied economic theory to develop models of giving based on altruism, but the factors that influence an individual’s giving behavior have been widely studied by marketing and psychology researchers (e.g., Ben-dapudi et al., 1996 [8]; Arnett et al., 2003 [9]; Baumeister, 1982 [10]; Reed II et al., 2007 [11]). Researchers in marketing and psychology focus on the concept of altruistic or selfless. That is, motivation is contrasted to egoistic motives for giv-ing. Donors in reality may act for purely altruistic or purely egoistic when they are giving their money.
No significant previous studies have used the theory of consumer choice to formulate an economic model for donations that may be used to investigate and discuss this issue. Therefore, the main objective of this study is to fill in the gap by using the theory of consumer choice to develop an economic model for dona-tions. Based upon the model, we theoretically prove propositions and discuss policy implications.
Two research questions may be specified as follows:
Q1: Would the higher price elasticity of demand for the product lead con-sumers to demand more for the product but demand less for the other products given the total budget?
Q2: Does the tax return rate due to donations positively influence consumers’ wellbeing, while the sales tax rate negatively affects consumers’ wellbeing?
2. The Model
2.1. The Utility Function
In this section, we apply the theory of consumer choice in developing an eco-nomic model for donations. As mentioned above, no significant previous studies have used the theory of consumer choice to formulate an economic model for donation, but related studies can be mentioned to support our study were done by Andreoni (1989 [6] and 1990 [7]).
DOI: 10.4236/tel.2019.96124 1957 Theoretical Economics Letters natural-born personality (denoted as K > 0), such as being optimistic or pessi-mistic—the greater the person’s level of optimism, the greater the utility. Both the numbers of donations (D) and non-donations (N) are factors that can be de-termined by the consumer; hence, these two factors are variables. Nevertheless, the natural-born personality has already been fixed; thus, this factor is regarded as a constant term.
We assume that the consumer’s utility function may be displayed in the Cobb-Douglas form, which can be expressed as below:
(
; ,)
U K D N =KD Nα β, (1)
where α and β (0<α β, <1) are constant parameters and shares of donations (D) and non-donations (N); U UD, N >0; UDD,UNN <0; and UDN =UND>0. It
should be noted that α and β are also the price elasticity of demand for do-nations and non-dodo-nations, respectively.
2.2. The Budget Constraint Line
Suppose that each time a consumer makes a donation, he/she always donates
D
P . For example, if the consumer always puts $20 in the collection basket each time he attends Sunday worship, this $20 donation may be regarded as the price of the donation for the consumer. Thus PD is the price of the donation.
To encourage people to donate their money, the IRS (Internal Revenue Ser-vice) provides a tax return to those who donate money. Therefore, we define tax return rate (
ρ
) as total amount of tax return due to donations divided by total amount of donations during a period of time, say a year. For example, the con-sumer donated $1000 in total during a year, but received a $50 tax return due to donations. Hence, the tax return rate is equal to 5% (= $50/$1000).In addition, there is a price (PN) for non-donation goods, such as general
ne-cessities. The consumer pays not only the price of the non-donation goods but also the sales tax (the sales tax rate is denoted by t).
Moreover, we assume that the consumer’s total expenditures on these two goods (donations D and non-donations N) will be equal to his/her total budget (denoted by I) for these two goods. A consumer’s total budget (I) is related to four factors: the consumer’s wealth/income (ϖ ), generosity (
δ
), sympathy (θ
), and sincerity of religious belief (φ). These four factors(
ϖ δ θ φ, , ,)
are all positively related to a consumer’s total budget (i.e., I I= ϖ δ θ φ+ + + +, , , ). The greater a
consumer’s wealth and income, the higher will be the budget the consumer will set up. A more generous consumer will give him/herself more funds to use to-ward spending. In addition, a consumer with more sympathy and/or sincere re-ligious beliefs also will give him/herself more to spend on donations.
Based upon the description above, the consumer’s budget constraint function can be specified as follows:
DOI: 10.4236/tel.2019.96124 1958 Theoretical Economics Letters
2.3. Equilibrium
Choosing D and N can solve the consumer’s optimization problem, which maximizes Equation (1) and subject the result to Equation (2). Thus, the Lagran-gian expression is set up as follows:
(
, , ,) (
1)
D(
1)
NL KD N= α β +λI ϖ δ θ φ − −ρ P D− +t P N
, (3)
where
λ
stands for the Lagrangian multiplier or a shadow price. Meanwhile, Equation (3) yields the following first-order conditions for the constrained maxi-mum:(
)
(
)
1 1
1 D 1 N
KD N KD N
P t P
α β α β
α β
ρ
− −
=
− + , (4)
(
, , ,) (
1)
D(
1)
NI ϖ δ θ φ = −ρ P D+ +t P N.
(5)
The first-order conditions are solved to yield the demand functions of D and N, which are expressed in the following:
(
)
(
)
(
(
)
)
* , , , , , , , , , ,
1
D
D
I
D D P I
P
ϖ δ θ φ α α β ρ ϖ δ θ φ
ρ α β
= =
− + , (6)
and
(
)
(
)
(
(
)
)
* , , , , , , , , , ,
1
N
N
I
N N t P I
t P
ϖ δ θ φ β α β ϖ δ θ φ
α β
= =
+ + . (7)
As shown in Equations (6) and (7), given all parameters, the demand for do-nations, D, depends on the price of donations (PD), tax return rate (
ρ
), andconsumer’s budget (I
(
ϖ δ θ φ, , ,)
); while the demand for non-donations, N, de-pends on the price of non-donations (PN), sales tax rate (t), and consumer’sbudget (I
(
ϖ δ θ φ, , ,)
).We plug D* and N* into the utility function (Equation (1)), which can be displayed as follows:
(
)
(
)
(
)
(
)
* , , , , , , , , ,
1 1 1 1 , , ,
1 1
D N
D N
U U K P P I
K I
t P P
β α
α β α β
α β α β ρ ϖ δ θ φ
α β
ϖ δ θ φ
ρ α β α β
+ =
=
− + + +
(8)
As Equation (8) shows, given all parameters, the consumer’s utility depends on the consumer’s natural-born personality (K), tax return rate (
ρ
), sales tax rate (t), price of donations (PD), price of non-donations (PN), and consumer’sbudget (I
(
ϖ δ θ φ, , ,)
). Proposition 1.Given the price of donations (PD), the price of non-donations (PN), tax
DOI: 10.4236/tel.2019.96124 1959 Theoretical Economics Letters
the demand for non-donations. Proof:
According to Equations (6) and (7),
(
)
(
)
* , , , 1 D I D Pϖ δ θ φ α
ρ α β
= − +
(
)
(
)
(
)
* 2 , , , d 0d 1 D
I D
P
ϖ δ θ φ β
α ρ α β
⇒ = >
− +
(
)
(
)
(
)
* 2 , , , d 0d 1 D
I D
P
ϖ δ θ φ α
β ρ α β
= − <
− + .
(
)
(
)
* , , , 1 N I N t Pϖ δ θ φ β α β = + +
(
)
(
)
(
)
* 2 , , , d 0d 1 N
I N
t P
ϖ δ θ φ β
α α β
⇒ = − <
+ +
(
)
(
)
(
)
* 2 , , , d 0d 1 N
I N
t P
ϖ δ θ φ α
β α β
= >
+ +
QED.
As noted earlier, shares of donations and non-donations (α and β) are the price elasticity of demand for donations and non-donations, respectively. Thus, Proposition 1 implies that when the price elasticity of demand for the product is higher, the consumer would like to demand more for the product but less for the other product due to the given total budget.
Proposition 2.
Given the price of donations (PD), the price of non-donations (PN), share of
donations (α ), share of non-donations (β), natural-born personality (K), and
total budget (I), when the tax return rate (
ρ
) increases, the consumer’s utility (wellbeing) will increase. However, when sales tax rate (t) increases, the con-sumer’s utility (wellbeing) will decrease.Proof:
According to Equation (8),
(
)
(
)
* 1 1 1 1 , , ,
1 1 D N
U K I
t P P
β α
α β
α β
α β
ϖ δ θ φ ρ
α β
α β α β
+ = − + × + +
(
)
(
)
1 *d 1 1 1 1 , , ,
d 1 1
0
D N
U K I
t P P
β α
α β
α β
α β
α ϖ δ θ φ
ρ ρ
α β
α β α β
+ + ⇒ = − +
× >
+ +
DOI: 10.4236/tel.2019.96124 1960 Theoretical Economics Letters
(
)
(
)
1 *
d 1 1 1 1 , , ,
d 1 1
0
D N
U K I
t t P P
β α α β α β α β
β ϖ δ θ φ
ρ
α β
α β α β
+ + = − + −
× <
+ +
QED.
3. Comparative Static Analysis
In addition to the first-order condition shown above, we further show the com-parative static analysis. We totally differentiate Equations (4) and (5) and obtain:
(
)
(
)
(
)
(
)
(
)
(
)
(
)
(
)
(
)
(
)
1 1 1 1 d
1 1 d
d d
0 1 1
d
1 1 1
d d
D ND N DD D NN N DN
D N
D
N D N D D N
N
N D
P U t P U P U t P U D
P t P N
I P
U t U P U P U
P
D t N P N P D
t ρ ρ ρ ρ ρ ρ − − + − − + − + − − + = − − − + − (9) where 1 0 N
U =βKD Nα β− > ,
1 1 0
ND
U =αβKD Nα− β− > ,
(
1)
2 0NN
U =β β− KD Nα β− < ,
1 0
D
U =αKD Nα− β > ,
1 1 0
DN
U =αβKD Nα− β− > , and
(
1)
2 0DD
U =α α− KD Nα− β < .
Let Ω be the determinant of the pre-multiplied matrix of vector
[
dD dN]
, which is:(
)
(
)
(
)
(
)
(
)
(
)
1 1 1 1
1 1
0
D ND N DD D NN N DN
D N
P U t P U P U t P U
P t P
ρ ρ ρ − − + − − + Ω = − + + − = > + + (10)
When we use Cramer’s rule, the straightforward comparative static analysis yields:
(
)
(
)
(
)
0 1 1
1 1
d 0
d
D NN N DN
N
P U t P U
t P D I ρ − − + + = >
Ω (11)
(
)
(
)
(
)
1 1 0
1 1
d 0
d
D ND N DD
D
P U t P U
P N I ρ ρ − − + − = >
DOI: 10.4236/tel.2019.96124 1961 Theoretical Economics Letters
(
)
(
)
(
)
(
)
(
)
1 1 1
1 1
d 0
d
N D NN N DN
N D
U P U t P U
D t P
D P ρ ρ ρ − − − − + − − + = <
Ω
(13)
(
)
(
)
(
)
(
)
(
)
1 1 1
1 1
d or 0
d
D ND N DD N
D D
P U t P U U
P D N P ρ ρ ρ ρ − − + − − − − −
= > <
Ω
(14)
(
)
(
)
(
)
(
)
(
)
1 1 1
1 1
d or 0
d
D D NN N DN
N N
t U P U t P U
t N t P
D P
ρ
+ − − +
− + +
= > <
Ω
(15)
(
)
(
)
(
)
(
)
(
)
1 1 1
1 1
d 0
d
D ND N DD D
D N
P U t P U t U
P t N
N P ρ ρ − − + + − − + = <
Ω (16)
(
)
(
)
(
)
1 1
1
d or 0
d
N D D NN N DN
N N
P U P U t P U
P N t P
D t
ρ
− − +
− +
= > <
Ω (17)
(
)
(
)
(
)
1 1 1 d 0 dD ND N DD N D
D N
P U t P U P U
P P N
N t ρ ρ − − + − − = <
Ω (18)
(
)
(
)
(
)
1 1 1 d 0 dD N D NN N DN
D N
P U P U t P U
P D t P
D ρ ρ − − + + = >
Ω (19)
(
)
(
)
(
)
1 1
1
d or 0
d
D ND N DD D N
D D
P U t P U P U
P P D
N ρ ρ ρ − − + −
= > <
Ω
(20)
Intuitively, as shown in Equations (11) and (12), budget improvement in-creases demands for both donations and non-donations. As Equations (13) and (14) show, an increase in the price of donations would reduce the number of do-nations, but does not provide consistent information about non-donations. Simi-larly, as displayed in Equations (15) and (16), a rise in the price of non-donations would discourage consumers’ demand for non-donations, but uncertainty about the donations. In addition, as demonstrated in Equations (17) and (18), a higher sales tax rate levied on non-donations decreases the demand incentives for the good, but the effect is uncertain on donations. Finally, as Equations (19) and (20) show, when the government raises the tax return rate, consumers are more willing to increase their numbers of donations, but the effect is uncertain on non-donations.
Moreover, since a consumer’s total budget (I) is a function of the consumer’s wealth/income (ϖ ), generosity (
δ
), sympathy (θ
), and sincerity of religious beliefs (φ), i.e., I I= ϖ δ θ φ+ + + +, , , DOI: 10.4236/tel.2019.96124 1962 Theoretical Economics Letters (12), which can yield:
d d d 0
d d d
D D I
I
ϖ = ϖ >
(21)
d d d 0
d d d
D D I
I
δ = δ >
(22)
d d d 0
d d d
D D I
I
θ = θ >
(23)
d d d 0
d d d
D D I
I
φ = φ>
(24)
d d d 0
d d d
N N I
I
ϖ = ϖ >
(25)
d d d 0
d d d
N N I
I
δ = δ >
(26)
d d d 0
d d d
N N I
I
θ = θ >
(27)
d d d 0
d d d
N N I
I
φ = φ >
(28)
As shown in Equations (21)-(24), when a consumer is more wealthy and/or has greater income, generosity, sympathy, and/or sincerity in his/her religious beliefs, the consumer may be more willing to increase their number of dona-tions. Similarly, as displayed in Equations (25)-(28), the consumer also will be more likely to increase his/her demand for non-donations.
4. Policy Implication
While both sale taxes and donations reduce people’s available financial re-sources, the economic effect of each on consumer behavior is different. For that reason, policy makers may manipulate the sales tax rate and tax return rate to influence consumer behavior and hence leading to different economic impacts. In this section, we discuss how sales taxes and donations affect consumer beha-vior and exert different economic impacts.
As demonstrated in Proposition 2, given the price of donations (PD), price of
non-donations (PN), share of donations (α ), share of non-donations (β ),
nat-ural-born personality (K), and total budget (I), when the tax return rate (
ρ
) increases, the consumer’s utility will increase (d 0d
U
ρ ∗
> ). However, when sales
tax rate (t) increases, the consumer’s utility will decrease (d * 0 d
U t < ).
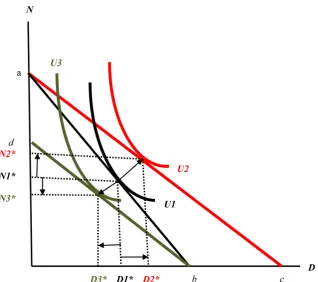
In addition to the mathematical proof shown in Proposition 2, we graphically demonstrate this in Figure 1.
As Figure 1 shows, without a sales tax (i.e.,
t
=
0
) and a tax return due to donations (i.e., ρ =0), the consumer’s initial budget constraint line is ab andDOI: 10.4236/tel.2019.96124 1963 Theoretical Economics Letters
Figure 1. Consumer’s utility changes when there is a tax return due to donations or a sales tax.
is (D1∗,N1*); thus, the consumer’s utility (wellbeing) reaches U1. We suppose that when there is a tax return due to donations (i.e., ρ>0) but no sales tax
(i.e.,
t
=
0
), the consumer’s budget constraint line will shift to ac and the op-timal choice for the combination of donations and non-donations will increase to (D2∗, N2*) [D2∗>D1* and N2*>N1*]. Hence, the consumer’s utility (well-being) will increase to U2 (U2 >U1).However, as shown in Figure 1, we now suppose that there is a sales tax (i.e.,
0
t
>
) but no tax return due to donations (i.e., ρ=0). Under thesecircums-tances, the consumer’s initial budget constraint line will shift to db and the op-timal choice for the combination of donations and non-donations will decrease to (D3∗, N3*) [D3∗ <D1*<D2* and N3*<N1*<N2*]. Hence, the consum-er’s utility (well-being) will downgrade to U3 (
U
3
<
U U
1
<
2
).Figure 1 demonstrates that the consumer suffers a loss in well-being (i.e., the difference between U1 and U3,a negative value) due to the sales tax, while gain-ing in well-begain-ing due to the tax return (i.e., the difference between U1 and U2,a positive value). In other words, the sales tax negatively affects consumer demand for non-donations, while the tax return due to donations positively influences consumer demand for donations. Simply speaking, when the consumer suffers a loss in well-being, it implies that the sales tax results in an economic inefficiency in the market. However, if the consumer wins a gain in well-being, it means that the tax return due to donations leads to an economic efficiency in the market.
dona-DOI: 10.4236/tel.2019.96124 1964 Theoretical Economics Letters tions and sale taxes on consumer well-being, let us further study each one’s elas-ticity and how the information on elaselas-ticity can inform a discussion of policy implications.
According to the demand function of donations, as shown in Equation (6), the absolute value of the tax return elasticity of demand, d
ρ
ε , can be derived as
fol-lows:
*
1 1
d D
D
ρ
ρ ρ ρ
ε
ρ ρ ρ
∂
= = =
∂ − −
(29)
Similarly, based upon the demand function of non-donations, as displayed in Equation (7), the absolute value of the sales tax elasticity of demand, d
t
ε , can
be derived as follows:
*
1 1
d
t N tt N t t tt
ε = ∂ = − =
∂ + +
(30)
Let’s assume that the tax return rate due to donations is equal to the sales tax rate, say 7% (i.e., ρ= =t 0.07). Therefore, according to Equations (29) and
(30), the absolute value of the tax return elasticity of demand will be equal to 0.0753, and the absolute value of the sales tax elasticity of demand will be equal to 0.0654, which is slightly smaller than the tax return elasticity of demand. The value of “0.0753” implies that if the government increases the tax return rate due to donations by 1%, the quantity demanded of donations will increase by 0.0753%. Nevertheless, the value of “0.0654” means that if the government cuts the sales tax rate by 1%, the quantity demanded of non-donations will rise by 0.0654%.
The information expressed above demonstrates that the impact of a tax return on consumer quantity demanded of donations is slightly greater than the impact of a sales tax on consumer quantity demanded of non-donations. This is because the tax return elasticity of demand is slightly greater than the sales tax elasticity of demand.
Therefore, for example, if the government wishes to increase funding for pub-lic schools but does not wish to raise the sales tax rate, it may do so by increasing the tax return rate for donations and encourage consumers to donate more money to public schools. Doing so not only improves consumer well-being, but also in-creases funding for public schools.
5. Conclusions
In this paper, we applied the theory of consumer choice to develop an economic model for public donations. Based upon the derived model, we verified two propositions: 1) higher price elasticity of demand for a product may lead con-sumers to demand more for it but less for other products given the total budget; and 2) a tax return rate based on public donations positively influences consum-er well-being, while the sales tax rate negatively affects it.
DOI: 10.4236/tel.2019.96124 1965 Theoretical Economics Letters but also offer public policy suggestions to the federal government. The theoreti-cal analysis demonstrated that when the tax return rate increases through dona-tions, consumer well-being will improve; when the sales tax rate increases, con-sumer well-being will decrease. In other words, sales taxes will create an economic inefficiency, while donations will create an economic efficiency. The federal gov-ernment may wish to increase the tax return rate to encourage donations rather than increasing the sales tax rate to collect more funding for public schools.
Finally and more importantly, our economic theoretical model for donations may be useful in constructing empirical models for further investigations of this issue.
Acknowledgements
The author would like to thank Ms. Joy Deng for her editorial assistance and the anonymous referee for his/her feedback and suggestions.
Conflicts of Interest
The author declares no conflicts of interest regarding the publication of this pa-per.
References
[1] Mikesell, J.L. (1970) Central City and Sales Tax Rate Differentials: The Border City Problem. National Tax Journal,23, 206-213.
[2] Fisher, R.C. (1980) Local Sales Taxes: Tax Rate Differentials, Sales Loss, and Reve-nue Estimation. Public Finance Quarterly, 8, 171-188.
https://doi.org/10.1177/109114218000800203
[3] Fisher, R.C. and Zorn, C.K. (1986) Impact of the Sales Tax Rate on Its Base: Evi-dence from a Small Town. Public Finance Quarterly, 14, 329-338.
https://doi.org/10.1177/109114218601400305
[4] Wong, J.D. (1996) The Impact of Local Option Sales Taxes on Retail Sales, Em-ployment, Payrolls, and Establishments: The Case for Kansas. Review of Regional Studies, 26, 165-176.
[5] Lin, T.-C. and Couch, A. (2014) The Impact of Federal, State, and Local Taxes on Student Achievement in Public Schools: The Case of Indiana. Applied Economics Letters, 21, 220-223.https://doi.org/10.1080/13504851.2013.849376
[6] Andreoni, J. (1989) Giving with Impure Altruism: Applications to Charity and Ri-cardian Equivalence. The Journal of Political Economy, 97, 1447-1458.
https://doi.org/10.1086/261662
[7] Andreoni, J. (1990) Impure Altruism and Donations to Public Goods: A Theory of Warm-Glow Giving. The Economic Journal, 100, 464-477.
https://doi.org/10.2307/2234133
[8] Neeli, B., Singh, S.N. and Bendapudi, V. (1996) Enhancing Helping Behavior: An Integrative Framework for Promotion Planning. Journal of Marketing, 60, 33-49.
https://doi.org/10.2307/1251840
DOI: 10.4236/tel.2019.96124 1966 Theoretical Economics Letters [10] Baumeister, R.F. (1982) A Self-Presentational View of Social Phenomena.
Psycho-logical Bulletin, 91, 3-26.https://doi.org/10.1037/0033-2909.91.1.3
[11] Reed II, A., Aquino, K. and Levy, E. (2007) Moral Identity and Judgments of Cha-ritable Behaviors. The Journal of Marketing, 71, 178-193.