Job Mix Formulation for Bituminous Concrete Grade II
Using C# Programming
V. Venkat Ramayya
1,*, V. Vinayaka Ram
2, S. Krishnaiah
31Department of Civil Engineering, Mahatma Gandhi Institute of Technology, Hyderabad, India
2Department of Civil Engineering, BITS, Hyderabad, India
3Department of Civil Engineering, JNTUA, Anantapuramu, India
Received 16 January 2018; received in revised form 04 March 2018; accepted 17 April 2018
Abstract
Bituminous Concrete mix design is a complex process and different methods are proposed by a number of researchers. Marshall’s method of mix design is one such process, which became very popular among the
practitioners in India and elsewhere. SUPERPAVE method of mix design which takes into account climatic and
traffic factors for aggregate and binder selection. It has gained its prominence and is observed to be superior to any
other well-known mix design processes. Aggregate gradation adopted for the mix design plays a crucial role in the
performance of the mix. Many researchers have developed mechanisms to work out Job Mix Formulations (JMF) so
as to reach the appropriate aggregate mix in the field.
The analytical phase of JMF deals with the method of blending of aggregates from the identified stockpiles in
order to fulfill the requirements of gradation as specified by agencies for a given layer of flexible pavements.
Methods proposed for aggregate blending includes the graphical methods, trial and error method and optimization
techniques. The aim of these techniques is two-fold; the first is to optimize the cost involved in blending from the
known unit cost of individual stockpiles; and the other is to fulfill the gradation recommendations of the local
agencies and parameters suggested in other methods. In this research, an attempt has been made to develop C#
(C-Sharp) application in .NET framework using the sequential search technique to work out the best blend of aggregate particles by ensuring the requirements mentioned in MoRTH’s (Ministry of Road Transport & Highways,
India) recommended practice. Bailey’s method and the maximum density line have been recommended in 0.45
power chart and incorporating optimization criteria. Grade II bituminous concrete has been chosen for the research.
It was clearly observed that the fine aggregate fraction in the stockpiles influences the final Job Mix Formulation.
The devleloped tool can accommodate up to 5 stockpiles. It was also observed that the Bailey’s requirements are
more stringent when compared with MoRTH requirements as far as JMF is considered. The developed tool is
capable of generating the blends with Recycled Asphalt Pavement (RAP) aggregate blends.
Keywords: bituminous concrete, maximum density line, bailey’s parameters, aggregate blending, C# Programming, job mix formula.
1.
Introduction
The flexible pavement is a layered system where the load transfer takes place through the grain to grain contact [1]. In
each of these layers, an aggregate blend with different sizes will be used along with the bitumen binder, which forms the binder matrix and holds the aggregates in place. The bituminous concrete mix design is a complex process. Marshall’s method of mix
*Corresponding author. E-mail address: [email protected]
design is the most popular in India and elsewhere [2].The Marshall specimen prepared using the Optimum Binder Content
(OBC) shall satisfy the parameters like Stability, Flow, Volume Filled with Bitumen (VFB), Volume in Mineral Aggregates
(VMA) and Volume of Voids (Vv) [9]. Agencies from different countries have standardized the requirements of these
parameters and it is mandatory to verify these parameters before adopting a given mix in the field.
A number of internal and external factors are responsible for distress in flexible pavements. Aggregate gradation is one of
the internal factors. The gradation adopted is going to influence the performance of dense graded, open graded and stone
matrix asphalt mixes. Research has shown that aggregate gradation will influence the performance of porous asphalt mixes.
These pavements are now in use for effective stormwater management.The performance of porous asphalt mixes is studied
through permeability and air voids [3]. The aspects of strength and durability of these mixes are related to the gradation [3].
The aggregate gradation adopted is known to have its influence on mobility, ability to be compacted, stiffness, durability and
permeability of the asphalt mixes [4]. Mixes with ensured continuity of gradation were observed to have better rutting
resistance [6].
Apart from the gradation chosen for the mix, the Nominal Maximum Particle Size (NMPS) is also observed to have an
influence on pavement performance. With the increase of NMPS, the rutting resistance is observed to improve while mixes
with smaller NMPS, they found to exhibit better raveling resistance [7]. Therefore it can be stated that the gradation of the mix
should be given utmost importance and the method of grade selection should be rational to ensure satisfactory pavement
performance.
Several methods were proposed by researchers for assessment of gradation requirements of layers in flexible pavements
[8]. Since it is not practically possible to sieve the aggregates in the field, the target gradation is attained by blending aggregate
stockpiles from one or more quarry sites in a specific proportion called Job Mix Formula. The methods proposed for blending
includes Graphical Method, Triangular Chart Method & Asphalt Institute graphical Method and optimization methods [8].
Graphical methods cannot be used when number of stockpiles is more than 3. As of today, there are no tools available for
integrating different philosophies of gradation selection and hence there is a potential for research in this area.
2.
Objective of The Research
In view of the research gap identified, the objective of the present research is to develop an integrated software tool using
C# programming for Job Mix Formulation (JMF) of Grade 2 of bituminous concrete mix wearing course. MoRTH specifications, Bailey’s parameters, 0.45 Power gradation chart and cost per unit of the stock pile have been simultaneously
considered to workout different combinations of aggregate blends.
3.
Problem Formulation
The blends are to be filtered as per three philosophies mentioned previously. The objective function is
.
1
Min C
i
m
p cpj
j
j
(1)PPupperJMF
i
(2)PPlower
JMF
i
(3)1
1
p
m
j
j
(4)1
1
JMF
i
m
p PPj ij
i to nj
(5)Ci unit material cost of the ith blend
M number of designated stock piles in the mix
pj proportion of aggregates of the jthstockpile cpj cost per unit of jth stockpile
JMFi Job Mix Formula for ith particle
n number of designated particles in the mix
PPij percent passing of the ith particle for jth stock pile obtained from sieve analysis
PPlower recommended lower percent passing PPupper recommended higher percent passing
All particles in the mix should satisfy the condition specified in the Eqs. (2) and (3) above for a successful trial blend. Apart from the requirements of gradation, Bailey’s method addresses the issues related to the ability of the mix to get
compacted, segregation and continuity of gradation. The method is not very popular, due to the lack of extensive field
verification of the pavement stretches designed using this method [13]. In this method, guidelines have been laid down through
three parameters viz. Coarse Aggregate Ratio (CA Ratio), coarser portions of the Fine Aggregate ratio (FAc) and finer portions
of Fine Aggregate ratio (FAf). These ratios will be calculated based on NMPS of the mix, which is one sieve greater than the
sieve on which at least 10% of the particles are retained as per TRB circular E-C044 [13]. The three ratios specified are linked
to half, primary, secondary and tertiary control sieves so as to distinguish the coarser and finer portions of the mix.
4.
Inputs for Determination of JMF
In order to find the proportion of aggregate blends for a specified type of layer and hence JMF for a stated NMPS, it is
required to collect samples from the stockpiles of quarry sites and perform the sieve analysis. The percent passing of each of
the particle sizes is to be obtained in sieve analysis and will become input for determination of the JMF.
The maximum density line is plotted using Eq. (6).
where
Size i Size of ith particle in the mix Sizemsa Maximum size aggregate
5.
Need for a Computational Tool
The spreadsheets are now being used to find a blend which satisfies the grading requirements of the specified layer
fulfilling Eqs. (2) and (3) for all the particles in the mix. This is a trial and error method with several proportions satisfying the
grading requirements. In order to generate all those proportions which fulfilled the requirements of gradation and to address the
issues of compaction, segregation and cost per unit of the blend, excel spreadsheet has its own limitations. To accomplish this,
an interactive software interface is developed by using the C# (C-Sharp) language.
C# is a very useful tool which supports the use of FORMS in Windows environment with Graphic User Interface (GUI) as
front end, the user can input data and it is possible to manipulate the data with suitable computations, manage and export data
*100
0.45
PP
i
Size i
Size msa
files in the back end using Object Oriented Programming (OOP) concept. Thus C# programming has been chosen to develop
the interactive GUI software for the assessment of JMF in the current research. The software requires Microsoft NET 4.5
Framework or higher version for execution.
6.
Need for a Computational Tool
In order to select a suitable blend, the following criteria have been adopted and embedded in the software.
(i) The proportions generated by the software will be examined for the MoRTH requirement.
(ii) Bailey Parameters will be evaluated for the percent passing of each blend obtained. The parameters will be worked out as per the following formulae.
where
CA Ratio Coarse Aggregate Ratio
PP half sieve Percent Passing Half Sieve
PCS Primary Control Sieve = 0.22 x NMPS
SCS Secondary Control Sieve = 0.22 x PCS
TCS Tertiary Control Sieve = 0.22 x SCS
PP PCS Percent Passing Primary Control Sieve
PP SCS Percent Passing Secondary Control Sieve
PP TCS Percent Passing Tertiary Control Sieve
The factor 0.22 had arrived after considering the analysis of 2-D and 3-D packing of different shaped particles. 2-D
Analysis has shown the particle diameter ratio equal to 0.155 (all round) and 0.289 (all flat) with an average of 0.22 for angular
and subangular particles [12]. These parameters will be computed from percent passing of each blend generated in the process.
(iii) For each of these proportions generated by the software, the level of gradation closer to the maximum density line is evaluated by the statistical parameter Root Mean Square Error (RMSE) [5].
where
PPmax density
Percent Passing corresponding to the istrticle for the maximum density line in the mix
PP JMF Percent Passing corresponding to the ist rticle in the trial blend
i Index for the particle in the mix
n Total number of particle sizes in the mix
The blend of aggregates which fulfill the requirements of MoRTH and Bailey with the least of RMSE and with the least
cost per unit of the blend will be recommended for final implementation. In the present research work, the nominal maximum
particle size was chosen as 12.5 mm. The CA ratio between 0.50 and 0.65 and other two ratios in the range 0.35 to 0.50 have been chosen, as recommended in Bailey’s specifications.
100
PP PP
PP
CA Ratio
Half Sieve
PCS
Half Sieve
(7) PP FA Ratio PPSCS
c
PCS
(8) PP FA Ratio PPTCS
f
SCS
(9)(
max.
)2
(1) CA Ratio:
The three ratios discussed above are chosen based on NMPS. It was observed that the mixes with lower values than
recommended CA Ratio, and are subjected to segregation and are generally gap-graded mixes, while the mixes with higher
values of CA Ratio will have issues related to continuity of gradation and difficulty in compaction.
(2) FAc Ratio:
While the mixes with lower values of FAc ratios will have non-uniform gradation and will have problems of compaction,
the higher values will indicate the presence of excessive amounts of fine aggregate leading to tender mixes. The mixes with
higher values of FAc ratio will show a hump in the 4.75 mm region and below when plotted on a 0.45 power gradation chart.
(3) FAf Ratio:
This ratio explains how fine aggregates pack together and influence the voids in the mix. Typically, dense graded mixes
will have FAf less than 0.50. Also, VMA increases with the decrease in this ratio.
7.
Need for a Computational Tool
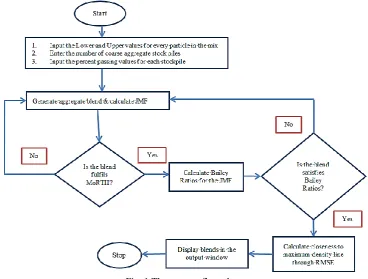
The flow chart for the process incorporating the above said criteria is presented in Fig. 1.
Fig. 1 The process flow chart
7.1. Sample source code
The sample source code is presented below for the control ‘Find JMF’ button.
private void button3_Click_1(object sender, EventArgs e)
{
//Find JMF Button
string str1, str2, str3, str4, str5;
for (j = 0; j < 10; j++)
str1 = dataGridView2.Rows[j].Cells[1].Value.ToString();
ppsize1[j] = double.Parse(str1);
}
for (j = 0; j < 10; j++)
{
str2 = dataGridView2.Rows[j].Cells[2].Value.ToString();
ppsize2[j] = double.Parse(str2);
}
for (j = 0; j < 10; j++)
{
str3 = dataGridView2.Rows[j].Cells[3].Value.ToString();
ppsize3[j] = double.Parse(str3);
if (noofcoarsepiles == 2)
ppsize3[j] = 0;
}
for (j = 0; j < 10; j++)
{
str3 = dataGridView2.Rows[j].Cells[4].Value.ToString();
ppsize4[j] = double.Parse(str3);
}
for (j = 0; j < 10; j++)
{
str5 = dataGridView2.Rows[j].Cells[5].Value.ToString();
mf[j] = double.Parse(str5);
}
//Location of Maximum density line
for (i = 0; i < 10; i++)
{
strtemp = dataGridView2.Rows[i].Cells[0].Value.ToString();
size[i] = double.Parse(strtemp); ssr[i] = Math.Pow(size[i], 0.45);
if (i > 0)
maxden[i] = 100 * Math.Pow(size[i] / size[0], 0.45);
else
maxden[0] = 100;
}
int looper = 0, morth = 0;
// Three Stockpiles in Coarse Aggregates
if (noofcoarsepiles == 3)
{//outermost loop
for (s1 = 1; s1 <= 95; s1++)
{//1
tester = 0;
for (s2 = 1; s2 <= 95; s2++)
{//2
if (98 - s1 - s2 > 0)
{//3
{//4
for (s3 = 1; s3 <= 95; s3++)
{//5
bandmchecker = 0; s4 = s34 - s3;
if (s4 > 0)
{//6
if ((s1 + s2 + s3 + s4 + s5) == 100)
{//7
tester = 0; newrmssum = 0; jmfsum = 0; bandmchecker = 0;
looper = looper + 1;
for (i = 0; i < 10; i++)
{
JMF[i] = 0.01 * (s1 * ppsize1[i] + s2 * ppsize2[i] + s3 * ppsize3[i] + s4 * ppsize4[i] + 2 * mf[i]);
jmfsum = jmfsum + JMF[i];
if (JMF[i]<=upper[i]&&JMF[i]>= lower[i])
tester = tester + 1;
newrmssum = newrmssum + (JMF[i] - maxden[i]) * (JMF[i] - maxden[i]); }
8.
Results of Software for Local Quarry Stockpiles
Sample sieve analysis was performed for all the four aggregate stockpiles, procured from a local quarry. The results of
sieve analysis are considered for generating the alternative aggregate blends through the software developed during the present
study. The user can edit the data of percent passing and generate the blends.
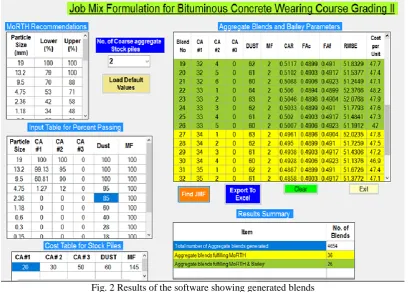
Fig. 2 Results of the software showing generated blends
The results of C# Program are presented in Fig. 2 for two aggregate stockpiles. In the initial trial, the gradation of dust
could generate blends fulfilling only MoRTH gradation. Subsequently, change of gradation of dust could give blends to fulfill
both MoRTH and Bailey criteria; therefore it can be observed that gradation of dust will influence JMF. Out of 4656
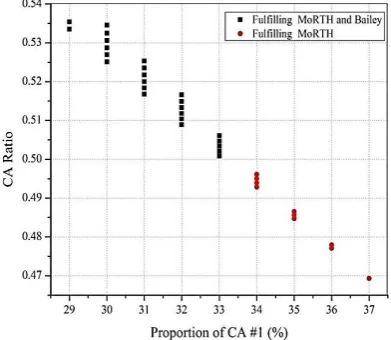
7.52 and 9.53 respectively. The dependency of Bailey’s parameters on aggregate proportions is presented in Fig. 3. No
significant observations could be made with regard to the variation of other stockpiles with Bailey parameters and hence not
discussed.
The successful JMF of the 3 blends with minimum dust and maximum CA # 1 & CA # 2, maximum dust with minimum
CA #1 and maximum dust with minimum CA # 2 fulfilled both MoRTH & Bailey parameters with RMSE values, 8.68, 10.54
and 10.45 respectively have been chosen from the results and are plotted and presented in Fig.4.
Also, Superpave control points were also marked on the plot for verification. Even though the restricted zone has lost its
significance [4] in Superpave gradation, out of research interest, it was also plotted in Fig.3. It can be clearly observed that all
the 3 blends with designated % feed have fulfilled Superpave control points, while the blend with minimum dust, maximum
CA #1 and CA #2 is observed to be the closest to the maximum density line, with least RMSE of 8.68 and also with the lowest
cost per unit and hence recommended for final implementation.
Fig. 3 Variation of CA # 1 with CA Ratio for Dust 6
Fig. 4 Aggregate gradation for selected blends with % feed along with Superpave control points fulfilling MoRTH & Bailey Criteria
9.
Conclusions
This research has presented the development of software for the assessment of JMF for BC grade II. Excel spreadsheets
are been widely used to find the desired blend limiting with few successful blends. The software is developed by the C#
programming for arriving at the JMF had to fulfill MoRTH & Bailey requirements. It is capable of generating blends fulfilling
MoRTH and Bailey parameters; and will be able to assess the nearness to maximum theoretical density line along with the cost
per unit of the blend. A sample source code was also presented.
The results of a case study were also discussed wherein the gradation of dust obtained from a local quarry and was
observed to fulfill MoRTH requirements with 36 combinations of aggregate blends and 26 combinations to fulfill Bailey
requirements. The gradation of dust plays a vital role in designing the JMF. From the study, it can also be concluded that the
Bailey requirements are more stringent than MoRTH and the Superpave gradation. The tool developed with C# programming
in the .NET framework will facilitate the designers to arrive at most optimal blend and will serve in the initial phase of the mix
design process fulfilling recommendations of local agencies, Bailey parameters and Superpave.
Conflicts of Interest
References
[1] Y. H. Haung, Pavement Analysis and Design, 2nd ed, Pearson Education, USA.
[2] Active Standard, “Standard test method for marshall stability and flow of asphalt mixtures,” West Conshohocken, PA, 2015.
[3] T. N. Mansour, Bradley J. Putman, “Influence of aggregate gradation on the performance properties of porous asphalt mixtures,” Journal of Materials Civil Engineering, vol. 25, no.2, pp. 281-288, 2013.
[4] Cooley Jr, L A. Zhang, Jianping, Kandhal, P. S. Hand, A. J. Epps Martin A, “Significance of restricted zone in superpave aggregate gradation specification,” Transportation Research Circular No. E-C043, Transportation Research Board, National Research Council, Washington, D.C., 2001.
[5] R. J. Hyndman, A. B. Koehler, “Another look at measures of forecast accuracy,”. International Journal of Forecasting, vol. 22, no. 4, pp. 679-688, 2006.
[6] B. E. Ruth et al, “Aggregate gradation characterization factors and their relationships to fracture energy and failure strain of asphalt mixtures,” Journal of Association of Asphalt Paving Technologies. vol. 71, pp. 310-344, 2002.
[7] H. Liu, P. Hao and J. Xu, “Effects of nominal maximum aggregate size on the performance of stone matrix asphalt,” Applied Sciences, vol. 7, no. 126, 2017.
[8] Mario T. Tabiucanon, P. Adulbhan, Stephen and S. Y. Chen, “A probabilistic programming model for blending aggregates,” Applied Mathematical Modelling, vol. 4, pp. 257-260, 1979.
[9] The Asphalt Institute, “Mix design methods for asphalt concrete and other hot-mix types,” MS-2 (4th edn), Maryland, 1974.
[10] W. R. Vavrik, “Bailey method for gradation selection in hot-mix asphalt design transportation research circular,” TRB Circular Number E-C044, 2002.
[11] Specifications for Base and Surface Course, Section 500, Materials for Structures, MoRTH, Government of India, 2015. [12] W. R. Vavrik, W. J. Pine, G. Huber, S. H. Carpenter and R. Bailey, “The bailey method of gradation evaluation: the
influence of aggregate gradation and packing characteristics on voids in the mineral aggregate,” Journal of the Association of Asphalt Paving Technologists, vol. 70, pp. 132-175, 2001.
[13] W. R. Vavrik, W. J. Pine and S. H. Carpenter, “Aggregate blending for asphalt mix design: the bailey method,” Presented at the 81st Annual Meeting of the Transportation Research Board, Washington, D.C., vol. 1789, pp. 146-153, 2002. [14] W. R. Vavrik, “Quality control of hot-mix asphalt: controlling aggregate interlock through the bailey method,” In
Proceedings of the 1st International Conference on Quality Control and Quality Assurance of Construction Materials, Dubai Municipality, United Arab Emirates, 2001.
Copyright© by the authors. Licensee TAETI, Taiwan. This article is an open access article distributed under the terms and conditions of the Creative Commons Attribution (CC BY-NC) license