R E S E A R C H A R T I C L E
Open Access
Evaluating the effectiveness of IV iron
dosing for anemia management in
common clinical practice: results from the
Dialysis Outcomes and Practice Patterns
Study (DOPPS)
Bruce M. Robinson
1,2*, Maria Larkina
1, Brian Bieber
1, Werner Kleophas
3, Yun Li
1,2, Francesco Locatelli
4,
Keith P. McCullough
1, Jackie G. Nolen
5, Friedrich K. Port
1and Ronald L. Pisoni
1Abstract
Background:Anemia management protocols in hemodialysis (HD) units differ conspicuously regarding optimal intravenous (IV) iron dosing; consequently, patients receive markedly different cumulative exposures to IV iron and erythropoiesis-stimulating agents (ESAs). Complementary to IV iron safety studies, our goal was to gain insight into optimal IV iron dosing by estimating the effects of IV iron doses on Hgb, TSAT, ferritin, and ESA dose in common clinical practice.
Methods:9,471 HD patients (11 countries, 2009-2011) in the DOPPS, a prospective cohort study, were analyzed. Associations of IV iron dose (3-month average, categorized as 0, <300,≥300 mg/month) with 3-month change in Hgb, TSAT, ferritin, and ESA dose were evaluated using adjusted GEE models.
Results:Relative change: Monotonically positive associations between IV iron dose and Hgb, TSAT, and ferritin change, and inverse associations with ESA dose change, were observed across multiple strata of prior Hgb, TSAT, and ferritin levels.Absolute change: TSAT, ferritin, and ESA dose changes were nearest zero with IV iron <300 mg/ month, rather than 0 mg/month or≥300 mg/month by maintenance or replacement dosing. Findings were robust to numerous sensitivity analyses.
Conclusions:Though residual confounding cannot be ruled out in this observational study, findings suggest that IV iron dosing <300 mg/month, as commonly seen with maintenance dosing of 100-200 mg/month, may be a more effective approach to support Hgb than the higher IV iron doses (300-400 mg/month) often given in many European and North American hemodialysis clinics. Alongside studies supporting the safety of IV iron in 100-200 mg/month dose range, these findings help guide the rational dosing of IV iron in anemia management protocols for everyday hemodialysis practice.
Keywords:anemia, ferritin, hemodialysis, hemoglobin, IV iron, TSAT
* Correspondence:[email protected]
1Arbor Research Collaborative for Health, 340 E. Huron, Suite 300, Ann Arbor,
MI 48104, USA
2University of Michigan, 1415 Washington Heights, Ann Arbor, MI 48109, USA
Full list of author information is available at the end of the article
Background
Anemia due to deficient renal erythropoietin production is nearly universal among hemodialysis (HD) patients. Treatment with erythropoiesis-stimulating agents (ESAs) and intravenous (IV) iron has been the cornerstone of anemia management for over two decades, and it is well established that IV iron is vital to support hemoglobin (Hgb) levels and optimize ESA dosing [1–5].
Despite this, the optimal IV iron management prac-tice to support ESA therapy remains uncertain. First, there may be safety considerations that should limit the amount of IV iron given to patients. While pre-clinical and small clinical studies have indicated that IV iron may lead to oxidative stress, inflammation, risk of infection, and tissue iron overload, large observational studies have reported incongruent associations with clinical outcomes [6–21]. A 2014 KDIGO Controversies Conference on iron management in CKD focused nearly exclusively on the safety of IV iron [22]. Simi-larly, an ongoing multicenter clinical trial in the UK will compare the safety of a high-dose versus a low-dose IV iron regimen [23].
These questions about the safety of IV iron underlie the imperative to understand the most effective IV iron management strategies, i.e., to give the‘right amount’of IV iron to support ESA use and target hemoglobin levels in everyday practice. Data from small clinical trials show that Hgb responsiveness to ESA dosing improves with IV iron dosing that achieves higher levels of iron mea-sures, e.g., transferrin saturation (TSAT) levels of 30%-35% [24–30]. However,‘real world’ data on the best IV iron dosing strategies to support anemia management are lacking, with a dearth of publications comparing the effectiveness of different IV iron dosing approaches.
Uncertainty regarding optimally effective IV iron management strategies, including IV iron dosing and TSAT and ferritin targets, is reflected in clinical prac-tice recommendations that differ conspicuously: e.g., the KDIGO anemia guideline in 2012 and the ERBP and KDOQI responses to this guideline in 2013 [31–35]. In this context, it is not surprising that previous DOPPS publications have demonstrated that protocols for anemia management and IV iron dosing are widely variable within and across countries [36–39]. As a consequence, patients receive markedly different cumulative exposures to IV iron and ESAs, and ferritin levels are now much higher in the US than in other countries, as are TSAT levels to a lesser extent [40–42].
The primary goal of this study was to help to determine if there is an IV iron management strategy that would optimize the effect of IV iron dosing on Hgb levels and, secondarily, on TSAT, ferritin, and ESA dose in common clinical practice. In the context of unresolved safety ques-tions, we hope to inform optimal IV iron management
practices to support Hgb levels while limiting unnecessary or excessive use of ESAs and IV iron.
Methods
DOPPS Participants and Data
The Dialysis Outcomes and Practice Patterns Study (DOPPS) is an international prospective cohort study of hemodialysis patients ≥ 18 years of age. Patients are enrolled randomly from national samples of dialy-sis facilities in each participating country [43, 44]. Demographic data, comorbid conditions, laboratory values, and medications were abstracted from patient records at study enrollment. Laboratory measures and renal medications were updated monthly. Study ap-proval was obtained by a central institutional review board, and as required by national and local ethics committees. Written, informed consent was obtained from all participants.
Analysis sample
All patients (n=15,019) from DOPPS phase 4 (2009-2011) in Europe-A/NZ (Belgium, France, Germany, Italy, Spain, Sweden, and the United Kingdom, plus Australia and New Zealand), and North America (Canada, United States) were eligible for the analysis sample. Patients from Japan were excluded due to much lower levels of IV iron pre-scriptions. Additional file 1: Figure S1 diagrams a selection of the analysis sample. Patients were required to receive dialysis for at least 4 consecutive months (labeled as months 0 to 3), have TSAT and ferritin values reported at months 0 and 3, have IV iron dosing information for at least 2 of 3 months between the month 0 and 3 lab values, and survive for at least 2 months after month 3, for an analysis sample of 9,471 patients. For patients with mul-tiple suitable 4-month periods, the first period was used. The 3-month interval length was selected because most facilities measure TSAT and ferritin lab values at least quarterly.
Analytic approach
Monthly IV iron and ESA doses were estimated based on the prescription at the end of each month. Patients not prescribed IV iron or ESA were considered to have a 0 dose for the month. ESA doses were standardized to IV epoetin equivalent units, using a factor of 200 to convert darbepoetin alfa and a factor of 1.15 to convert subcutaneous epoetin [34]. The primary exposure was the average monthly IV iron dose over months 0 to 3 (Additional file 2: Figure S2). The outcomes were changes from month 0 to month 3 in Hgb, TSAT, ferritin, ESA dose, and CRP (denoted with Δ and sub-scripts3-0, e.g.,ΔHgb3-0).
and 5 categories of ferritin0. A generalized estimating
equation (GEE) model was used to estimate the expected change in outcomes separately for each stratum condition and reported for each IV iron category (holding all adjust-ment variables constant). Trends across IV iron categories in each stratum were also tested with p-values reported. Each model was adjusted for demographics (age, sex, black race), body mass index, time on dialysis, catheter use, region (North America, Europe-A/NZ), 13 summary comorbid conditions, laboratory values at month 0 (Hgb, ferritin, TSAT, albumin, creatinine, white blood cell count), and ESA dose averaged over months 0 to 3 (unless included in the outcome or strata). Hgb, TSAT, and fer-ritin were categorized according to common clinical cut points. For the primary analysis, IV iron categories (no IV iron [0 dose], 1 to <300, and≥300 mg/month) were based on a previous DOPPS publication demonstrating no eleva-tion in mortality at <300 mg/month [6]. Addieleva-tional ana-lyses dichotomized the ≥300 mg/month IV iron dose category according to replacement dosing (defined as ≥500 mg during any of the 3 months) or maintenance dosing (300-499 mg per month in all 3 months). Multiple sensitivity analyses were performed.
There were few missing values (<2% for the majority of covariates, < 6% for all). Ninety-eight percent of the sample had 3 months of IV iron dosing information, and 2% had 2 months. For missing data, we used the Sequen-tial Regression Multiple Imputation Method by IVEware [45], and analyzed using the MIAnalyze procedure in SAS/STAT® 9.3. Adjustment variables, but not outcome variables, were imputed. Analyses used SAS version 9.3 (SAS institute, Cary, NC).
Results
Distribution of IV iron doses
Thirty percent of patients received no IV iron over three months; 40% received (on average) <300 mg/ month, and 30% received ≥300 mg/month (Additional file 3: Figure S3). IV iron dose distributions in North America (58% of sample) were similar to Europe-A/NZ (42% of sample). The most common doses were 100 mg/month in the <300 mg/month group and 400 mg/ month in the ≥300mg/month group. Seventy-three percent of patients remained in the same IV iron dose category from 1 to 3 months, and 66% with one year of follow-up remained in the same IV iron dose category from 3 to 12 months (Additional file 4: Table S1).
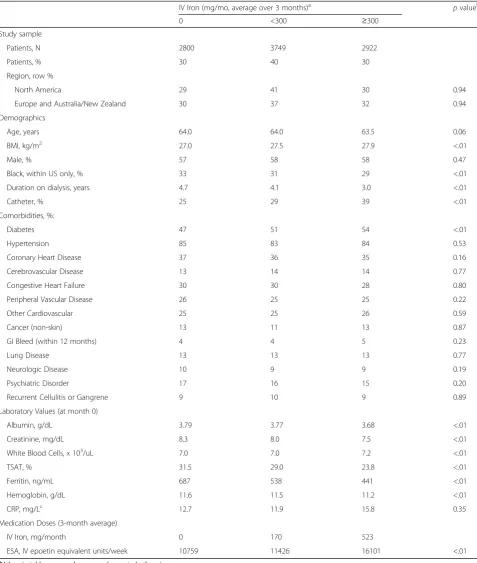
Patient characteristics by IV iron dose categories (Table 1)
Clinically meaningful differences in age, sex, and most comorbidities were not observed by IV iron dose cat-egory. Patients receiving higher doses of IV iron were more likely to receive dialysis via a central venous catheter.
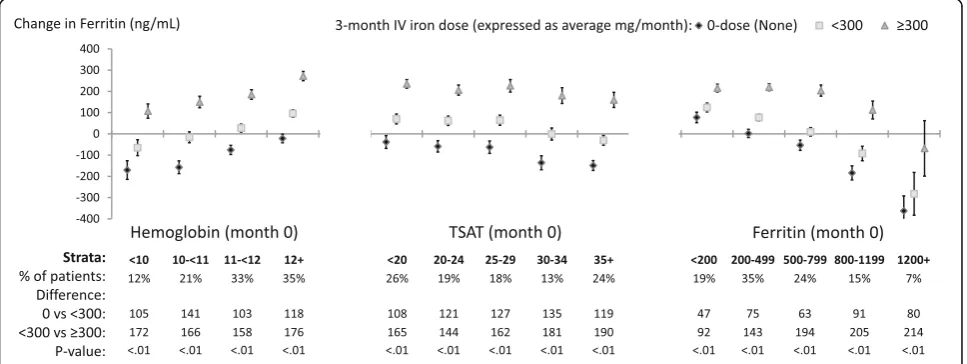
Change in Hgb (Fig. 1)
Relative change: A positive trend (p<0.05) between the three average monthly IV iron dose categories and ΔHgb3-0 was observed in all but one of the 14 total
Hgb0, TSAT0, and ferritin0strata. For the 14 strata, the
median (range) difference in ΔHgb3-0 was 0.18 (0.10 to
0.41) g/dL for IV iron <300 mg/month compared to no IV iron, and 0.13 (-0.07 to 0.40) g/dL for IV iron ≥300 mg/month compared to <300 mg/month. Absolute
change: Across Hgb0 strata, the absolute ΔHgb3-0
showed regression to the mean (generally consistent with treatment to target Hgb); namely Hgb increased for patients with Hgb0<11 g/dL in all IV iron dose categor-ies, and decreased for patients with Hgb0≥12 g/dL in all IV iron dose categories. By contrast, in all but two TSAT0 and ferritin0 strata the absolute ΔHgb3-0 was
negative when the mean monthly IV iron dose was 0. Across TSAT0and ferritin0strata, the absolute ΔHgb3-0
was near zero or slightly positive for IV iron <300 mg/ month and≥300 mg/month.
Change in ESA dose (Fig. 2)
Relative change: An inverse relationship (p<0.05) be-tween the three average monthly IV iron dose categories and ΔESA dose3-0 was observed in all but three of 14
total Hgb0, TSAT0, and ferritin0 strata. Absolute
change: The estimates for absolute ΔESA dose3-0 were
positive for IV iron 0 mg/month in 13 of the 14 total Hgb0,TSAT0, and ferritin0strata, and were negative for IV iron≥300 mg/month in all 14 Hgb0,TSAT0, and fer-ritin0 strata. Estimates for absolute ΔESA dose3-0 were
generally nearer to zero with IV iron <300 mg/month than with either 0 or ≥300 mg/month. The differences in absolute ΔESA dose3-0 across the three IV iron dose
groups were greater in the low compared to high Hgb0
and TSAT0 strata. No such pattern was evident across
ferritin0strata.
Changes in TSAT (Fig. 3) and ferritin (Fig. 4)
Relative change: Positive trends (p<0.05) between the three average monthly IV iron dose categories and both ΔTSAT3-0 and Δferritin 3-0were observed in all 14 total
Hgb0, TSAT0, and ferritin0strata. These associations were
directionally similar to those for change in Hgb (Fig. 1).
Maintenance versus replacement dosing patterns in the
≥300 mg/month category (Additional file 5: Figure S4)
Among patients in the≥300 mg/month category, the asso-ciations of IV iron dosing withΔHgb3-0were comparable
across Hgb0 strata for the replacement versus
mainten-ance IV iron dosing subgroups. In general, maintenmainten-ance dosing had a weaker (less positive) effect on ΔTSAT3-0
and a stronger (more positive) effect onΔferritin3-0than
Table 1Baseline characteristics by monthly IV iron dose category
IV Iron (mg/mo, average over 3 months)a pvalueb
0 <300 ≥300
Study sample
Patients, N 2800 3749 2922
Patients, % 30 40 30
Region, row %
North America 29 41 30 0.94
Europe and Australia/New Zealand 30 37 32 0.94
Demographics
Age, years 64.0 64.0 63.5 0.06
BMI, kg/m2 27.0 27.5 27.9 <.01
Male, % 57 58 58 0.47
Black, within US only, % 33 31 29 <.01
Duration on dialysis, years 4.7 4.1 3.0 <.01
Catheter, % 25 29 39 <.01
Comorbidities, %:
Diabetes 47 51 54 <.01
Hypertension 85 83 84 0.53
Coronary Heart Disease 37 36 35 0.16
Cerebrovascular Disease 13 14 14 0.77
Congestive Heart Failure 30 30 28 0.80
Peripheral Vascular Disease 26 25 25 0.22
Other Cardiovascular 25 25 26 0.59
Cancer (non-skin) 13 11 13 0.87
GI Bleed (within 12 months) 4 4 5 0.23
Lung Disease 13 13 13 0.77
Neurologic Disease 10 9 9 0.19
Psychiatric Disorder 17 16 15 0.20
Recurrent Cellulitis or Gangrene 9 10 9 0.89
Laboratory Values (at month 0)
Albumin, g/dL 3.79 3.77 3.68 <.01
Creatinine, mg/dL 8.3 8.0 7.5 <.01
White Blood Cells, x 103/uL 7.0 7.0 7.2 <.01
TSAT, % 31.5 29.0 23.8 <.01
Ferritin, ng/mL 687 538 441 <.01
Hemoglobin, g/dL 11.6 11.5 11.2 <.01
CRP, mg/Lc 12.7 11.9 15.8 0.35
Medication Doses (3-month average)
IV Iron, mg/month 0 170 523
ESA, IV epoetin equivalent units/week 10759 11426 16101 <.01
a
Values in table are sample mean unless noted otherwise bp
value for trend within row (across three iron dose categories), adjusted for region and accounting for facility clustering, using logistic model for dichotomous and linear mixed model for continuous measures
c
Sensitivity analyses
The associations of IV iron dose on outcomes were evaluated in additional subgroups such as strata of Hgb0-by-TSAT0, Hgb0-by-ESA dose, TSAT0-by-ESA dose (Additional file 6: Figure S5), iron dose over 3 months prior to month 0, and geographic region. For all categories with adequate sample size, the observed associations with IV iron dose were consistent with Figs. 1, 3, and 4. Exclusion of incident patients (<90 days on dialysis) had no material impact on results. Consideration of other functional forms for IV iron dose, including as a categorical variable with different
cut points or a continuous variable, yielded results con-sistent with the primary analysis. Restricting the IV iron dose period to 1 month demonstrated that the 1-month effect on Hgb, TSAT, and ferritin was directionally unchanged from, though quantitatively lower than, the 3-month effect (Additional file 7: Figure S6). Corrob-orative results were observed when lagging the out-come by one month (i.e., to month 4), when evaluating outcomes over 1 month of IV iron dosing, rather than 3 months, and when stratifying 1 or 3 month IV iron dose by prior 3-month iron dose, in effect providing estimates of the effect of a 4- to 6-month IV iron dose. Fig. 1Adjusted change inHemoglobin, from before to after IV iron dosing. Each stratum represents a separate model (14 total per figure) adjusted for age, sex, black race, time on dialysis, catheter use, BMI, region (Europe-ANZ, North America), 13 comorbid conditions, and the following measures at month 0: Hgb, white blood cell count; serum albumin, creatinine, ferritin, TSAT; and 3-month ESA dose (unless included in the outcome or strata). The vertical bars indicate 95% confidence intervals. Total sample size was 9,471
Fig. 2Adjusted change inESA dose, from before to after IV iron dosing. Each stratum represents a separate model (14 total per figure) adjusted for age, sex, black race, time on dialysis, catheter use, BMI, region (Europe-ANZ, North America), 13 comorbid conditions, and the following measures at month 0: Hgb, white blood cell count; serum albumin, creatinine, ferritin, TSAT; and 3-month ESA dose (unless included in the outcome or strata). The vertical bars indicate 95% confidence intervals. Total sample size was 9,471, with 10% missing outcome variable hence
Association with CRP levels (Additional file 8: Figure S7)
Strata of CRP0(<3, 3-<10, and 10+ mg/dL), an
inflamma-tory measure obtained commonly in European dialysis units, were evaluated. No directional associations were seen between average monthly IV iron dose and 3-month change in C-reactive protein, in contrast with the clear patterns of ‘dose response’ observed for the anemia-related outcomes.
Discussion
Our findings, from a multinational observational study of practice patterns in national samples of hemodialysis centers, provide support for the effectiveness of IV iron
dosing to raise or sustain Hgb across a wide range of starting Hgb, TSAT, and ferritin values in everyday prac-tice. Specifically, the results support the possibility that IV iron dosing of less than 300 mg/month, as commonly used for maintenance IV iron dosing at 50 mg per week or 50-100 mg every other week (the dominant dose range for this category was 100-200 mg/month) may be the most effective strategy to support Hgb while keeping TSAT and ferritin levels stable and limiting ESA dose. Higher IV iron doses were associated with lower doses of ESA, but at a price of a rise in ferritin (especially with maintenance dosing) and/or TSAT (especially with re-placement dosing). Along with studies supporting the Fig. 3Adjusted change inTSAT, from before to after IV iron dosing. Each stratum represents a separate model (14 total per figure) adjusted for age, sex, black race, time on dialysis, catheter use, BMI, region (Europe-ANZ, North America), 13 comorbid conditions, and the following measures at month 0: Hgb, white blood cell count; serum albumin, creatinine, ferritin, TSAT; and 3-month ESA dose (unless included in the outcome or strata). The vertical bars indicate 95% confidence intervals. Total sample size was 9,471
safety of IV iron in the 100-200 mg/month dose range, these results provide greater clarity to help guide the ra-tional use of IV iron in common clinical practice across a diverse range of dialysis centers and patients, and across diverse countries.
A motivation for our analysis was the paucity of data providing practical guidance for the comparative effect-iveness of different IV iron doses to optimize Hgb out-comes and ESA responsiveness in dialysis patients, which could help providers to limit administration of higher doses than necessary given uncertainty about clinical risk. Among HD patients with absolute or func-tional iron deficiency, the effectiveness of IV iron to raise Hgb levels is established [2, 31–33]. For most HD patients, who have neither absolute nor functional iron deficiency, small clinical studies consistently have shown that optimizing IV iron dosing supports Hgb levels while decreasing ESA dose requirements [22–30]. However, no interventional trials or adequately controlled large obser-vational studies have sufficiently evaluated the effective-ness of different IV iron dosing strategies to support Hgb responsiveness to ESA dosing in broader dialysis practice. Absent clear evidence or consensus guidelines, anemia management protocols are highly diverse, and patients re-ceive markedly different cumulative exposures to IV iron and ESAs [31–38].
To help address this evidence gap, our analysis corrobo-rates the positive dose response (relative change) between IV iron and Hgb, TSAT, and ferritin levels, well known from smaller studies, in a large database reflective of routine clinical care in diverse settings internationally. This work also provides estimates of the magnitude of the effect of IV iron on 3-month change in Hgb in routine clinical practice, demonstrating a median difference of 0.18 g/dL for IV iron doses of <300 mg/month versus 0, and of 0.13 g/dL for IV iron doses of ≥300 versus <300 mg/month, varying modestly across Hgb0, TSAT0, or
fer-ritin0strata.
Based on our Medical Director Survey data (not shown) specifying target ranges for Hgb, TSAT, and ferritin levels, the majority of patients in this analysis had values of these measures that were at or near tar-get range. For such patients, an important goal of anemia management is to maintain Hgb at stable levels (i.e.,absolute changeof zero), while optimizing ESA dosing. Deviations have been referred to as Hgb variability, cycling, or excursions, and have been associated with adverse clinical outcomes [46–49]. Furthermore, maintaining stable TSAT and ferritin levels in the target range plausibly has beneficial clin-ical and cost implications. In our analyses, we note that Hgb, TSAT, and ferritin levels were most often unchanged (absolute change = 0) from before to after IV iron dosing of <300 mg/month. This finding held
across broad ranges of prior Hgb, TSAT, and ferritin levels, inclusive of common targets such as Hgb 10-12 g/dL, TSAT 20%-34%, and ferritin 200-799 ng/mL. The <300 mg/month IV iron dosing category includes some common maintenance IV iron dosing regimens, e.g., 50 mg/week or 50-100 mg every other week (Add-itional file 3: Figure S3). We therefore extrapolate that this IV iron dosing strategy may be the best means to maintain stable Hgb, TSAT, and ferritin levels in many patients.
Among patients receiving IV iron at ≥300 mg/month, our analysis estimated the effects of high dose mainten-ance (e.g., 100 mg weekly) versus replacement (e.g., 500mg or 1000 mg bolus) dosing (Additional file 5: Figure S4). While the observed effects on Hgb levels were comparable, both strategies were associated with increases in TSAT and ferritin levels even among pa-tients with high prior TSAT (up to 35%) and ferritin (up to 1200 ng/mL) levels. These observed effects may indicate administration of unnecessarily high cumula-tive IV iron doses; for example, maintenance dosing (which has lesser short-term, but perhaps greater long-term, effect on raising ferritin levels than replacement dosing) was associated with an increase in ferritin of an additional 63 ng/mL for patients with ferritin levels already at 500-799 ng/mL. These findings provide fur-ther support for use in common practice of IV iron dosing at <300 mg/month, compared to ≥300 mg/ month whether by maintenance or replacement dosing.
Relative decreases in 3-month ESA dose were consist-ently seen for IV iron dose <300 mg/month compared to no IV iron, especially at low Hgb0and TSAT0levels.
While IV iron≥300 mg/month was associated with even larger relative decreases in 3-month ESA dose, the abso-lute change in ESA dose was generally closest to 0 fol-lowing IV iron dosing of <300 mg/month. This finding supports the possibility that IV iron dosing at <300 mg/ month may, on average, limit the need for ESA dosing adjustments, a desirable goal in everyday dialysis prac-tice. Especially for patients with low Hgb0(<11 g/dL) or
low TSAT0(<20%) levels, the large increase in Hgb level
and large decline in ESA dose following IV iron dosing emphasize the importance of sufficient IV iron dosing in such patients to limit unnecessarily high ESA dose.
Our analysis evaluated effectiveness rather than safety outcomes, but our conclusion that IV iron dosing at 100-200 mg/month (the most common doses in <300mg/ month group) may be optimally effective to support Hgb levels is notable when placed in the context of existing literature because, to our knowledge, studies have found elevation in clinical risk only at higher (e.g., ≥300 mg/ month) IV iron doses [6–14].
effect of IV iron dose over up to 6 months, analyses are needed to confirm our findings over longer follow-up intervals. Second, the analysis provides information on average, but doesn’t provide insight into the most ef-fective IV iron dosing strategies for all situations in clinical practice, such as patients with Hgb levels sub-stantially above or below target or patients who are hy-poresponsive to ESA therapy. Third, this was a study of prevalent HD patients, most of whom are not naïve to anemia treatment; however, prior treatment history cannot be fully represented in the analysis. Fourth, all observational studies are subject to biased interpret-ation due to confounding. However, the associinterpret-ations seen are directionally consistent with causal rather than confounded interpretations. Confounding would tend to bias the effect of IV iron on Hgb to the null, since patients receiving higher doses of IV iron are more likely to be ESA resistant than patients receiving lower dose or no IV iron. Fifth, we were unable to report esti-mated effects of different IV iron formulations because, within a geographic region, there was often only one product in predominant use [38, 40].
Conclusion
Though IV iron use in dialysis units is nearly ubiquitous, the optimal way to dose and manage iron parameters to treat anemia is controversial and deserves input from ana-lyses of actual clinical practice. Our observational findings from the international DOPPS provide support for the effectiveness of IV iron dosing to raise or sustain Hgb levels across a wide range of Hgb, TSAT, and ferritin values. Further, the findings indicate that IV iron dosing at <300 (typically 100-200) mg/month, as used for some maintenance IV iron dosing protocols, may be a more suitable strategy for average patients to support Hgb, while keeping TSAT and ferritin levels stable and reducing or limiting ESA doses, than the higher doses, by either maintenance or replacement dosing, that are common in many European and North American dialysis clinics. Along with studies that support the safety of IV iron in the same 100-200 mg/month dose range, these findings can help to inform clinical practice guidelines and anemia management protocols in everyday hemodialysis practice.
Additional files
Additional file 1: Figure S1.Flow Chart for Selection of Analysis Sample. (PPTX 540 kb)
Additional file 2: Figure S2.Schematic of timing of IV iron dose, ESA dose, and laboratory measures in analytic models. (PPTX 529 kb)
Additional file 3: Figure S3.Distribution of 3-month IV iron dose. (PPTX 546 kb)
Additional file 4: Table S1.Joint distributions of 3-month and 12-month IV iron doses (% of patients). (DOCX 34 kb)
Additional file 5: Figure S4.Adjusted change in hemoglobin, TSAT, or ferritin from before to after IV iron dosing, dividing≥300 mg/month into maintenance and replacement dosing categories. (PPTX 89 kb)
Additional file 6: Figure S5.Adjusted change in Hemoglobin, from before to after IV iron dosing stratified by ESA Dose and TSAT. (PPTX 117 kb)
Additional file 7: Figure S6.Adjusted change in 1-month Hemoglobin, TSAT, or Ferritin from before to after IV iron dosing. (PPTX 88 kb)
Additional file 8: Figure S7.Adjusted change in CRP, from before to after IV iron dosing. (PPTX 56 kb)
Abbreviations
DOPPS:Dialysis Outcomes and Practice Patterns Study; ESA: erythropoiesis-stimulating agents; GEE: generalized estimating equation; HD: hemodialysis; Hgb: hemoglobin; IV: intravenous; TSAT: transferrin saturation
Acknowledgements
Jennifer McCready-Maynes, an employee of Arbor Research Collaborative for Health, provided editorial assistance.
Funding
The DOPPS program is supported by Amgen, Kyowa Hakko Kirin, AbbVie Inc., Sanofi Renal, Baxter Healthcare, and Vifor Fresenius Medical Care Renal Pharma, Ltd. Additional support for specific projects and countries is also provided in Canada by Amgen, BHC Medical, Janssen, Takeda, Kidney Foundation of Canada (for logistics support); in Germany by Hexal, DGfN, Shire, WiNe Institute; for PDOPPS in Japan by the Japanese Society for Peritoneal Dialysis (JSPD). All support is provided without restrictions on publications.
Availability of data and materials
The analysis dataset for the current study is available from the corresponding author on reasonable request.
Authors’contributions
BMR, ML, BB, WK, YL, FL, KPM, JGN, FKP, RLP made substantial contributions to conception and design, or acquisition of data, or analysis and interpretation of data; BMR, ML, BB, WK, YL, FL, JGN, FKP, RLP have been involved in drafting the manuscript or revising it critically for important intellectual content; BMR, ML, BB, WK, YL, FL, KPM, JGN, FKP, RLP have given final approval of the version to be published. Each author should have participated sufficiently in the work to take public responsibility for appropriate portions of the content; and All authors agreed to be accountable for all aspects of the work in ensuring that questions related to the accuracy or integrity of any part of the work are appropriately investigated and resolved. All authors read and approved the final manuscript.
Ethics approval and consent to participate
IRB approval was obtained from E&I West Coast Board on May 23, 2016, IRB # IRB00007807. Written, informed consent was obtained from participants.
Consent for publication
Not applicable.
Competing interests
F.L. was on the advisory board and/or speaker at symposia sponsored by Amgen, Astellas, Janssen, Roche. J.N. was employed by Vifor Pharma, Glattbrugg, Switzerland at the time of the study. W.K. has relationships with Hexal AG, Lilly Deutschland GmbH, Sanofi-Aventis Deutschland GmbH. B.M.R., M.L., B.B., Y.L., K.M., F.K.P., and R.L.P. are employees of Arbor Research Collab-orative for Health (which administers the DOPPS) and have no additional conflicts to declare.
Publisher’s Note
Springer Nature remains neutral with regard to jurisdictional claims in published maps and institutional affiliations.
Author details
1Arbor Research Collaborative for Health, 340 E. Huron, Suite 300, Ann Arbor,
Düsseldorf, Germany.4Department of Nephrology, Alessandro Manzoni Hospital, Via dell’Eremo, 9/11, 23900 Lecco, LC, Italy.5Vifor Pharma, Flughofstrasse 61, 8152 Glattbrugg, Switzerland.
Received: 24 February 2017 Accepted: 20 October 2017
References
1. Charytan C, Levin N, Al-Saloum M, Hafeez T, Gagnon S, Van Wyck DB. Efficacy and safety of iron sucrose for iron deficiency in patients with dialysis-associated anemia: North American clinical trial. Am J Kidney Dis 2001;37(2):300–7.
2. Coyne DW, Kapoian T, Suki W, Singh AK, Moran JE, Dahl NV, Rizkala AR. Ferric Gluconate Is Highly Efficacious in Anemic Hemodialysis Patients with High Serum Ferritin and Low Transferrin Saturation: Results of the Dialysis Patients’Response to IV Iron with Elevated Ferritin (DRIVE) Study. J Am Soc Nephrol. 2007;18:975–84.
3. Chang CH, Chang CC, Chiang SS. Reduction in erythropoietin doses by the use of chronic intravenous iron supplementation in iron-replete hemodialysis patients. Clin Nephrol. 2002;57(2):136–41. 4. Fishbane S, Frei GL, Maesaka J. Reduction in recombinant human
erythropoietin doses by the use of chronic intravenous iron supplementation. Am J Kidney Dis. 1995;26(1):41–6.
5. Kapoian T, O'Mara NB, Singh AK, Moran J, Rizkala AR, Geronemus R, Kopelman RC, Dahl NV, Coyne DW. Ferric gluconate reduces epoetin requirements in hemodialysis patients with elevated ferritin. J Am Soc Nephrol. 2008;19(2):372–9.
6. Bailie GR, Larkina M, Goodkin DA, Li Y, Pisoni RL, Bieber B, Mason N, Tong L, Locatelli F, Marshall MR, Inaba M, Robinson BM. Data from the Dialysis Outcomes and Practice Patterns Study validate an association between high intravenous iron doses and mortality. Kidney Int. 2015;87(1):162–8. 7. Boulware EL, Tangri N, Ephraim PL, Scialla JJ, Sozio SM, Crews DC, Shafi T,
Miskulin DC, Liu J, St Peter W, Jaar BG, Wu AW, Powe NR, Navaneethan SD, Bandeen-Roche K. Comparative effectiveness studies to improve clinical outcomes in end stage renal disease: the DEcIDE patient outcomes in end stage renal disease study. BMC Nephrol. 2012;6(13):167.
8. Brookhart MA, Freburger JK, Ellis AR, Wang L, Winkelmayer WC, Kshirsagar AV. Infection risk with bolus versus maintenance iron supplementation in hemodialysis patients. J Am Soc Nephrol. 2013;24(7):1151–8.
9. Brookhart MA, Schneeweiss S, Avorn J, Bradbury BD, Liu J, Winkelmayer WC. Comparative mortality risk of anemia management practices in incident hemodialysis patients. JAMA. 2010;303(9):857–64.
10. Feldman HI, Joffe M, Robinson B, Knauss J, Cizman B, Guo W, Franklin-Becker E, Faich G. Administration of parenteral iron and mortality among hemodialysis patients. J Am Soc Nephrol. 2004;15:1623–32.
11. Feldman HI, Santanna J, Guo W, Furst H, Franklin E, Joffe M, Marcus S, Faich G. Iron administration and clinical outcomes in hemodialysis patients. J Am Soc Nephrol. 2002;13:734–44.
12. Kalantar-Zadeh K, Regidor DL, McAllister CJ, Michael B, Warnock DG. Time-dependent associations between iron and mortality in hemodialysis patients. J Am Soc Nephrol. 2005;16:3070–80.
13. Miskulin DC, Tangri N, Bandeen-Roche K, Zhou J, McDermott A, Meyer KB, Ephraim PL, Michels WM, Jaar BG, Crews DC, Scialla JJ, Sozio SM, Shafi T, Wu AW, Cook C, Boulware LE. Intravenous Iron Exposure and Mortality in Patients on Hemodialysis. Clin J Am Soc Nephrol. 2014;9:1930–9. 14. Tangri N, Miskulin DC, Zhou J, Bandeen-Roche K, Michels WM, Ephraim PL,
McDermott A, Crews DC, Scialla JJ, Sozio SM, Shafi T, Jaar BG, Meyer K, Boulware LE. Effect of intravenous iron use on hospitalizations in patients undergoing hemodialysis: a comparative effectiveness analysis from the DEcIDE-ESRD study. Nephrol Dial Transplant. 2015;30(4):667–75. 15. Ghoti H, Rachmilewitz EA, Simon-Lopez R, Gaber R, Katzir Z, Konen E,
Kushnir T, Girelli D, Campostrini N, Fibach E, Goitein O. Evidence for tissue iron overload in long-term hemodialysis patients and the impact of withdrawing parenteral iron. Eur J Haematol. 2012;89:87–93.
16. Rostoker G, Griuncelli M, Loridon C, Couprie R, Benmaadi A, Bounhiol C, Roy M, Machado G, Janklewicz P, Drahi G, Dahan H, Cohen Y. Hemodialysis-associated hemosiderosis in the era of erythropoiesis-stimulating agents: a MRI study. Am J Med. 2012;125(10):991–9.
17. Drüeke T, Witko-Sarsat V, Massy Z, Descamps-Latscha B, Guerin AP, Marchais SJ, Gausson V, London GM. Iron therapy, advanced oxidation protein
products, and carotid artery intima-media thickness in end-stage renal disease. Circulation. 2002; 22;106(17):2212–7.
18. Fishbane S, Matthew A, Vaziri ND. Iron toxicity: relevance for dialysis patients. Nephrol Dial Transplant. 2014;29(2):255–9.
19. Gupta A, Zhuo J, Zha J, Reddy S, Olp J, Pai A. Effect of different intravenous iron preparations on lymphocyte intracellular reactive oxygen species generation and subpopulation survival. BMC Nephrol. 2010;17;11:16. 20. Kuo KL, Hung SC, Wei YH, Tarng DC. Intravenous iron exacerbates oxidative
DNA damage in peripheral blood lymphocytes in chronic hemodialysis patients. J Am Soc Nephrol. 2008;19(9):1817–26.
21. Zager RA, Johnson AC, Hanson SY. Parenteral iron therapy exacerbates experimental sepsis. Kidney Int. 2004;65(6):2108–12.
22. Macdougall IC, Bircher AJ, Eckardt KU, Obrador GT, Pollock CA, Stenvinkel P, Swinkels DW, Wanner C, Weiss G, Chertow GM. Iron management in chronic kidney disease: conclusions from a "Kidney Disease: Improving Global Outcomes" (KDIGO) Controversies Conference. Kidney Int. 2016;89(1):28–39. 23. EU Clinical Trials Register. Available at: https://www.clinicaltrialsregister.eu/
ctr-search/trial/2013-002267-25/GB. Accessed 18 May 2015. 24. DeVita MV, Frumkin D, Mittal S, Kamran A, Fishbane S, Michelis MF.
Targeting higher ferritin concentrations with intravenous iron dextran lowers erythropoietin requirement in hemodialysis patients. Clin Nephrol. 2003;60(5):335–40.
25. Tessitore N, Solero GP, Lippi G, Bassi A, Faccini GB, Bedogna V, Gammaro L, Brocco G, Restivo G, Bernich P, Lupo A, Maschio G. The role of iron status markers in predicting response to intravenous iron in haemodialysis patients on maintenance erythropoietin. Nephrol Dial Transplant. 2001;16: 1416–23.
26. Richardson D, Bartlett C, Will EJ. Optimizing Erythropoietin Therapy in Hemodialysis Patients. Am J Kidney Dis. 2001;38(1):109–17.
27. Descomes E, Fellay G. Improved Response to Erythropoietin Therapy with Long-Term Continuous Iron Supplementation. Nephron. 2000;84:196–7. 28. Macdougall IC, Chandler G, Elston O, Harchowal J. Beneficial effects of
adopting an aggressive intravenous iron policy in a hemodialysis unit. Am J Kidney Dis. 1999;34(4 Suppl 2):S40–6.
29. Besarab A, Amin N, Ahsan M, Vogel SE, Zazuwa G, Frinak S, Zazra JJ, Anandan JV, Gupta A. Optimization of epoetin therapy with intravenous iron therapy in hemodialysis patients. J Am Soc Nephrol. 2000;11(3):530–8. 30. Besarab A, Kaiser JW, Frinak S. A study of parenteral iron regimens in
hemodialysis patients. Am J Kidney Dis. 1999;34(1):21–8.
31. KDIGO. Clinical Practice Guideline for Anemia in Chronic Kidney Disease. Kidney Int. 2012;(Suppl 2):279–335.
32. Locatelli F, Barany P, Covic A, De Francisco A, Del Vecchio L, Goldsmith D, Hörl W, London G, Vanholder R, Van Biesen W. Kidney Disease: Improving Global Outcomes guidelines on anaemia management in chronic kidney disease: A European Renal Best Practice position statement. Nephrol Dial Transplant. 2013;28:1346–59.
33. Kliger AS, Foley RN, Goldfarb DS, Goldstein SL, Johansen K, Singh A, Szczech L. KDOQI US Commentary on the 2012 KDIGO Clinical Practice Guideline for Anemia in CKD. Am J Kidney Dis. 2013;62(5):849–59.
34. Moist LM, Troyanov S, White CT, Wazny LD, Wilson JA, McFarlane P, Harwood L, Sood MM, Soroka SD, Bass A, Manns BJ. Canadian Society of Nephrology commentary on the 2012 KDIGO Clinical Practice Guideline for Anemia in CKD. Am J Kidney Dis. 2013;62(5):860–73.
35. National Institute for Health and Care Excellence. Anaemia Management in chronic kidney disease (update). http://www.nice.org.uk/guidance/ indevelopment/gid-cgwaver142. Accessed May 2015. To be Published May 2015.
36. McFarlane PA, Pisoni RL, Eichleay MA, Wald R, Port FK, Mendelssohn D. International trends in erythropoietin use and hemoglobin levels in hemodialysis patients. Kidney Int. 2010;78(2):215–23.
37. Pisoni RL, Bragg-Gresham JL, Young EW, Akizawa T, Asano Y, Locatelli F, Bommer J, Cruz JM, Kerr PG, Mendelssohn DC, Held PJ, Port FK. Anemia management outcomes from 12 countries in the Dialysis Outcomes and Practice Patterns Study (DOPPS). Am J Kidney Dis. 2004;44(1):94–111. 38. Bailie GR, Larkina M, Goodkin DA, Li Y, Pisoni RL, Bieber B, Mason N, Tong L,
Locatelli F, Marshall MR, Inaba M, Robinson BM. Variation in intravenous iron use internationally and over time: The Dialysis Outcomes and Practice Patterns Study (DOPPS). Nephrol Dial Transplant. 2013;28(10):2570–9. 39. Freburger JK, Ng LJ, Bradbury BD, Kshirsagar AV, Brookhart MA. Changing
40. DOPPS Practice Monitor. http://www.dopps.org/DPM/. Accessed 6 June 2015. 41. Fuller DS, Pisoni RL, Bieber BA, Port FK, Robinson BM. The DOPPS Practice
Monitor for US dialysis care: Update on trends in anemia management 2 years into the bundle. Am J Kidney Dis. 2013;62(6):1213–6.
42. Karaboyas A, Zee J, Morgenstern H, Nolen JG, Hakim R, Kalantar-Zadeh K, Zager P, Pisoni RL, Port FK, Robinson BM. Understanding the Recent Increase in Ferritin Levels in US Dialysis Patients: Potential Impact of Changes in IV Iron ESA Dosing. Clin J Am Soc Nephrol. 2015;10(10):1814–21. 43. Young EW, Goodkin DA, Mapes DL, Port FK, Keen ML, Chen K, Maroni BL,
Wolfe RA, Held PJ. The Dialysis Outcomes and Practice Patterns Study: an international hemodialysis study. Kidney Int. 2000;57:S74–81.
44. Pisoni RL, Gillespie BW, Dickinson DM, Chen K, Kutner MH, Wolfe RA. The Dialysis Outcomes and Practice Patterns Study (DOPPS): design, data elements, and methodology. Am J Kidney Dis. 2004;44(Suppl 2):7–15. 45. IVEware: Imputation and Variance Estimation Software by: Trivellore E.
Raghunathan, Peter W. Solenberger, John Van Hoewyk.
46. Eckardt KU, Kim J, Kronenberg F, Aljama P, Anker SD, Canaud B, Molemans B, Stenvinkel P, Schernthaner G, Ireland E, Fouqueray B, Macdougall IC. Hemoglobin variability does not predict mortality in European hemodialysis patients. J Am Soc Nephrol. 2010;21(10):1765–75.
47. Kuragano T, Matsumura O, Matsuda A, Hara T, Kiyomoto H, Murata T, Kitamura K, Fujimoto S, Hase H, Joki N, Fukatsu A, Inoue T, Itakura I, Nakanishi T. Association between hemoglobin variability, serum ferritin levels, and adverse events/ mortality in maintenance hemodialysis patients. Kidney Int. 2014;86:845–54.
48. Berns JS, Elzein H, Lynn RI, Fishbane S, Meisels IS, Deoreo PB. Hemoglobin variability in epoetin-treated hemodialysis patients. Kidney Int.
2003;64:1514–21.
49. Yang W, Israni RK, Brunelli SM, Joffe MM, Fishbane S, Feldman HI. Hemoglobin Variability and Mortality in ESRD. J Am Soc Nephrol. 2007;18(12):3164–70.
• We accept pre-submission inquiries
• Our selector tool helps you to find the most relevant journal • We provide round the clock customer support
• Convenient online submission • Thorough peer review
• Inclusion in PubMed and all major indexing services • Maximum visibility for your research
Submit your manuscript at www.biomedcentral.com/submit